

-
土壤有机碳是土壤重要组成部分和土壤肥力的关键指标,又是全球碳循环的重要组成部分,因而,成为全球气候变化领域研究的焦点之一。森林土壤是森林生态系统的重要组成部分,是陆地生态系统最大的有机碳库之一[1-3]。森林土壤有机碳储量约为全球土壤碳储量的73%,约占森林生态系统有机碳库的2/3[4]。森林土壤碳储量发生轻微的变化,可能会引起CO2浓度的强烈变化[5-6]。
北半球温带森林起着重要的碳汇作用[7-9],并可能导致CO2“失汇”[10]。华北地区是我国暖温带落叶阔叶林的重要分布区。土壤碳库是森林陆地碳库中最重要的一环,土壤有机碳含量、垂直分布、碳密度和碳储量是重要的碳库指标[11]。许多学者利用土壤普查数据以及剖面分布图对华北地区进行区域或植被尺度土壤碳储量估算[12-14],这种估算往往存在一定的偏差,需要依靠林分尺度的研究提供依据。
林分类型不同,其输入土壤的枯落物以及根系分泌物也不同,从而导致土壤有机碳积累状况存在较大差异[15]。目前,关于华北地区不同林分类型的土壤有机碳库特征的研究正逐步深入,并有不同的认识。方精云等[16]在东灵山的研究显示,华北地区阔叶林和针叶林土壤碳密度差异不大;耿玉清等[17]在北京西山的研究则显示,阔叶林比针叶林更能积累土壤有机碳;朱丽平等[18]认为,阔叶林下土壤较针叶林有更大的固碳潜力;李娜等[19]在东灵山研究显示,土壤有机碳含量大小为白桦林 > 辽东栎+棘皮桦混交林 > 辽东栎林,这与刘国华等[20]研究得出结论相同;而王文静等[21]研究显示,栎林下土壤碳储量高于混交林。
松山国家级自然保护区拥有在华北地区保持完好的典型且丰富的植被类型,天然油松(Pinus tabuliformis Carriere.)林森林生态系统是保护区内最具特色的森林群落类型,对油松林碳储量及养分垂直分布已有相关研究[22-24];保护区内还分布有胡桃楸(Juglans mandshurica Maxim.)、山杨(Populus davidiana Dode.)、白桦(Betula platyphylla Suk.)、榆树(Ulmus pumila L.)为主要树种的暖温带落叶阔叶次生林。本研究以5种典型林分为研究对象,分析林下不同土层土壤有机碳含量、密度垂直分布特征及与土壤理化性质的关系,探讨不同林分类型下土壤有机碳积累与变化规律,为发挥森林土壤潜力和应对气候变化提供科学依据。
-
研究区位于北京市西北部延庆区松山自然保护区(115°43′44″~115°50′22″ E,40°29′9″~40°33′35″ N),该区域地处燕山山脉海坨山南麓,森林覆盖率87.6%,海拔628~2 198 m。该区成土母岩多为花岗岩,土壤垂直变化明显,主要有山地褐土、山地棕壤和山地草甸土。属于暖温带大陆性季风气候,年均气温8.9℃,年均最低气温−27.3℃,年均日照时数2 836 h,无霜期约150 d,年降水量493 mm,年蒸发量1 772 mm。主要乔木树种有:山杏(Armeniaca sibirica (L.) Lam.)、白桦、油松、核桃楸、榆树、山杨、辽东栎(Quercus wutaishansea Mary.)、黑桦(Betula dahurica Pall.)、蒙古栎(Quercus mongolica Fisch. ex Ledeb.)等。
-
依据研究区油松林、针阔混交林(山杨与油松)、核桃秋林、蒙古栎林、山杨林等5种典型林分类型的分布情况,考虑海拔、坡度、坡位、坡向以及林分密度等对土壤有机碳的影响,在每种林分类型设面积均为20 m × 20 m的3块标准地,共计15块样地。分别对所选标准地进行相关因子调查,样地基本概况见表1。样地土壤类型均为棕壤,林分起源均为天然林,林龄组成均为成熟林。
表 1 样地基本概况
Table 1. General characteristics of five stands
林分类型
Stand types林龄
Stand age/
a海拔
Elevation/
m坡度
Slope/
(°)坡向
Aspect凋落物厚度
Litter depth/
cm密度
Density/
(株·hm−2)郁闭度
Canopy/
%伴生树种
Associated tree species核桃楸林 Juglans mandshurica 68 815 25 东 East 2.5 1 120 85 丁香 Syzygium aromaticum
白蜡 Fraxinus chinensis蒙古栎林 Quercus mongolica 85 856 23 东北 Northeast 3.5 985 80 三裂绣线菊 Spiraea trilobata
平榛 Corylus heterophylla山杨林 Populus davidiana 72 869 21 北 North 1.0 922 80 山杏 Prunus sibirica
白蜡 Fraxinus chinensis针阔混交林 Pine-poplar mixed forest 78 895 27 东南 Southeast 5.0 1 078 85 大花溲疏 Deutzia grandiflora
胡枝子 Lespedeza bicolor
元宝槭 Acer truncatum油松林 Pinus tabuliformis 80 941 18 东 East 7.0 894 80 暴马丁香 Syringa amurensis
毛榛 Corylus mandshurica注:表中每个林分类型数据为3块标准地的平均值。下同。
Note:Data of each stand are mean of three sampling plots.The same below. -
参照中华人民共和国林业行业标准 LY/T 1952—2011(森林生态系统长期定位观测方法)进行土壤野外调查和样品采集。在20 m × 20 m的各标准地内按三点布点法,设置并进行土壤剖面挖掘,深度100 cm。土壤剖面层次由上而下划分为:A、AB、B、BC、C共5层。每个剖面按层次先下后上采集分析土样及环刀样。将每块标准地内土样进行同层次混合,保留土样1 kg左右,共计75 份土壤样品,作为分析土样带回实验室风干备用。每种林分土壤层次平均深度见表2。
表 2 不同林分土壤层次深度
Table 2. Soil genetic horizon depths of different stand types
层次
Genetichorizon不同林分类型不同土层深度 (Soil genetic horizon depths of different stand types)/cm 核桃楸林
Juglans mandshurica蒙古栎林
Quercus mongolica山杨林
Populus davidiana针阔混交林
Pine-poplar mixed forest油松林
Pinus tabuliformisA 0~8 0~5 0~10 0~7 0~5 AB 8~22 5~20 10~25 7~19 5~18 B 22~39 20~45 25~45 19~39 18~33 BC 39~62 45~65 45~70 39~65 33~53 C 62~100 65~100 70~100 65~100 53~100 -
土壤样品处理和各理化性质分析方法均参照林业行业标准或相关农业标准。森林土壤样品的采集与制备,方法参考LY/T 1210—1999。土壤密度测定采用环刀法,方法参考NY/T 1121.4—2006。土壤颗粒组成测定采用吸管法,方法参考LY/T 1225—1999。土壤有机质测定采用硫酸-重铬酸钾容量法,方法参考LY/T 1237—1999。土壤全氮测定采用凯氏消煮法,方法参考LY/T 1228—2015
-
取自同一林分不同土壤层次的理化性质数据取算术平均值。
由于不同林分类型剖面土层厚度不同,故采用分层法计算各土层土壤碳密度[25],公式如下:
$ SO{C_s} = \sum\limits_{i = 1}^n {{T_i} \times } {p_i} \times {M_i} \times \left( {1 - {C_i}} \right) \times 0.1 $
式中:SOCS为土壤有机碳密度(t·hm−2);Ti为第i层土层厚度(cm);pi为第i层土壤密度(g·cm−3);Mi为第i层土壤有机碳含量(g·kg−1);Ci为 > 2 mm的石砾含量(%);n为剖面土层数。
因按土壤发生层进行土壤层次划分,各土壤层次深度均不相同,不便对土壤碳密度进行对比分析,因此,对计算得到的不同林分类型下土壤有机碳密度进行归一化处理,即计算:
单位cm厚度土壤有机碳密度(t·hm−2)=各层次土壤有机碳密度/土层厚度
将得到的数据分配到指定深度(图1A),其方块面积即该土壤层次有机碳密度,此图可直观的研究土壤碳密度的垂直变化;无论土壤层次如何划分,归一化处理后也可将多组数据置于同一图中直观显示(图1B),可以对任意深度土壤碳密度进行比较,便于对比分析,更好的揭示其各自土壤碳密度垂直分布特征。
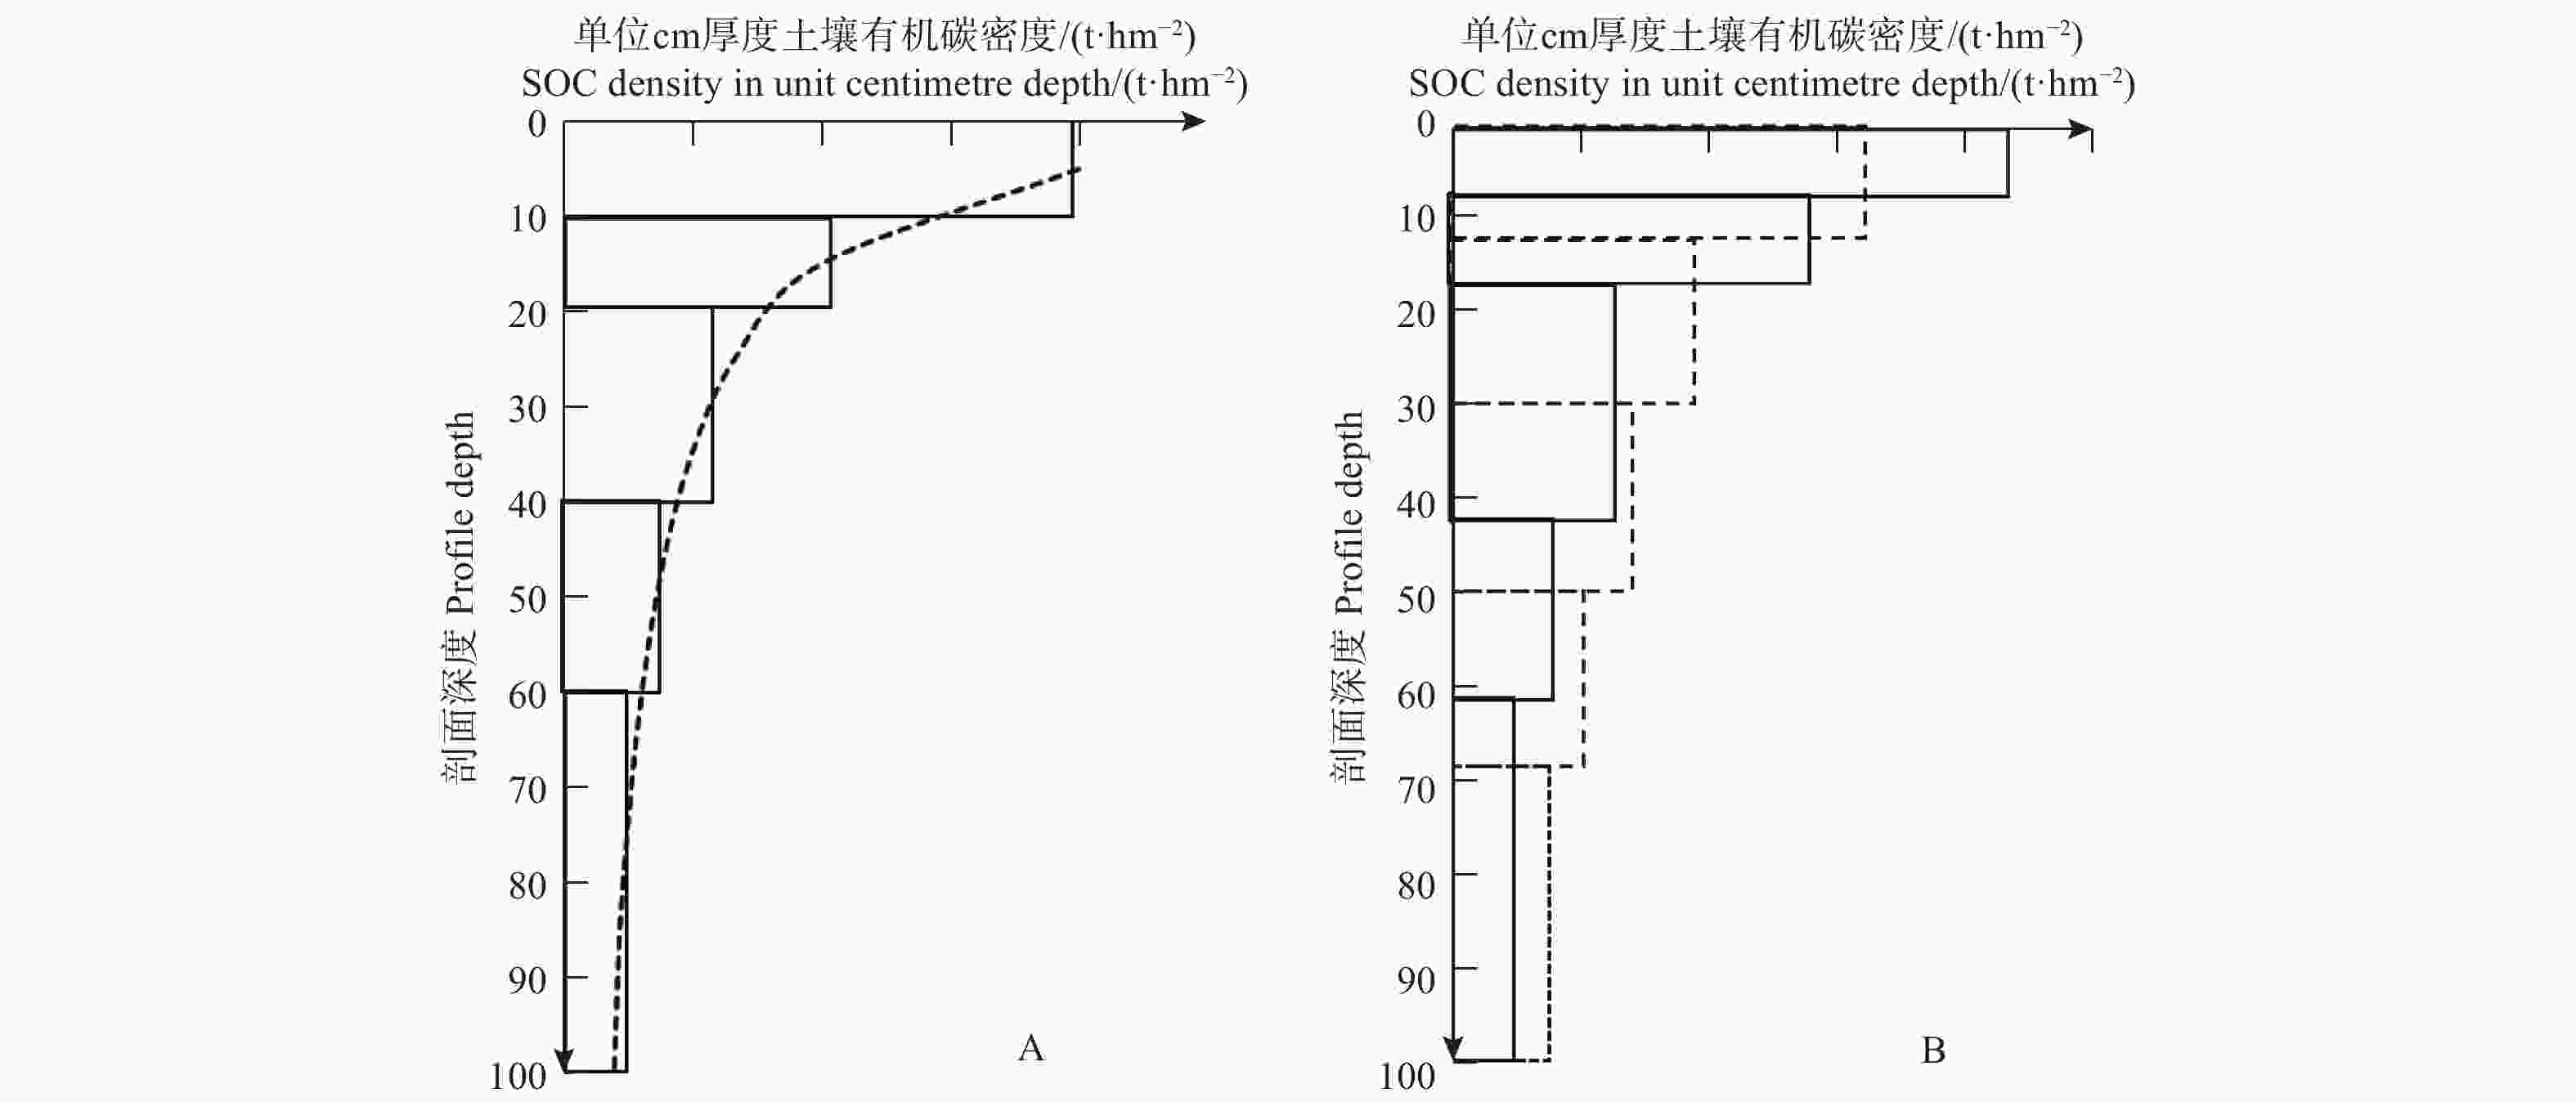
图 1 数据归一化处理后有机碳分布示意图
Figure 1. Sketch map of SOC distribution by data standardization
图、表与其中数据的处理均采用Microsoft Excel及SPSS18.0完成。用单因素方差分析(one-way ANOVA)检验林分类型和土壤层次对土壤有机碳含量和密度的差异显著性(p < 0.05),再用Duncan法进行多重比较;用Pearson相关系数评价有机碳与理化性质因子之间的相关关系。
-
表3表明:不同林分类型各土层土壤有机碳含量为9.35~50.25 g·kg−1,均值为27.42 g·kg−1。100 cm土层土壤有机碳含量均值不同,山杨林土壤有机碳含量均值最低,为23.92 g·kg−1,油松林土壤有机碳含量均值最高,达30.41 g·kg−1,比山杨林高27%,土壤有机碳含量均值由小到大排序:山杨林 < 针阔混交林 < 核桃楸林 < 蒙古栎林 < 油松林。单因素方差分析表明(表3):除A层核桃楸林与山杨林及AB层蒙古栎林与针阔混交林土壤有机碳含量差异不显著外,林分类型对不同土层土壤有机碳含量影响显著(p < 0.05)。
表 3 不同林分类型各土层土壤有机碳含量
Table 3. The SOC contents of different soil genetic horizons under different forest stands
层次
Genetichorizon土壤有机碳含量
Soil orangic carbon content (SOC)/(g·kg−1)核桃楸林
Juglans mandshurica蒙古栎林
Quercus mongolica山杨林
Populus davidiana针阔混交林
Pine-poplar mixed forest油松林
Pinus tabuliformis平均值
MeanA 38.42 ± 0.23aD 50.25 ± 0.33aA 38.08 ± 0.19aD 43.32 ± 0.25aB 40.95 ± 0.36aC 42.20 AB 32.52 ± 0.13bC 39.95 ± 0.17bA 28.37 ± 0.22bD 39.84 ± 0.20bA 37.70 ± 0.26bB 35.68 B 24.53 ± 0.29cC 28.38 ± 0.19cB 23.33 ± 0.27cD 21.68 ± 0.26cE 29.98 ± 0.26cA 25.58 BC 21.32 ± 0.79dB 15.26+0.15dE 16.28 ± 0.22dD 18.94 ± 0.09dC 28.20 ± 0.15dA 20.00 C 19.52 ± 0.10dA 9.35+0.12eE 13.54 ± 0.22eC 10.62 ± 0.15eD 15.20 ± 0.08eB 13.65 平均值 Mean 27.26 28.64 23.92 26.88 30.41 注:表中数据为平均值 ± 标准误(n=3),不同小写字母表示同一林分不同土层之间差异显著(p < 0.05),不同大写字母表示同一土层不同林分之间差异显著(p < 0.05)。下同(表4)。
Notes: Values in the table are average ± standard error.Different lowercase letters indicate significant differences in different soil layers under the same forest stands (p < 0.05).Different capital letters iniceated significant differences in the same soil layer under the different forert stands (p < 0.05). the same below(Table 4).5种林分类型土壤有机碳含量有相似的垂直分布趋势:从表层向下逐渐降低。(A+AB)层约占土壤总有机碳含量的57%,B层、BC层和C层分别占土壤总有机碳含量的19%、15%、10%。单因素方差分析(表3)表明:除核桃楸林BC层与C层差异不显著外,各土层土壤有机碳含量差异显著(p < 0.05)。各土层土壤有机碳含量垂直变化幅度蒙古栎林最大,为9.35~50.25 g·kg−1,而核桃楸林有机碳含量变化幅度最小,为19.52~38.42 g·kg−1。
-
各林分土壤有机碳密度为21.4~76.8 t·hm−2(表4)。土壤总有机碳密度大小排序为:山杨林 > 核桃楸林 > 针阔混交林 > 蒙古栎林 > 油松林。山杨林土壤总有机碳密度最高(238.7 t·hm−2),而油松林最低(215.1 t·hm−2)。各林分上部土层(A+AB)土壤有机碳密度占总土壤有机碳密度的35%~40%,其有机碳贡献率较大。
表 4 不同林分类型下各层次土壤有机碳密度
Table 4. Soil organic carbon densities of different soil genetic horizons under different forest stands
层次
Genetichorizon土壤有机碳密度 Soil orangic carbon density (SOCs)/(t·hm-2) 核桃楸林
Juglans mandshurica蒙古栎林
Quercus mongolica山杨林
Populus davidiana针阔混交林
Pine-poplar mixed forest油松林
Pinus tabuliformis平均值
MeanA 30.0 ± 0.26dB 26.1 ± 0.22dBC 37.1 ± 0.10dA 30.4 ± 0.16eB 21.4 ± 0.15cC 29.0 AB 51.5 ± 0.16bBC 62.6 ± 0.26bA 47.4 ± 0.18cC 52.0 ± 0.12bBC 54.0 ± 0.12aB 53.5 B 45.2 ± 0.15cC 73.4 ± 0.21aA 54.4 ± 0.15aB 48.2 ± 0.14cC 45.5 ± 0.19bC 53.3 BC 30.8 ± 0.16dC 27.3 ± 0.14dC 48.5 ± 0.11bcB 57.1 ± 0.19aA 50.9 ± 0.12aB 42.9 C 76.8 ± 0.18aA 32.8 ± 0.13cD 51.3 ± 0.09bB 44.0 ± 0.19dC 43.3 ± 0.11bC 49.6 合计 Total 234.3 222.2 238.7 231.7 215.1 228.4 本文使用单位cm厚度来描述土壤有机碳密度的垂直变化,表5表明:5种林分土壤有机碳密度自表层向下明显降低;土壤A层单位cm厚度均值最高为4.26 t·hm−2,分别为AB层、B层、BC层、C层的1.1、1.6、2.2、3.0倍。
表 5 不同林分类型单位cm厚度土壤有机碳密度
Table 5. The soil organic carbon densitycontents in unit volume under different forest stands
层次Genetichorizon 单位cm厚度土壤有机碳密度 Soil organic carbon densitycontents in unit volume/(t·hm-2) 核桃楸林
Juglans mandshurica蒙古栎林
Quercus mongolica山杨林
Populus davidiana针阔混交林
Pine-poplar mixed forest油松林
Pinus tabuliformis平均值
MeanA 3.75 4.34 3.71 5.22 4.28 4.26 AB 3.68 4.33 3.16 4.17 4.15 3.90 B 2.66 2.41 2.72 2.94 3.03 2.75 BC 1.34 2.60 1.94 1.37 2.55 1.96 C 1.94 1.26 1.71 0.94 1.24 1.42 -
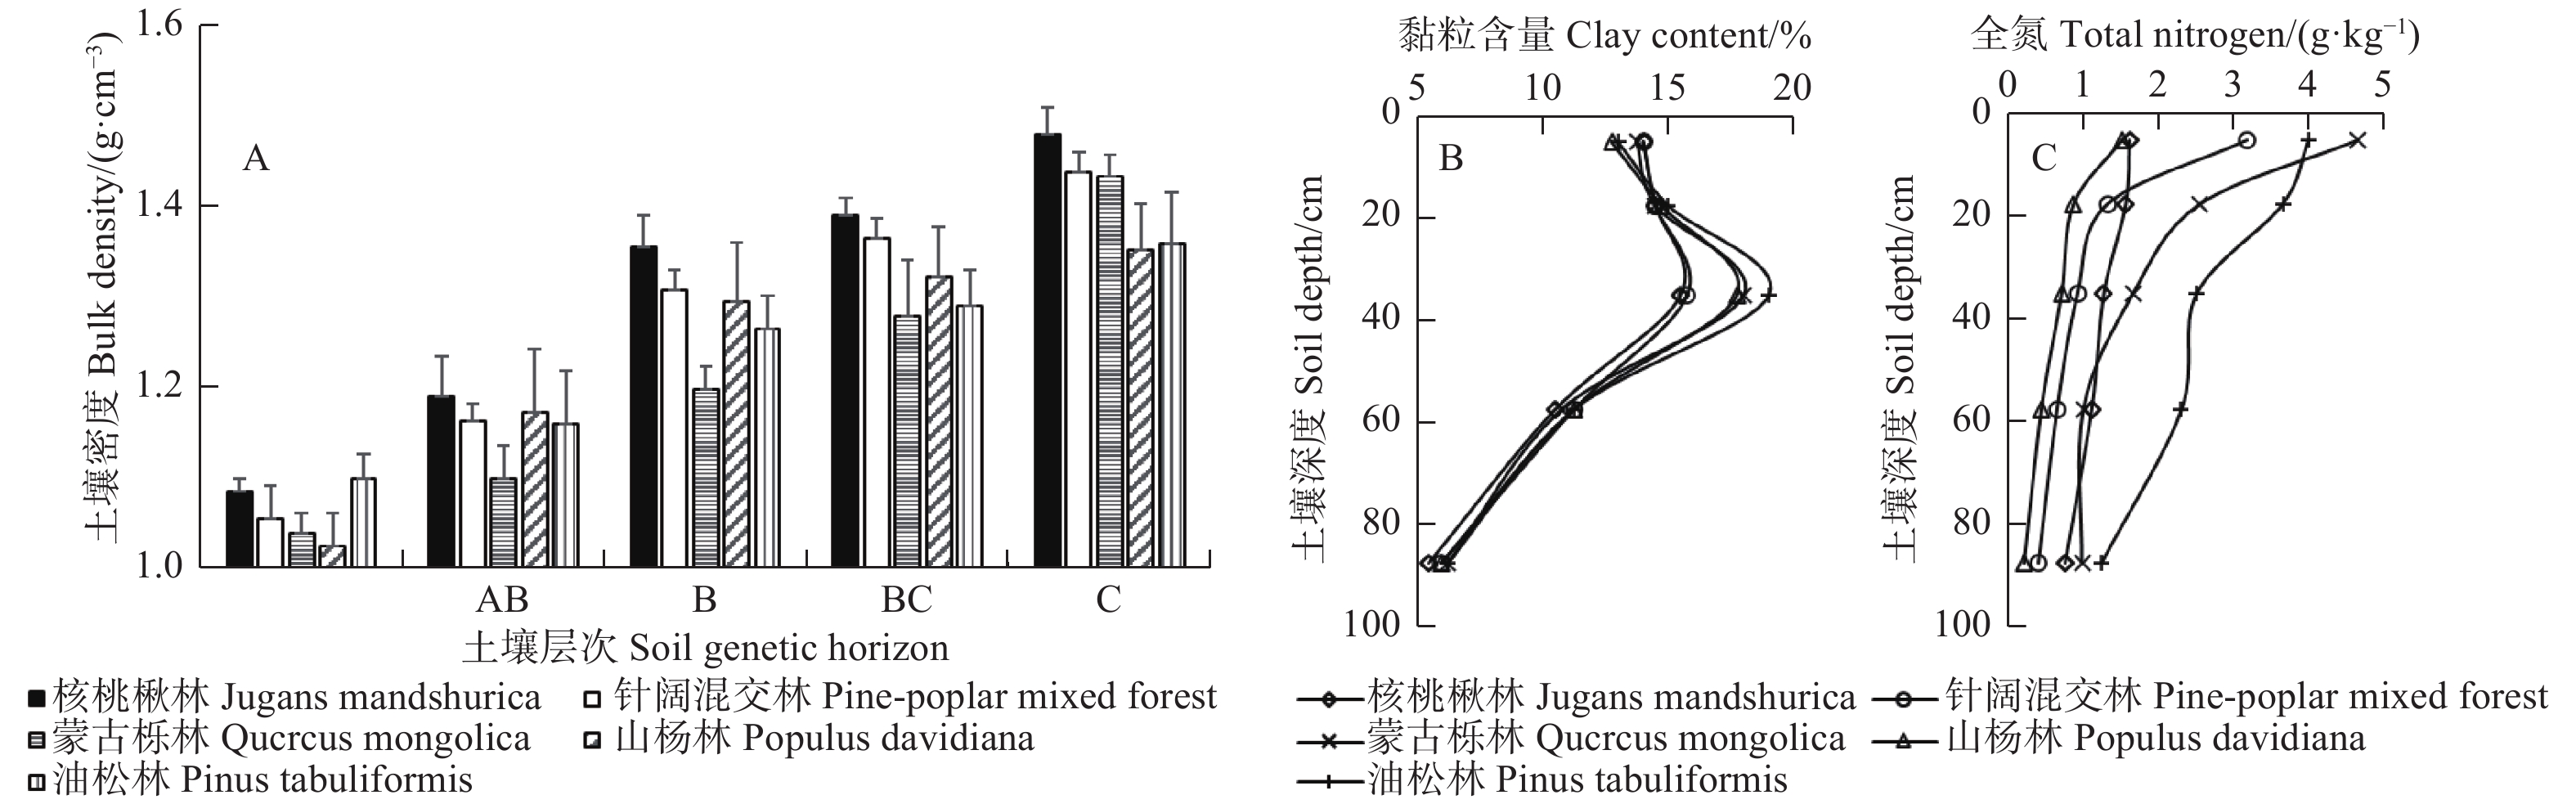
土壤密度均值大小表现为核桃楸林 > 针阔混交林 > 油松林 > 山杨林 > 蒙古栎林,随着土层深度的增加,不同林分类型土壤密度均呈增加的趋势(图2A);5种林分类型土壤黏粒含量随土壤深度加深变化规律较一致,在30~40 cm深度出现明显的黏粒聚集现象(图2B)。各林分土壤全氮含量为0.21~4.65 g·kg−1,大小依次为油松林 > 蒙古栎林 > 针阔混交林 > 核桃楸林 > 山杨林,随土层深度增加,土壤全氮含量均呈逐渐下降趋势,油松林土壤全氮含量明显高于其它林分(图2C)。

图 2 不同林分类型土壤理化性质随土层深度的变化
Figure 2. Changes of soil physical-chemical properties with soil depths under different stand types
以研究区域内不同林分各土层的土壤有机碳含量平均值与土壤密度、全氮、黏粒含量进行相关性分析,结果(表6)表明:不同林分土壤有机碳含量与全氮含量呈极显著正相关,与土壤密度呈极显著负相关,除山杨林土壤有机碳含量与土壤黏粒呈极显著正相关外,其余林分有机碳含量与黏粒不显著相关。
表 6 土壤有机碳(SOC)与土壤密度(BD)、全氮(TN)、黏粒含量(Clay)相关系数(n=75)
Table 6. Correlation coefficient between soil organic carbon (SOC) content and bulk density (BD), total nitrogen(TN), clay content of the soils under different forest stands
相关因子
Correlationfactor相关系数 Correlation coefficient 核桃楸林
Juglans mandshurica蒙古栎林
Quercus mongolica山杨林
Populus davidiana针阔混交林
Pine-poplar mixed forest油松林
Pinus tabuliformisSOC与BD −0.991** −0.971** −0.974** −0.996** −0.986** SOC与TN 0.923** 0.974** 0.985** 0.951** 0.965** SOC与Clay 0.666 0.652 0.933** 0.682 0.629 注:**p < 0.01.
Note:**p < 0.01. -
林分类型对凋落物产量和分解速率均有显著影响,进而造成其土壤有机碳存在差异[26],国外研究认为,植被类型是影响土壤有机碳垂直分布格局的主要因素[27],本研究也证明了林分类型对土壤有机碳含量的垂直分布有显著影响。海坨山地区油松林土壤有机碳含量均值为30.41 g·kg−1,高于其它4种阔叶林,与高杰等[22]在同地区测定的油松林土壤有机碳含量33.17 g·kg−1类似;而王文静等[21]在华北地区对多种林分类型土壤有机碳的研究结果表明,阔叶林有机碳含量高于针叶林,与本研究结果不一致,原因可能是森林土壤有机碳输入主要以地上部分凋落物层为主,本研究区油松林因人为干扰较小,成林时间较长,因此,具有相当厚度的粗腐殖质化枯枝落叶层,增加了微生物活性和数量,进而导致其有机碳含量较高。本研究区山杨林土壤有机碳含量均值最低(23.92 g·kg#8722;1),而赵伟红等[28]在冀北测定的成熟山杨林有机碳含量也较低(16.56 g·kg#8722;1),可能由于山杨林下枯枝落叶层较薄,且因其为速生树种,生长所需吸收养分较多所致。本研究表明,蒙古栎林有机碳含量比核桃楸林及针阔混交林的高,可能是由于栎林叶片成分更易分解,周转较快所致,这与王棣等[25]在秦岭获得的研究结果一致。前人研究还显示,土壤有机碳含量还受地形、坡度等影响[29-31]。多地区土壤有机碳含量数据的积累可为进一步在植被尺度上估算土壤有机碳储量提供依据。
各林分土壤有机碳均随土层深度的增加呈下降趋势,A+AB土层的土壤有机碳含量占总有机碳含量的57%左右,这与相关研究结果一致[32-33]。在森林土壤剖面的层次构造中,一般土壤腐殖质层的有机质含量显著高于淀积层[34],腐殖化作用明显,这主要是因为土壤表层积累了大量的枯枝落叶等植物残体;同时,随着土层深度的增加,植物根系分布减少,有机质来源少[35]。
-
本研究区森林土壤总有机碳密度均值为228.4 t·hm−2,远高于全国森林生态系统土壤有机碳密度均值107.8 t·hm−2。可见,研究区5种林分类型土壤有机碳密度总体较高,这可能与该地区封山育林等措施较好,生态系统维护比较稳定,腐殖质腐化程度高有关。研究证明,森林土壤表层土壤结构合理,枯落物分解较快,碳密度在表层土壤比底层土壤更高[26]。本研究中,山杨林、核桃楸林下土壤有机碳密度较高,因其土壤养分较高,使微生物活性较高,枯落物易于分解转化;蒙古栎林、针阔混交林其次;而油松林土壤有机碳密度最低,虽然油松林有机碳含量较高,但林分类型对土壤有机碳的影响主要在表土,且随土层深度的增加而下降,因其土层较薄以及土壤密度较小等原因,其总碳密度并不高,这与刘国华等[20]研究结果一致。
本研究按发生层划分土层,各层次土壤厚度并不一致,不便对土壤有机碳密度的垂直分布状况进行研究。故本文引入单位cm厚度来描述土壤有机碳密度垂直变化,结果表明,土壤有机碳密度均随土层加深而逐渐降低,各林分土壤有机碳密度具有明显的表聚性。建立土壤有机质(或碳)含量、密度基于土壤发生层厚度和固定分层厚度之间的转换,将使过去按土壤发生层取样测定数据与现今常用的固定分层测定数据之间更好的对比分析,使多年的土壤有机碳数据可以用到研究土壤有机碳的长期变化。
-
土壤有机碳含量变化是由有机质输入量及分解速率决定的,其与土壤水热状况及物理化学等因素息息相关。该研究区域内5种林地均有较完整的土壤发生层次,土体上松下紧,土壤有机碳含量与土壤密度呈极显著负相关,与土壤全氮含量呈极显著正相关,这与Verterdal L等[36]在丹麦的研究结果相同,在高土壤密度条件下,土壤碳的矿化作用和氮的硝化作用受到抑制[37]。有研究认为,土壤有机碳含量会随黏粒含量增加而增多,原因是黏粒含量能增加土壤水分的蓄持能力及对土壤有机碳有一定吸附和保护作用[38]。在本研究中,除山杨林外,其余林分土壤有机碳含量与土壤黏粒无显著相关性,可能由于本研究区各林分土壤黏粒含量较接近,显示不出规律,也可能有其他影响因素起主导作用,有待进一步研究。
-
海坨山5种不同林分平均土壤总碳密度为228.4 t·hm−2,各林分间土壤总有机碳密度大小排序为:山杨林 > 核桃楸林 > 针阔混交林 > 蒙古栎林 > 油松林。研究表明,森林土壤有机碳含量及单位cm厚度土壤有机碳密度均随土层深度增加而降低;林分类型对土壤有机碳垂直分布有显著影响,且其影响程度随土壤深度的增加而下降。土壤有机碳含量与土壤全氮呈极显著正相关,与土壤密度呈极显著负相关,除山杨林外与黏粒含量呈不显著相关。
北京海坨山典型林分土壤有机碳含量及有机碳密度垂直分布特征
Vertical Distribution Characteristics of Soil Organic Carbon Content and Organic Carbon Density of Typical Forest Stands at Haituo Mountain, Beijing
-
摘要:
目的 探讨海坨山不同林分类型下土壤有机碳含量和有机碳密度的垂直分布特征及其与土壤性质相关关系,为华北地区森林土壤碳库准确评价及森林生态服务功能评估提供科学依据。 方法 选择不同5种典型林分(油松林、核桃秋林、蒙古栎林、针阔混交林、山杨林)分别设置3块标准样地,采集0~100 cm不同土层土样,并分析相关土壤理化性质,分析不同土壤理化因子对土壤有机碳含量的影响,研究该林区不同林分土壤碳含量及密度的分配特征。 结果 不同林分类型下土壤各层次有机碳含量为9.35~50.25 g·kg−1,均值为27.42 g·kg−1。林分类型对不同土层土壤有机碳含量影响显著(p < 0.05),不同林分类型土壤有机碳平均含量由小到大排序:山杨林 < 针阔混交林 < 核桃楸林 < 蒙古栎林 < 油松林。不同林分类型土壤有机碳含量垂直变化趋势相同:从表层向下逐渐降低,表聚性明显,表层(A+AB)占土壤总有机碳含量约57%。不同林分类型100 cm深度土壤有机碳密度为21.4~76.6 t·hm−2,均值为45.7 t·hm−2。各林分间土壤总有机碳密度大小为:山杨林 > 核桃楸林 > 针阔混交林 > 蒙古栎林 > 油松林。单位cm厚度土壤有机碳密度的垂直变化规律与土壤有机碳含量相同,从表层向下逐渐降低,表层(A+AB)土壤有机碳密度占土壤总有机碳密度的35%~40%。不同林分土壤有机碳含量与全氮含量呈极显著正相关(r=0.923~0.985),与土壤密度呈极显著负相关(r=−0.971~−0.996)。 结论 林分类型是影响土壤有机碳垂直分配的重要因素之一,且其影响程度随土壤深度的增加而下降;仅山杨林下土壤有机碳含量与土壤黏粒含量呈极显著正相关,其它林分与黏粒含量相关性不显著。 Abstract:Objective To evaluate the forest soil carbon pools and provide references for the assessment of forest ecosystem services function in North China by exploring the vertical distribution of soil organic carbon (SOC) content and density in different typical forest stands in Haituo Mountain, Beijing. Method Three replicates of soil profiles from each plot were selected from five typical forest stands (Chinese pine, walnut tyurin, oak, coniferous-broadleave mixed stand, and aspen). One-Way ANOVA was employed to study the effects of stand types on SOC content and density in different horizons. Correlation analysis was conducted to analyze the relationship between the SOC content and different soil physical-chemical factors. Result The soil organic carbon content was between 9.35-50.25 g·kg−1 (mean=27.42). Stand types had significant effect on SOC content (p < 0.05). The mean SOC content of the stands studied followed the ascending order of aspen, coniferous-broadleave mixed stand, walnut tyurin, oak, Chinese pine. The SOC content in all these stands showed similar vertical distribution tendency, i.e. decreasing from top horizon to bottom, with a higher concentration on the top horizon (A+AB horizon accounted 57%). The SOC density ranged from 21.4 t·hm−2 to 76.6 t·hm−2 within 100 cm in these stands, with the mean of 45.7 t·hm−2. The mean SOC density of these stands followed the following descending order of aspen, walnut tyurin, coniferous-broadleave mixed stand, oak, Chinese pine. The vertical distribution pattern of SOC density in unit volume was similar with that of the SOC content: decreasing from top horizon to bottom, with a higher density on the top horizon(A+AB horizon accounted 35%-40%). The SOC content in these stands had significant positive correlation to total nitrogen content (r = 0.923−0.985), and significant negative correlation to bulk density (−r = 0.971−0.996). With the increase of soil depth, the relative carbon density per centimeter decreased successively. Conclusion Stand type is one of the main factors controlling the vertical distribution of SOC, and its effect tends to decrease with the depth of soil profile. The result of correlation analysis suggests that there is significant positive correlations between aspen and clay content, but there may be no significant correlations between other stands and clay content. -
Key words:
- Haituo Mountain
- / soil organic carbon content
- / soil organic carbon density
- / carbon pool
- / forest stand
-
图 2 不同林分类型土壤理化性质随土层深度的变化
Figure 2. Changes of soil physical-chemical properties with soil depths under different stand types
表 1 样地基本概况
Table 1. General characteristics of five stands
林分类型
Stand types林龄
Stand age/
a海拔
Elevation/
m坡度
Slope/
(°)坡向
Aspect凋落物厚度
Litter depth/
cm密度
Density/
(株·hm−2)郁闭度
Canopy/
%伴生树种
Associated tree species核桃楸林 Juglans mandshurica 68 815 25 东 East 2.5 1 120 85 丁香 Syzygium aromaticum
白蜡 Fraxinus chinensis蒙古栎林 Quercus mongolica 85 856 23 东北 Northeast 3.5 985 80 三裂绣线菊 Spiraea trilobata
平榛 Corylus heterophylla山杨林 Populus davidiana 72 869 21 北 North 1.0 922 80 山杏 Prunus sibirica
白蜡 Fraxinus chinensis针阔混交林 Pine-poplar mixed forest 78 895 27 东南 Southeast 5.0 1 078 85 大花溲疏 Deutzia grandiflora
胡枝子 Lespedeza bicolor
元宝槭 Acer truncatum油松林 Pinus tabuliformis 80 941 18 东 East 7.0 894 80 暴马丁香 Syringa amurensis
毛榛 Corylus mandshurica注:表中每个林分类型数据为3块标准地的平均值。下同。
Note:Data of each stand are mean of three sampling plots.The same below. 下载: 导出CSV
表 2 不同林分土壤层次深度
Table 2. Soil genetic horizon depths of different stand types
层次
Genetichorizon不同林分类型不同土层深度 (Soil genetic horizon depths of different stand types)/cm 核桃楸林
Juglans mandshurica蒙古栎林
Quercus mongolica山杨林
Populus davidiana针阔混交林
Pine-poplar mixed forest油松林
Pinus tabuliformisA 0~8 0~5 0~10 0~7 0~5 AB 8~22 5~20 10~25 7~19 5~18 B 22~39 20~45 25~45 19~39 18~33 BC 39~62 45~65 45~70 39~65 33~53 C 62~100 65~100 70~100 65~100 53~100
下载: 导出CSV
表 3 不同林分类型各土层土壤有机碳含量
Table 3. The SOC contents of different soil genetic horizons under different forest stands
层次
Genetichorizon土壤有机碳含量
Soil orangic carbon content (SOC)/(g·kg−1)核桃楸林
Juglans mandshurica蒙古栎林
Quercus mongolica山杨林
Populus davidiana针阔混交林
Pine-poplar mixed forest油松林
Pinus tabuliformis平均值
MeanA 38.42 ± 0.23aD 50.25 ± 0.33aA 38.08 ± 0.19aD 43.32 ± 0.25aB 40.95 ± 0.36aC 42.20 AB 32.52 ± 0.13bC 39.95 ± 0.17bA 28.37 ± 0.22bD 39.84 ± 0.20bA 37.70 ± 0.26bB 35.68 B 24.53 ± 0.29cC 28.38 ± 0.19cB 23.33 ± 0.27cD 21.68 ± 0.26cE 29.98 ± 0.26cA 25.58 BC 21.32 ± 0.79dB 15.26+0.15dE 16.28 ± 0.22dD 18.94 ± 0.09dC 28.20 ± 0.15dA 20.00 C 19.52 ± 0.10dA 9.35+0.12eE 13.54 ± 0.22eC 10.62 ± 0.15eD 15.20 ± 0.08eB 13.65 平均值 Mean 27.26 28.64 23.92 26.88 30.41 注:表中数据为平均值 ± 标准误(n=3),不同小写字母表示同一林分不同土层之间差异显著(p < 0.05),不同大写字母表示同一土层不同林分之间差异显著(p < 0.05)。下同(表4)。
Notes: Values in the table are average ± standard error.Different lowercase letters indicate significant differences in different soil layers under the same forest stands (p < 0.05).Different capital letters iniceated significant differences in the same soil layer under the different forert stands (p < 0.05). the same below(Table 4).
下载: 导出CSV
表 4 不同林分类型下各层次土壤有机碳密度
Table 4. Soil organic carbon densities of different soil genetic horizons under different forest stands
层次
Genetichorizon土壤有机碳密度 Soil orangic carbon density (SOCs)/(t·hm-2) 核桃楸林
Juglans mandshurica蒙古栎林
Quercus mongolica山杨林
Populus davidiana针阔混交林
Pine-poplar mixed forest油松林
Pinus tabuliformis平均值
MeanA 30.0 ± 0.26dB 26.1 ± 0.22dBC 37.1 ± 0.10dA 30.4 ± 0.16eB 21.4 ± 0.15cC 29.0 AB 51.5 ± 0.16bBC 62.6 ± 0.26bA 47.4 ± 0.18cC 52.0 ± 0.12bBC 54.0 ± 0.12aB 53.5 B 45.2 ± 0.15cC 73.4 ± 0.21aA 54.4 ± 0.15aB 48.2 ± 0.14cC 45.5 ± 0.19bC 53.3 BC 30.8 ± 0.16dC 27.3 ± 0.14dC 48.5 ± 0.11bcB 57.1 ± 0.19aA 50.9 ± 0.12aB 42.9 C 76.8 ± 0.18aA 32.8 ± 0.13cD 51.3 ± 0.09bB 44.0 ± 0.19dC 43.3 ± 0.11bC 49.6 合计 Total 234.3 222.2 238.7 231.7 215.1 228.4
下载: 导出CSV
表 5 不同林分类型单位cm厚度土壤有机碳密度
Table 5. The soil organic carbon densitycontents in unit volume under different forest stands
层次Genetichorizon 单位cm厚度土壤有机碳密度 Soil organic carbon densitycontents in unit volume/(t·hm-2) 核桃楸林
Juglans mandshurica蒙古栎林
Quercus mongolica山杨林
Populus davidiana针阔混交林
Pine-poplar mixed forest油松林
Pinus tabuliformis平均值
MeanA 3.75 4.34 3.71 5.22 4.28 4.26 AB 3.68 4.33 3.16 4.17 4.15 3.90 B 2.66 2.41 2.72 2.94 3.03 2.75 BC 1.34 2.60 1.94 1.37 2.55 1.96 C 1.94 1.26 1.71 0.94 1.24 1.42
下载: 导出CSV
表 6 土壤有机碳(SOC)与土壤密度(BD)、全氮(TN)、黏粒含量(Clay)相关系数(n=75)
Table 6. Correlation coefficient between soil organic carbon (SOC) content and bulk density (BD), total nitrogen(TN), clay content of the soils under different forest stands
相关因子
Correlationfactor相关系数 Correlation coefficient 核桃楸林
Juglans mandshurica蒙古栎林
Quercus mongolica山杨林
Populus davidiana针阔混交林
Pine-poplar mixed forest油松林
Pinus tabuliformisSOC与BD −0.991** −0.971** −0.974** −0.996** −0.986** SOC与TN 0.923** 0.974** 0.985** 0.951** 0.965** SOC与Clay 0.666 0.652 0.933** 0.682 0.629 注:**p < 0.01.
Note:**p < 0.01.
下载: 导出CSV
-
[1] Lal R. Forst soils and carbon sequestration[J]. Forest Ecology and Management, 2005, 220(1-3): 242-258. doi: 10.1016/j.foreco.2005.08.015 [2] 李帅锋, 苏建荣, 刘万德, 等. 思茅松人工林土壤有机碳和氮储量变化[J]. 林业科学研究, 2015, 28(6):810-817. [3] 黄从德, 张 健, 杨万勤, 等. 四川森林土壤有机碳储量的空间分布特征[J]. 生态学报, 2009, 29(3):1217-1225. [4] Raich J W, Schlesinger W H. The global carbon dioxide flux insoil respiration and its relationship to vegetation climate[J]. Tellus B, 1992, 53(1): 11-19. [5] Gray J M, Bishop T F A, Wilson B R. Factors Controlling Soil Organic Carbon Stocks with Depth in Eastern Australia[J]. Soil Science Society of America Journal, 2015, 79(6): 1741-1751. doi: 10.2136/sssaj2015.06.0224 [6] 申贵仓, 张旭东, 张 雷, 等. 蜀南苦竹林生态系统碳储量与碳汇能力估测[J]. 林业科学, 2013, 49(3):78-84. [7] Kaie K, Jane F, Endla A, et al. Variation in annual carbon fluxes affecting the SOC pool in hemiboreal coniferous forests in Estonia[J]. Forest Ecology and Management, 2019, 433: 419-430. doi: 10.1016/j.foreco.2018.11.026 [8] 吕超群, 孙书存. 陆地生态系统碳密度格局研究概述[J]. 植物生态学报, 2004, 28(5):692-703. [9] M von Lützow, I. Kögelkgnabner, Ekschmitt K, et al. Stabilization of Organic Matter in Temperate Soils: Mechanisms and Their Relevance under Different Soil Conditions-a Review[J]. European Journal of Soil Science, 2006, 57(4): 426-445. doi: 10.1111/j.1365-2389.2006.00809.x [10] 王效科, 白艳莹, 欧阳志云, 等. 全球碳循环中失汇及其形成原因[J]. 生态学报, 2002, 22(1):94-103. [11] 刘世荣, 王 晖, 栾军伟. 中国森林土壤碳储量与土壤碳过程研究进展[J]. 生态学报, 2011, 31(19):5437-5448. [12] 李 慧, 王百田, 刘 涛. 晋西黄土区不同森林树种及其林地土壤养分含量的变化[J]. 林业科学研究, 2016, 29(4):587-595. [13] Cong W F, Ruijven J V, Mommer L, et al. Plant species richness promotes soil carbon and nitrogen stocks in grasslands without legumes[J]. Journal of Ecology, 2014, 102(5): 1163-1170. doi: 10.1111/1365-2745.12280 [14] Manning P, De Vries F T, Tallowin J R B, et al. Simple measures of climate, soil properties and plant traits predict national-scale grassland soil carbon stocks[J]. Journal of Applied Ecology, 2015, 52(5): 1188-1196. doi: 10.1111/1365-2664.12478 [15] Martin W, Livia U, Eleanor H, et al. Soil organic carbon storage as a key function of soils-A review of drivers and indicators at various scales[J]. Geoderma, 2019, 333: 149-162. doi: 10.1016/j.geoderma.2018.07.026 [16] 方精云, 刘国华, 朱 彪, 等. 北京东灵山三种温带森林生态系统的碳循环[J]. 中国科学.D辑:地球科学, 2006, 36(6):533-543. [17] 耿玉清, 余新晓, 岳永杰, 等. 北京山地针叶林与阔叶林土壤活性有机碳库的研究[J]. 北京林业大学学报, 2009, 31(5):19-24. [18] 朱丽平, 蔡永茂, 康满春, 等. 华北土石山区油松和元宝枫人工林土壤有机碳特征[J]. 中国水土保持科学, 2016, 14(1):97-105. [19] 李 娜, 李 建, 刘海丰, 等. 东灵山3种落叶阔叶林的碳氮元素含量及比率[J]. 林业科学, 2009, 45(8):82-87. [20] 刘国华, 傅伯杰, 方精云. 中国森林碳动态及其对全球碳平衡的贡献[J]. 生态学报, 2000, 20(5):733-740. [21] 王文静, 王百田, 吕 钊, 等. 山西太岳山不同林分土壤有机碳储量研究[J]. 干旱区资源与环境, 2013, 27(1):81-85. [22] 高 杰, 郭子健, 刘艳红. 北京松山天然油松林土壤有机碳分布及其影响因素[J]. 生态学杂志, 2016, 35(10):2707-2713. [23] 苟丽晖, 孙兆地, 聂立水, 等. 北京松山自然保护区不同母质油松林土壤氮、磷、钾含量垂直分布[J]. 应用生态学报, 2013, 24(4):961-966. [24] 朱嘉磊, 田 菊, 孙 宾, 等. 北京市松山天然油松林生态系统的碳储量[J]. 水土保持通报, 2016, 36(5):320-325. [25] 王 棣, 耿增超, 佘 雕, 等. 秦岭典型林分土壤有机碳储量及碳氮垂直分布[J]. 生态学报, 2015, 35(16):5421-5429. [26] Lange M, Eisenhauer N, Sierra C A, et al. Plant diversity increases soil microbial activity and soil carbon storage[J]. Nature Communications, 2015, 6(1): 1-8. [27] Esteban G, Jobbágy, Robert B J. the Vertical Distribution of Soil Organic Carbon and its Relation to Climate and Vegetation[J]. Ecological Applications, 2000, 10(2): 423-436. doi: 10.1890/1051-0761(2000)010[0423:TVDOSO]2.0.CO;2 [28] 赵伟红, 康峰峰, 韩海荣, 等. 冀北辽河源地区不同林龄山杨天然次生林土壤理化特征的研究[J]. 中南林业科技大学学报, 2016, 36(1):52-57. [29] 马和平, 郭其强, 刘合满, 等. 西藏色季拉山西坡不同海拔梯度表层土壤碳氮变化特性的研究[J]. 林业科学研究, 2013, 26(2):240-246. [30] Johnson A H, Xing H X, Scatena F N. Controls on Soil Carbon Stocks in El Yunque National Forest, Puerto Rico[J]. Soil Science Society of America Journal, 2015, 79(1): 294-304. doi: 10.2136/sssaj2014.05.0199 [31] 贾呈鑫卓, 李帅锋, 苏建荣. 地形因子对思茅松人工林土壤有机碳储量的影响[J]. 林业科学研究, 2016, 29(3):424-429. [32] 丁咸庆, 马慧静, 朱晓龙, 等. 大围山不同海拔森林土壤有机碳垂直分布特征[J]. 水土保持学报, 2015, 29(2):258-262. [33] 杨秀清, 韩有志. 关帝山森林土壤有机碳和氮素的空间变异特征[J]. 林业科学研究, 2011, 24(2):223-229. [34] 宋 媛, 赵溪竹, 毛子军, 等. 小兴安岭4种典型阔叶红松林土壤有机碳分解特性[J]. 生态学报, 2013, 33(2):443-453. [35] Rees R M, Bingham I J, Baddeley J A, et al. The role of plants and land management in sequestering soil carbon in temperate arable and grassland ecosystems[J]. Geoderma, 2005, 128(1-2): 130-154. doi: 10.1016/j.geoderma.2004.12.020 [36] Vesterdal L, Schmidt I K, Callesen I, et al. Carbon and nitrogen in forest floor and mineral soil under six common European tree species[J]. Forest Ecology & Management, 2008, 255(1): 34-48. [37] De Neve S, Hofman G. Influence of soil compaction on carbon and nitrogen mineralization of soil organic matter and crop residues[J]. Biology and Fertility of Soils, 2000, 30(5): 544-549. [38] 宋娅丽, 康峰峰, 韩海荣, 等. 自然因子对中国森林土壤碳储量的影响分析[J]. 世界林业研究, 2015, 28(3):6-12. -

 点击查看大图

计量
- 文章访问数: 5127
- HTML全文浏览量: 2918
- PDF下载量: 58
- 被引次数: 0

