


-
杉木(Cunninghamia lanceolata (Lamb.) Hook.)是我国重要的速生用材树种,长期以来国内外针对杉木开展了大量的研究,初步形成了杉木人工栽培的技术体系,显著地提高了杉木人工林产量。但随着我国木材需求的加大,特别是大径级无节良材的供应无法保证我国木材产业的需求。虽然杉木育种水平提高,高世代良种大量应用,但传统的栽培技术已不能适应这些良种培育大径无节良材的要求[1]。研究表明,杉木人工林培育中不同造林密度对林分的生产力和木材品质具有显著的影响[2-3]。因此,研究和确定适宜的造林密度是有效提升杉木人工林生产力和木材品质关键培育措施,对培育大径无节良材具有重要意义。
杉木大径级无节良材的培育中,通过合理的造林密度和营林措施进行抚育,营建良好的林分结构和有效冠层,可促进林木生长速率和改善树木干形,最终提高杉木人工林产量和质量。研究表明,光合作用为植物生长发育提供物质和能量,树冠中的活枝净光合产物是主干生长的主要来源,但并非所有活枝都有助于主干的生长,部分位于主干下部的活枝其合成的光合产物只能满足自身的生长和呼吸,并没有额外的光合产物提供给主干生长[4]。如当枝叶净光合速率出现负值说明此时光照强度较弱,植株的呼吸速率大于光合速率,该层的枝叶会消耗植株生长所需的能量,应疏除该层枝叶[5]。冠层和枝条部位作为林分中关键的结构性因子,对于林木光合特性具有重要的影响。目前,国内外已有油橄榄(Olea europaea L.)[6]、欧美杨(Populus × canadensis Moench)[7]、香椿(Cedrela sinensis (A. Juss.) Roem.)[8]、格木(Erythrophleum fordii Oliv.)[9]、栲树(Castanopsis fargesii Franch.)[10]等多个树种开展不同冠层的光合能力研究,均发现树冠上层的净光合速率(Pn)、气孔导度(Gs)、蒸腾速率(Tr)和水分利用效率(WUE)高于树冠下层。因此,在林业集约经营中密度调控和一定程度的修枝是人工林培育中的重要措施。开展不同冠层和枝条部位的林木叶片光合特性的差异研究,可深入了解冠层结构和光照分布对林木光合能力的影响,并有助于优化林分的管理策略。
但是,杉木幼林在不同造林密度和不同冠层下的光合特性差异研究鲜有报道,特别是对杉木幼林的有效冠的高度未进行科学判定。故开展不同密度和修枝强度对杉木人工林冠层特征的影响研究,探讨有利于改善林分冠层特征的最佳经营技术组合,合理制定杉木人工林的培育措施具有重要的现实意义[11]。鉴于此,本研究在野外大田试验条件下,在5个不同造林密度的杉木幼龄林中通过搭建6 m高的光合指标测定固定塔,通过测定不同冠层、不同方向和不同枝条部位叶片的光合特性指标,比较和分析不同造林密度和冠层下杉木幼林叶片光合特性的差异,对5年生未修枝的杉木幼林的有效冠的高度进行科学判定,明确不同造林密度下杉木幼林合理的修枝高度,从而为杉木人工林的高效和优质培育提供科学依据。
-
试验地位于福建省南平市埔上林场(117°47′5″ E、26°56′8″ N)。属亚热带海洋性季风气候;海拔200~400 m,坡度20°~30°,年平均气温18.5 ℃,年平均降雨量1 880 mm,年平均日照时数1 699 h,无霜期260 d以上,土壤以红壤为主,土层深厚,理化性能良好。
-
选择5年生杉木幼林及5种造林密度,每个密度设置3个20 m × 20 m的重复样地,即每个密度造林面积为1 200 m2。于2022年6月和8月在每个样地中心位置选择3株长势良好且均一的标准木,在3株标准木之间搭建测定不同冠层光合特性的固定梯架,共计5个高度为6 m的固定检测塔。
-
如表1所示,于每个造林密度样地选择3株标准木,测定样树树高和胸径。以1 m为一层,用喷漆进行画圈分层,分为5个不同冠层(距离树体基部1、2、3、4、5 m处)、枝条不同朝向(东西和南北)、枝条叶片不同部位(尖端和末梢)。在实际测定中发现距树体基部1 m处树冠的枝条已腐烂、枯死无法测量叶片的光合值,故不同冠层从距离树体基部2 m处开始测定和研究。
表 1 不同造林密度下杉木幼龄林生长和土壤养分基本数据表
Table 1. Basic data table of growth and soil nutrients of C.lanceolata under different planting densities
造林密度
Afforestation density/
(株·hm−2)样树信息
Sample tree information土壤养分数据
Soil nutrient data胸径 DBH /cm 树高 H /m 全氮含量
Total nitrogen content/
(g·kg−1)全磷含量
Total phosphorus content/
(g·kg−1)全钾含量
Total potassium content/
(g·kg−1)有机质含量
Organic matter content/
(g·kg−1)样树一
Sample tree 1样树二
Sample tree 2样树三
Sample tree 3样树一
Sample tree 1样树二
Sample tree 2样树三
Sample tree 3M1 833 11.1 12.2 12.25 8.15 8.09 8.27 1.03AB 0.29A 9.33AB 37.5AB M2 1667 12.9 12.5 12.55 8.23 7.83 8.03 1.04AB 0.30A 9.56AB 38.2A M3 2500 9.2 12.2 10.85 7.83 8.36 8.02 1.00B 0.34A 9.21B 35.5B M4 3333 9.5 9.1 9.15 7.52 7.24 7.50 1.07A 0.32A 9.66A 37.4AB M5 6667 9.8 7.2 8.65 7.96 7.25 7.38 1.06AB 0.32A 9.59AB 37.9A 注:相同大写字母表示土壤养分在不同造林密度之间差异不显著(p > 0.05)
Note:Different uppercase letters indicate significant differences in soil nutrients between different afforestation density于2022年8月20—25日上午9:00—12:00的晴朗无云天,温度为31.3~40.1 °C、相对湿度为29.65%~63.46%、VPD为1.31~5.58 k·Pa的环境,采用LI-6400XT便携式光合仪对5个密度林的样树进行光合特征指标测定,包括净光合速率(Pn)、蒸腾速率(Tr)和气孔导度(Gs),并计算水分利用效率(WUE)。测定时将光量子通量密度统一设置为1 000 µmol·m−2·s−1,叶室温度设置在30 °C,CO2浓度设置在400 µmol·m−2·s−1,湿度控制在50%~75%[12]。同时用纸板画出与光合仪叶室大小的方框(10 cm × 10 cm),将纸板置于测定的部位底部进行拍照,每个测定部位采集8~10片叶子,将采集的叶片带回实验室进行扫描、分析、计算叶面积和换算实际的光合特征值。
-
数据通过Microsoft Excel 2022进行整理,通过SPSS24.0软件进行数据分析,采用单因素ANOVA检验分别对不同造林密度、不同冠层、不同方向、枝条不同方位4个因子在不同处理间的差异进行分析,采用多重比较4个因子间的差异,以P<0.05作为显著性判断标准,利用Origin2022绘图。
-
由图1可知,杉木东西、南北向尖端叶片和末梢叶片的净光合速率Pn值在5种造林密度下均表现为距离树体基部5 m处 > 4 m处> 3 m处 >2 m处。在5种造林密度下,冠层5 m处的Pn值大多显著高出冠层4、3、2 m处(P < 0.05)(图1a~d)。其中,在M5密度下冠层2和3 m处的Pn值出现负值(图1a~d),在M4密度下冠层2 m处的Pn值出现负值(图1b、d)。
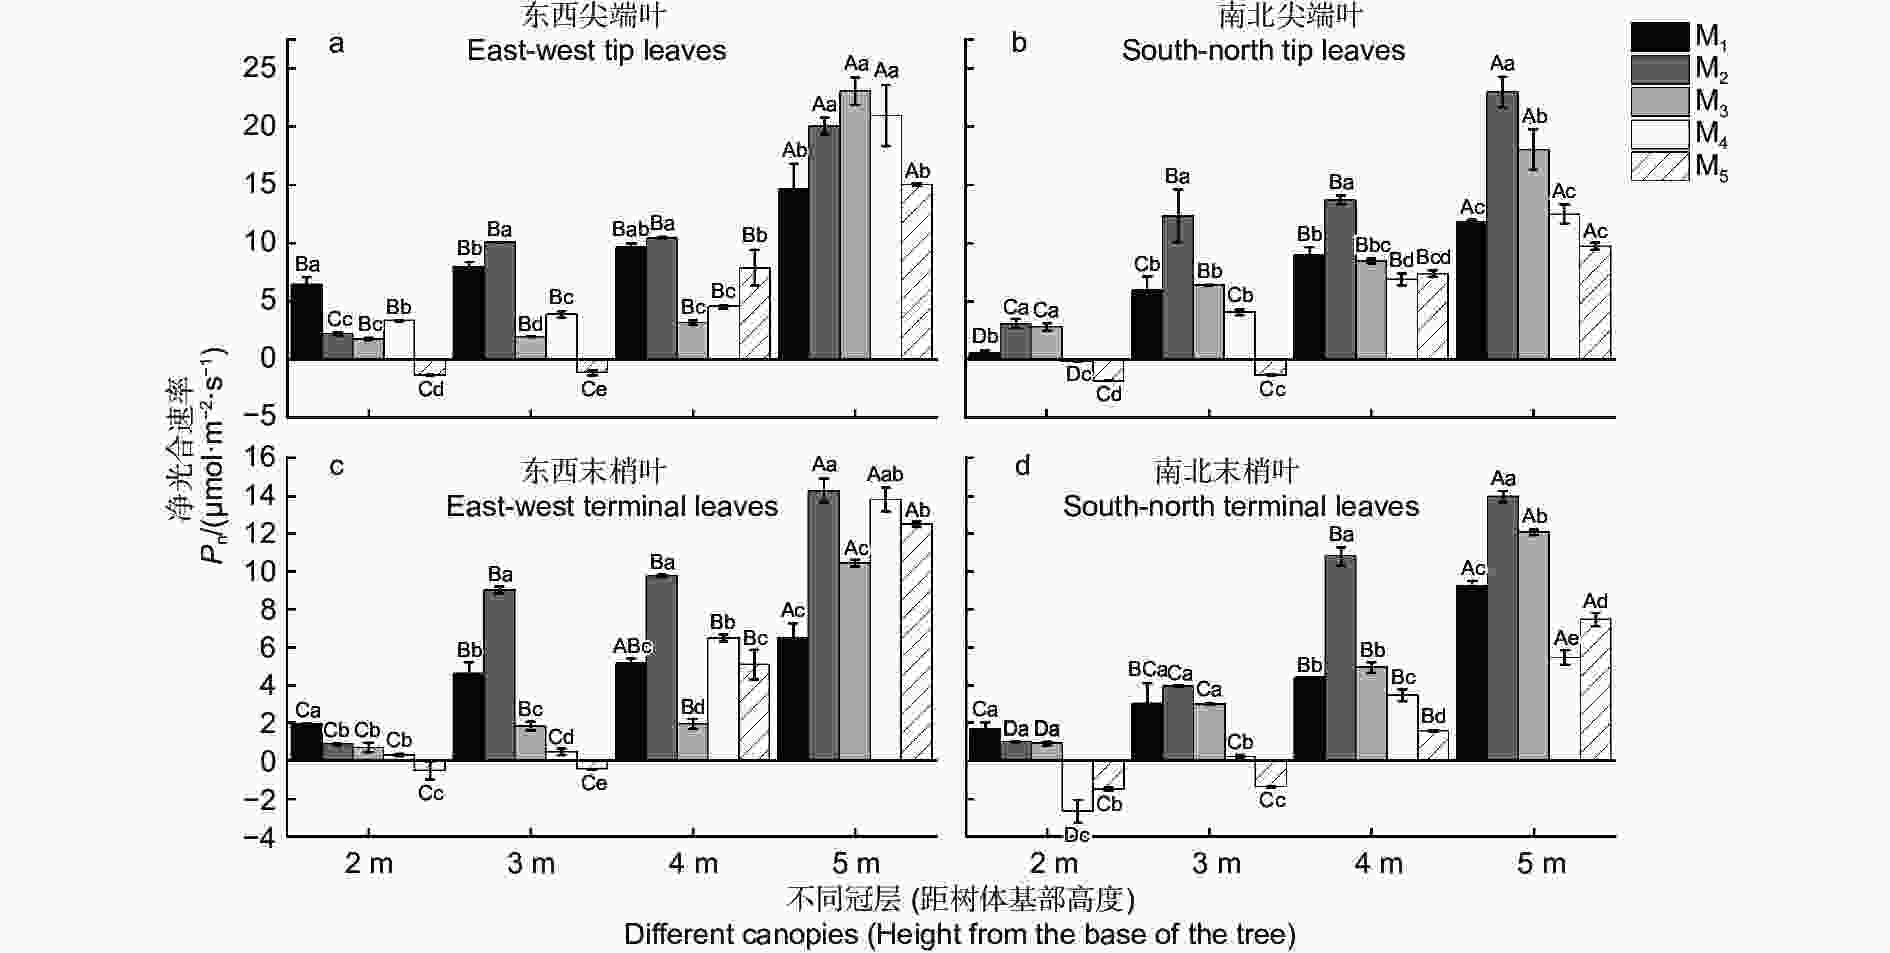
图 1 不同造林密度冠层下杉木叶片的净光合速率差异分析
Figure 1. Analysis on the difference of net photosynthetic rate of C.lanceolata leaves under different afforestation densities and canopy
在不同冠层中,冠层2 m处的东西向尖端叶、东西和南北向末梢叶的Pn均在M1密度下最大(图1a、c、d),而南北向尖端叶Pn是M2密度最大(图1b)。冠层3、4 m处,杉木东西、南北向尖端叶和末梢叶的Pn均在M2密度最大(图1a~d)。冠层5 m处,东西向尖端叶的Pn在M3密度下最大(图1a),而南北向尖端叶、东西和南北向末梢叶的Pn均在M2密度下最大(图1b~d)(P < 0.05)。
-
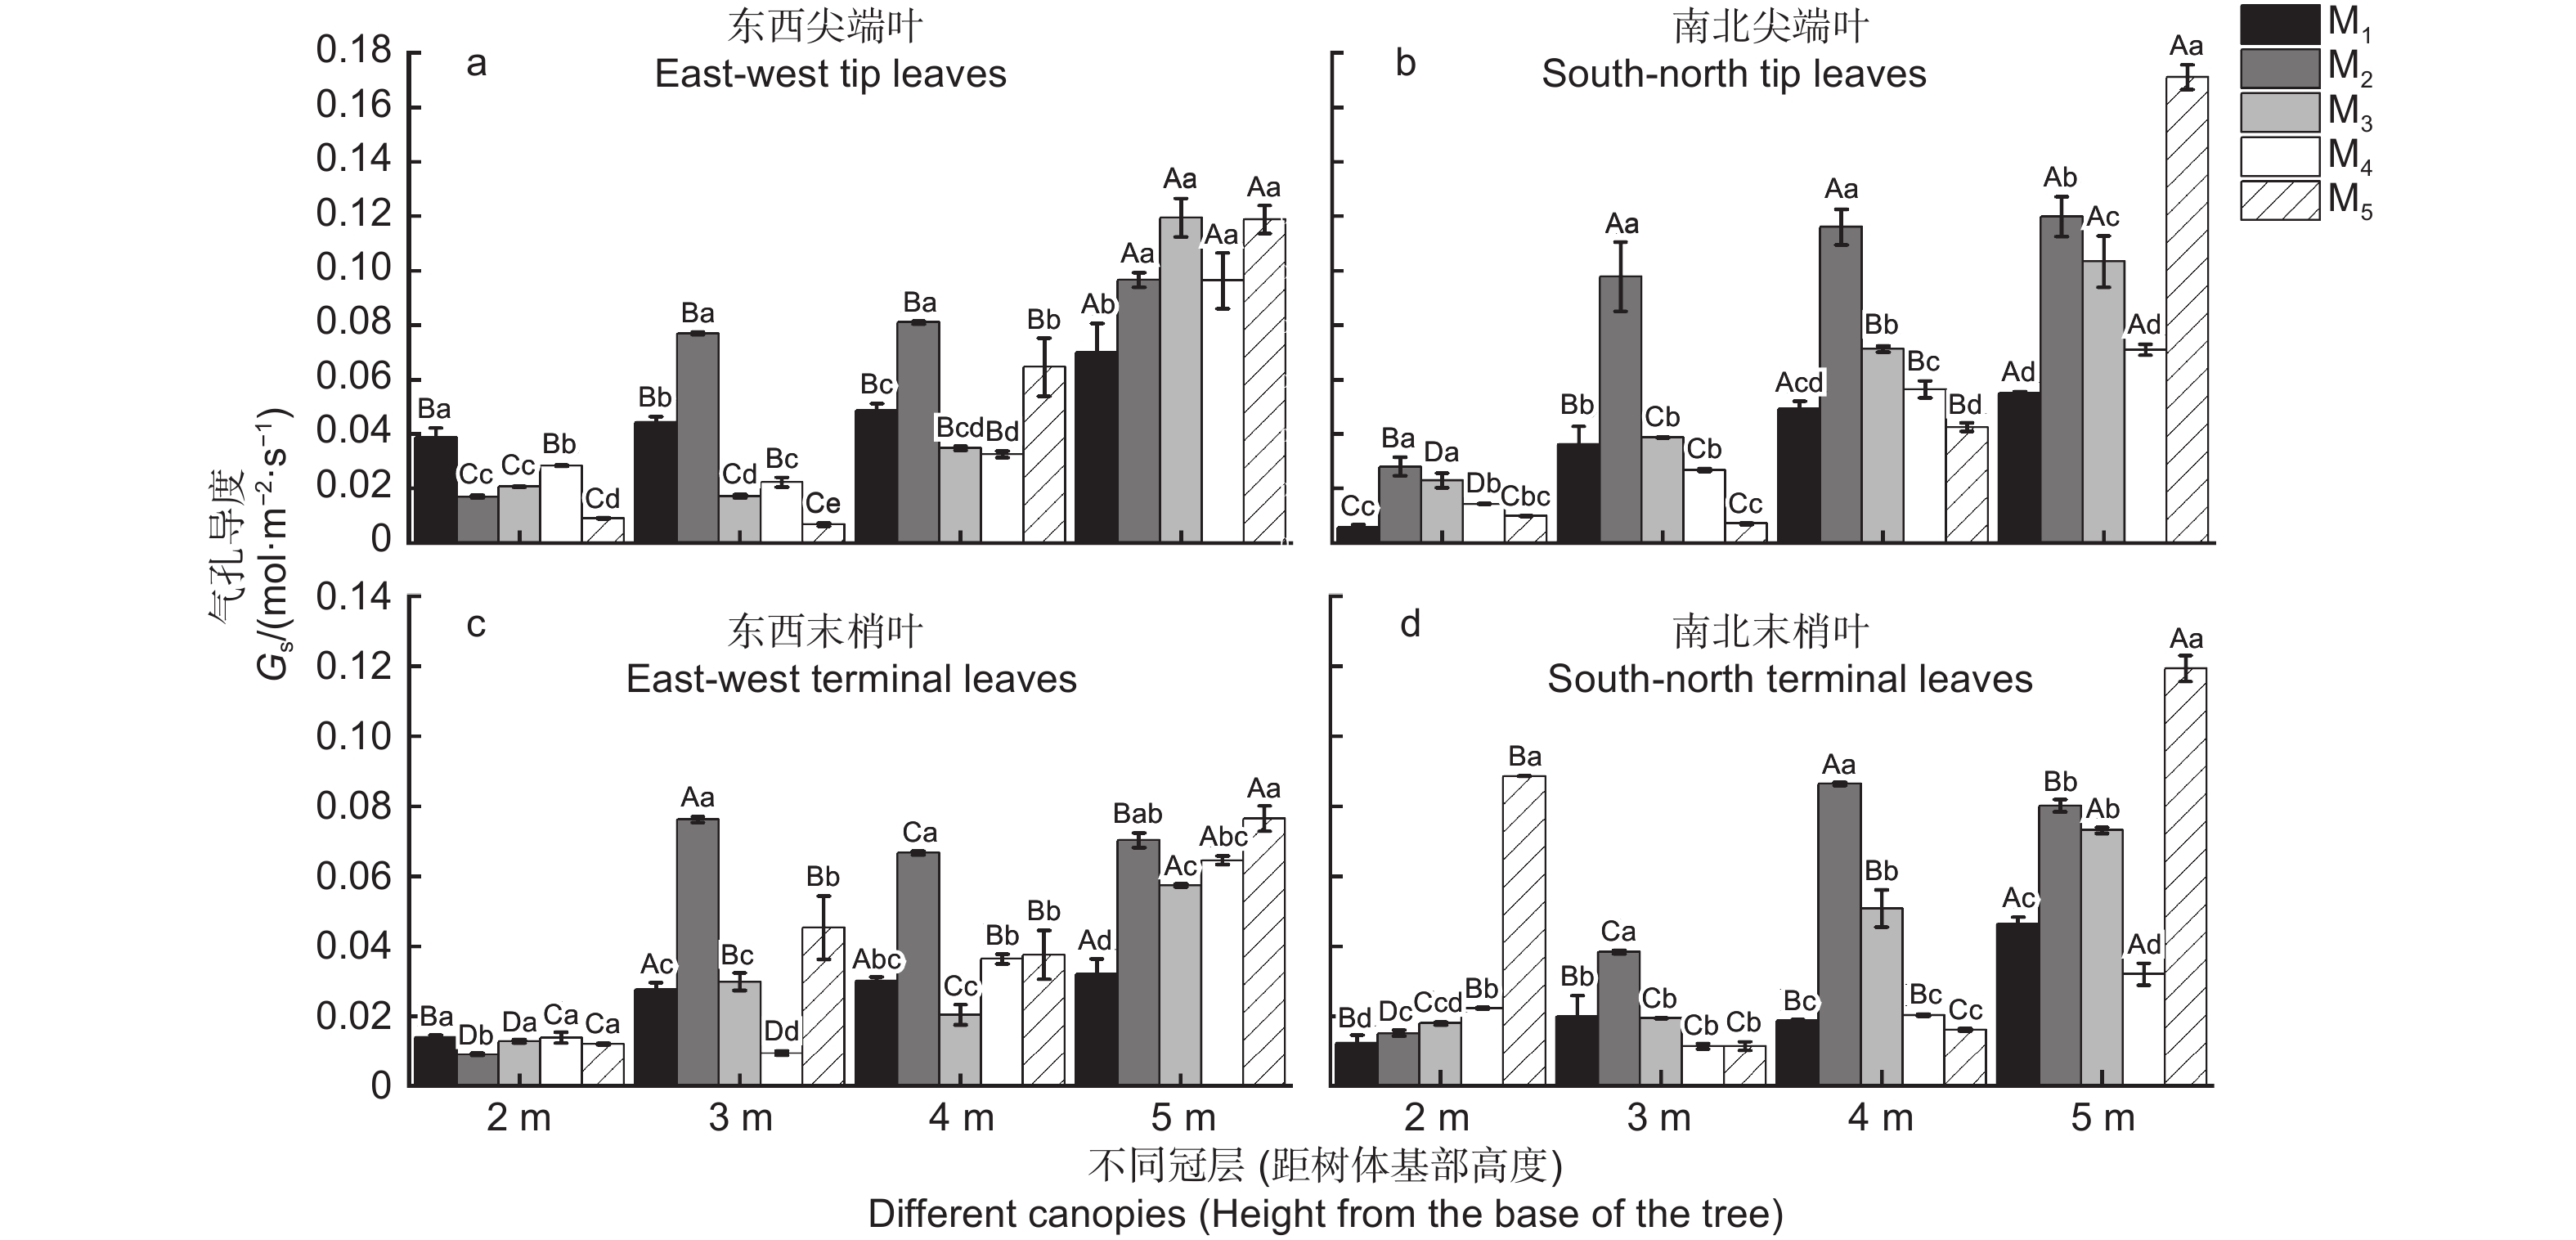
由图2可知,杉木东西、南北向尖端叶和末梢叶的气孔导度Gs值在5种造林密度下整体均表现为距树体基部下层向上层递增的趋势。在5种造林密度下,东西和南北向尖端叶在冠层5 m处的Gs值最大(图2a~b)。但东西和南北向末梢叶的Gs值在M1、M3、M4、M5密度下均是冠层5 m处最大,在M2密度下分别为冠层3 m处以及4 m处为最大(图2c~d)。
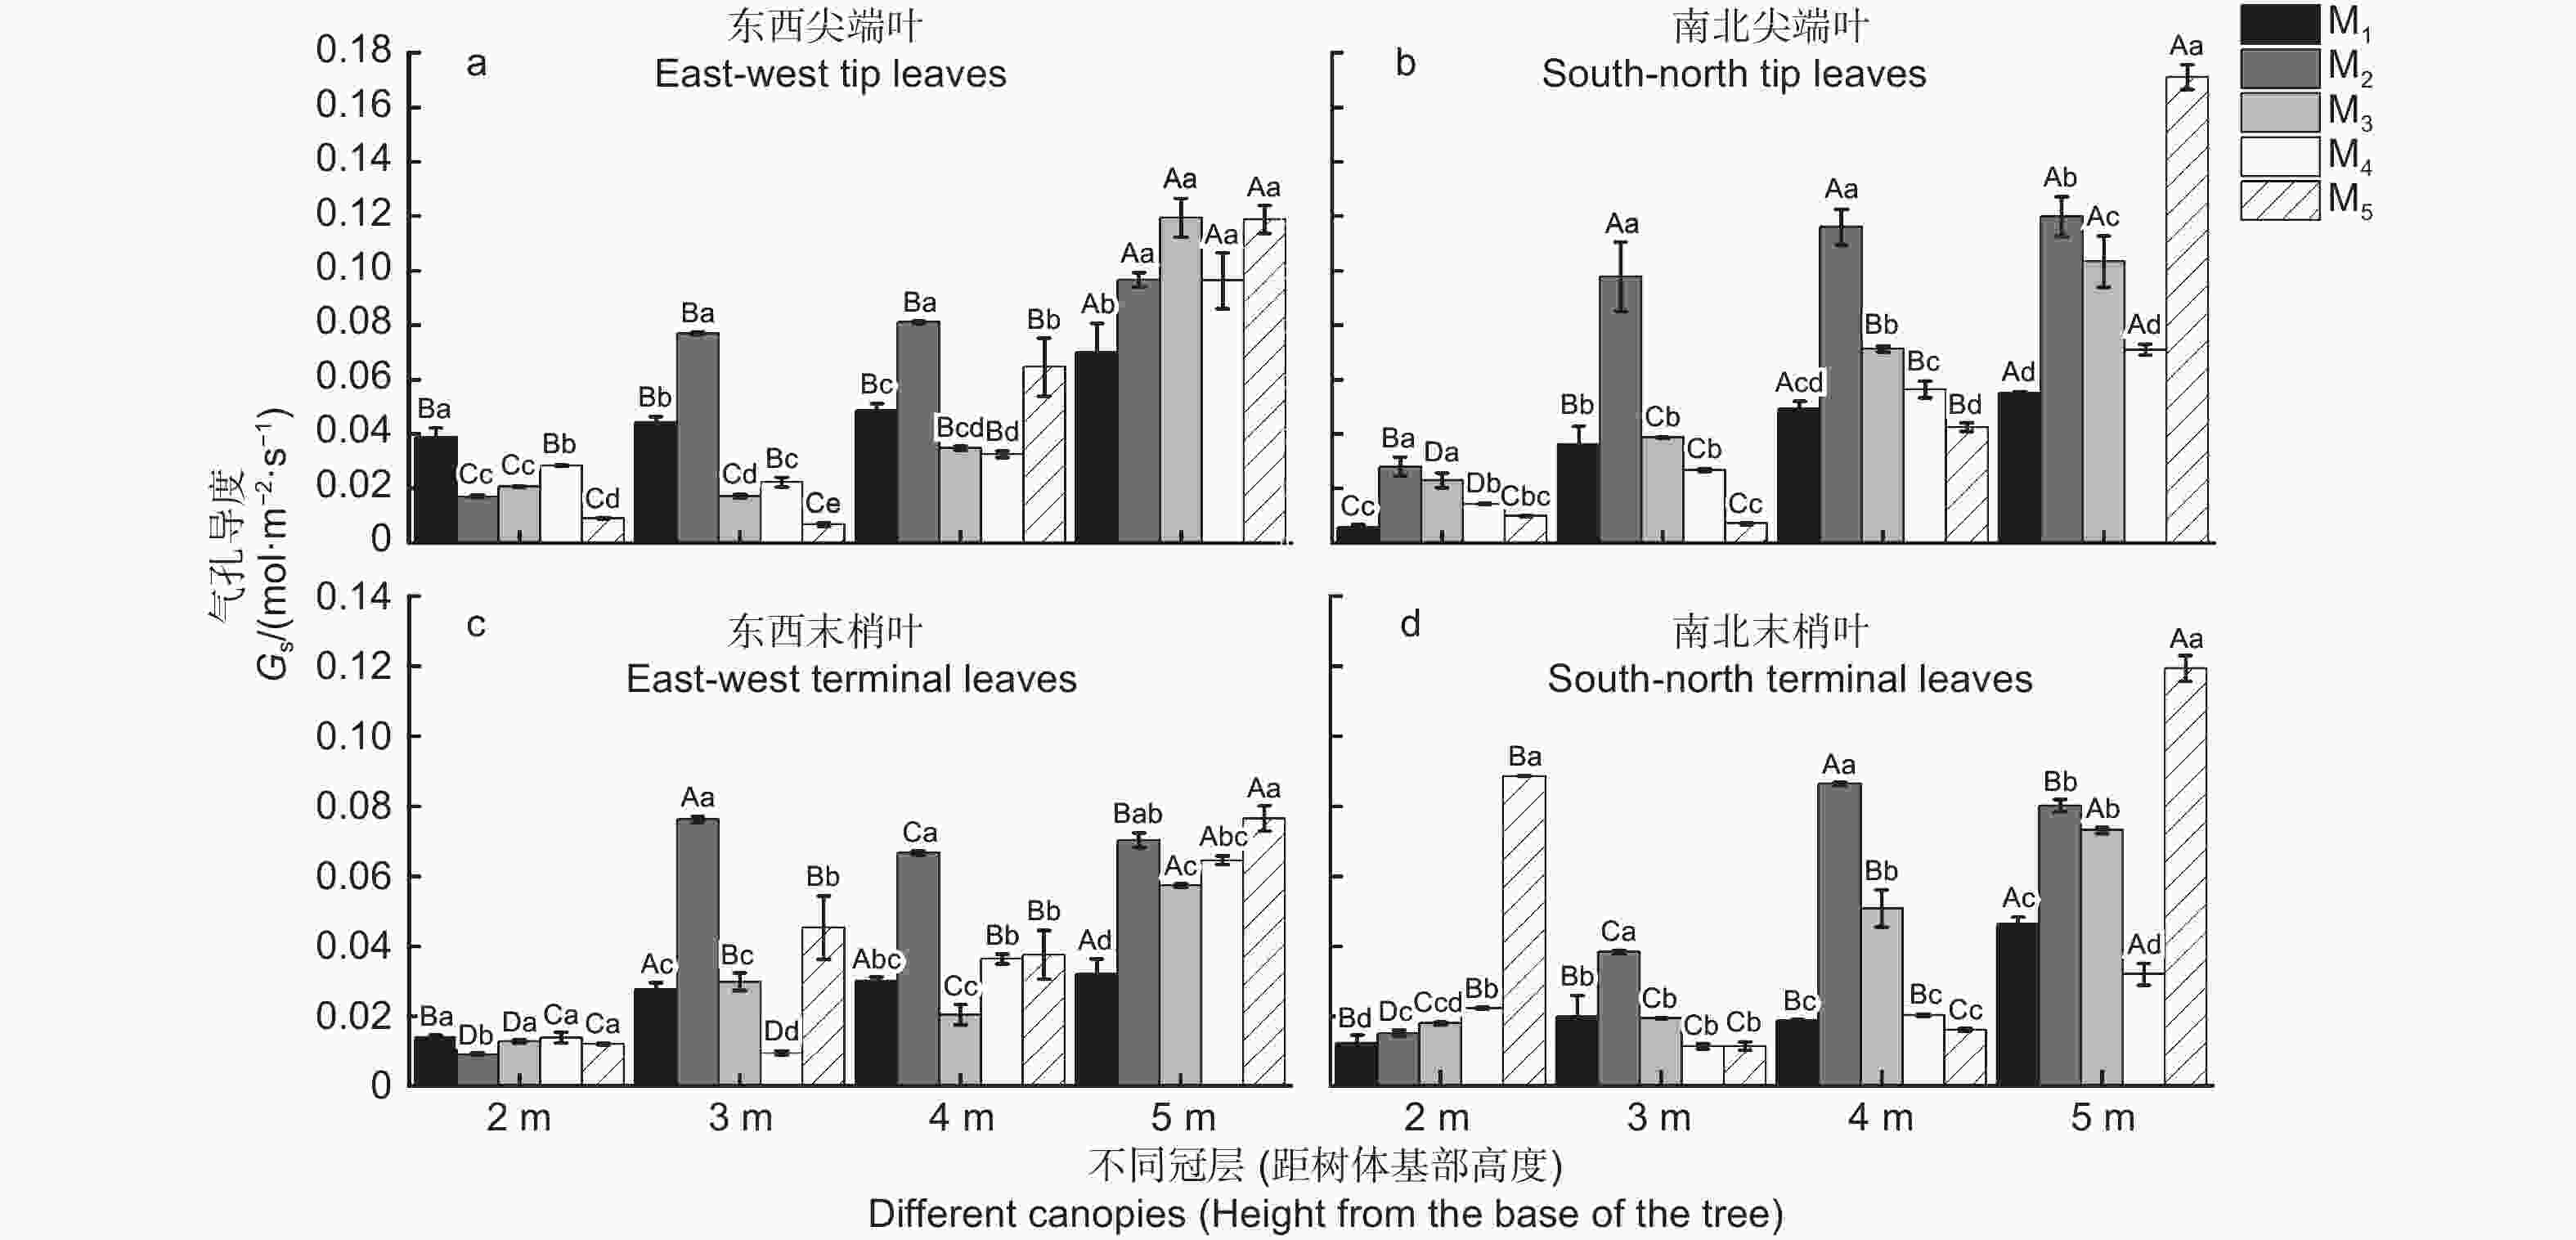
图 2 不同造林密度和不同冠层下杉木叶片的气孔导度差异分析
Figure 2. Analysis of stomatal conductance difference of C.lanceolata leaves under different planting densities and canopy
在不同冠层下,冠层2 m处东西向尖端叶和末梢叶的Gs均在M1密度下最大(图2a、c),而南北尖端叶和末梢叶的Gs分别在M2和M5密度下最大(图2b、d)。在冠层3、4 m处,东西、南北向尖端叶和末梢叶的Gs均在M2密度下最大(图2a~d)。在冠层5 m处,东西向尖端叶的Gs 在M3密度下最大(图2a),而南北向尖端叶、东西和南北向末梢叶的Gs均在M5密度下最大。
-
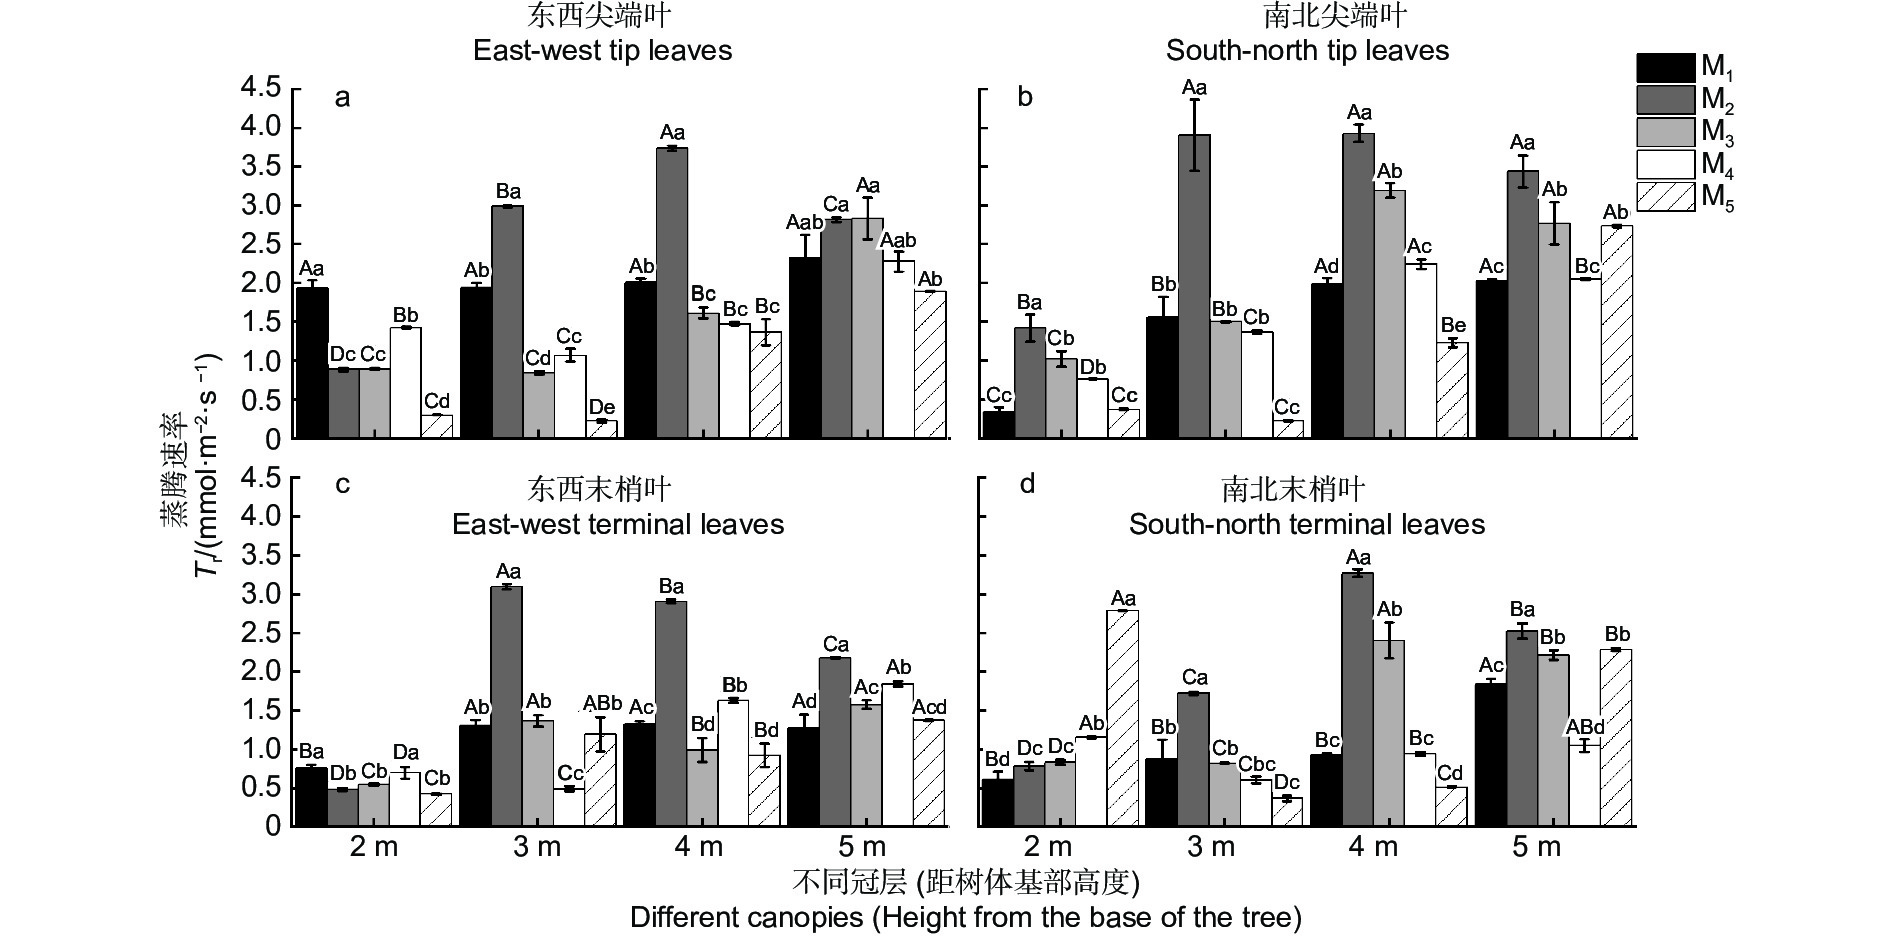
5个造林密度中,杉木东西向尖端叶的Tr值在M1、M3、M4、M5密度下整体为冠层5 m处最大,而在M2密度下整体为冠层4 m处的Tr值最大(图3a)。南北向尖端叶Tr值在M1、M5密度下为冠层5 m处的最大,但在M2、M3、M4密度下为冠层4 m处的Tr值最大(图3b)。东西向末梢叶Tr值在M1密度下为冠层4 m处最大,在M2密度下为冠层3 m处最大,在M3、M4、M5密度下为冠层5 m处的最大(图3c)。南北向末梢叶Tr值在M1密度下为冠层5 m处的最大,在M2、M3密度下为冠层4 m处的最大,在M4、M5密度下为冠层2 m处的最大(图3d)。
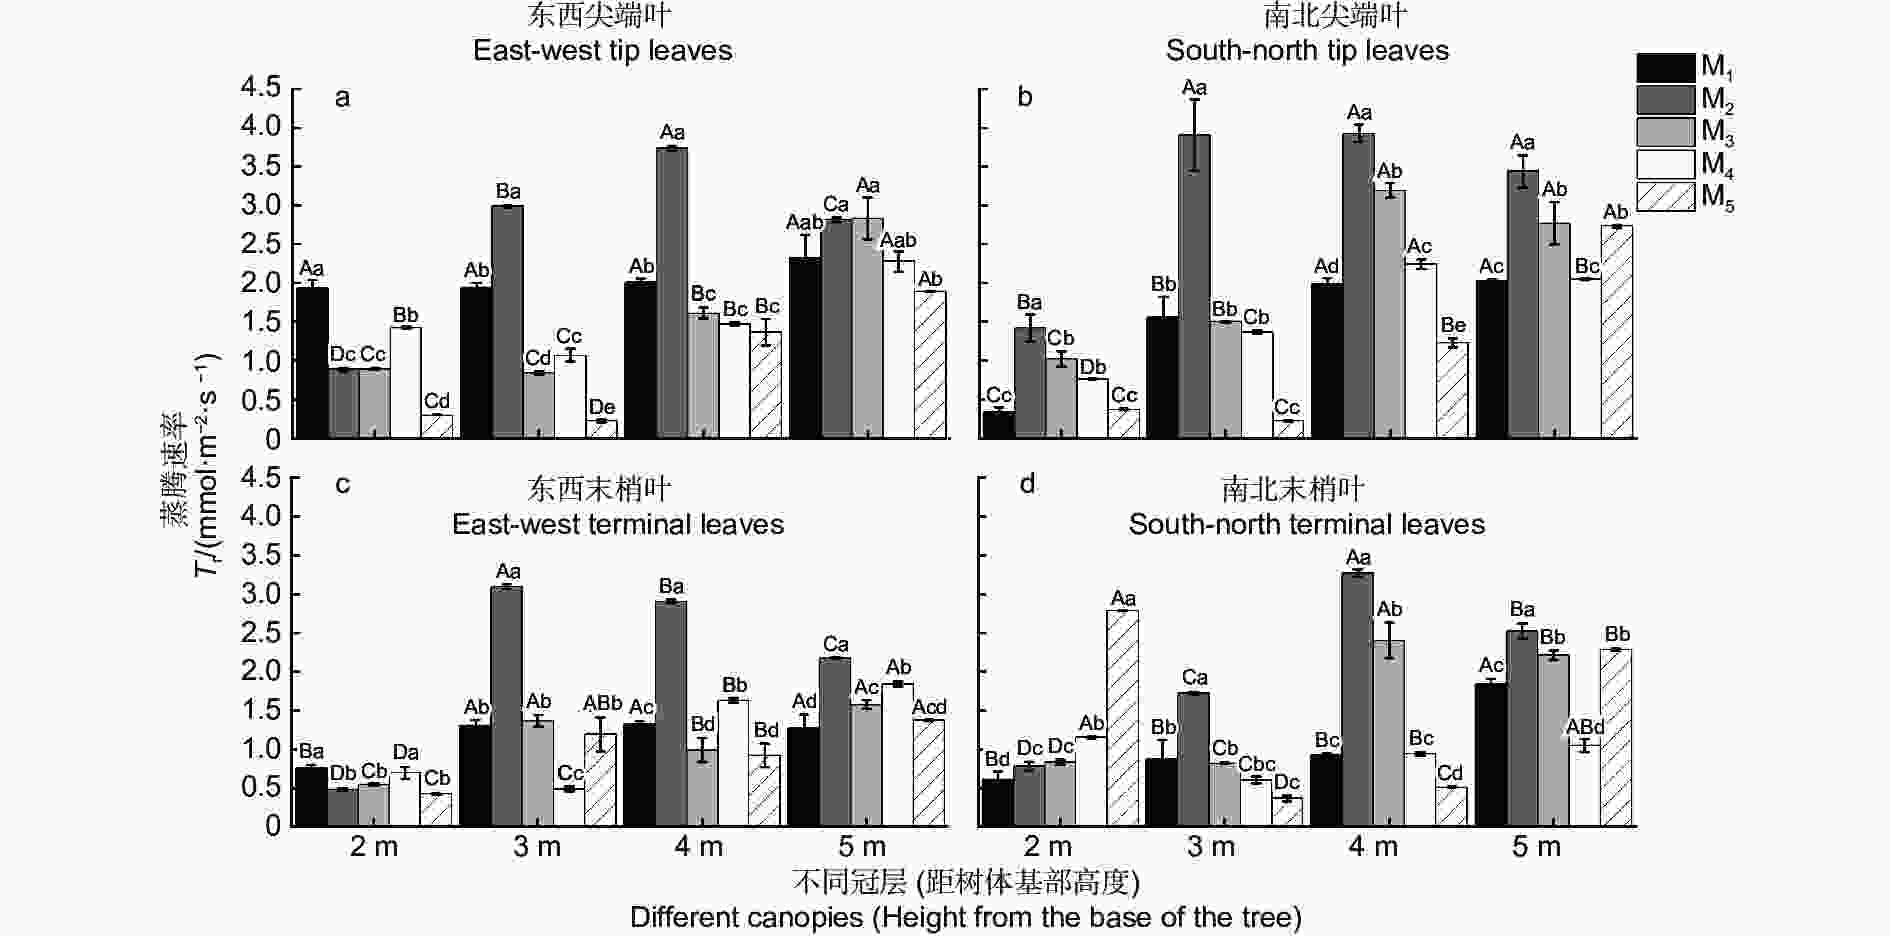
图 3 不同造林密度和冠层下杉木叶片的蒸腾速率差异分析
Figure 3. Analysis of transpiration rate difference of C.lanceolata leaves under different afforestation densities and canopy
在不同冠层下,东西和南北向的尖端叶与末梢叶的Tr值在冠层2 m处分别为M1、M2、M1、M5密度下最大,且大多显著高于其他4种密度;在冠层3、4 m处均为M2密度的最大,且均显著高于其他4种密度(图3a~d)。在冠层5 m处,东西向尖端叶Tr为M3密度的最大(图3a),但南北尖端叶、东西和南北末梢叶Tr均在M2密度下最大,且均显著高于其他4种密度(图3b~d)(P<0.05)。
-
由图4可知,杉木东西、南北向尖端叶和末梢叶的WUE值在5种造林密度下整体表现为距树体基部下层向上层递增的趋势。不同造林密度下,冠层5 m处的WUE值大多显著高于冠层4、3、2 m处的WUE(P < 0.05),但在M5密度下冠层2和3 m处的WUE值、M4密度下冠层2 m处WUE值均出现负值(图4a~d)。
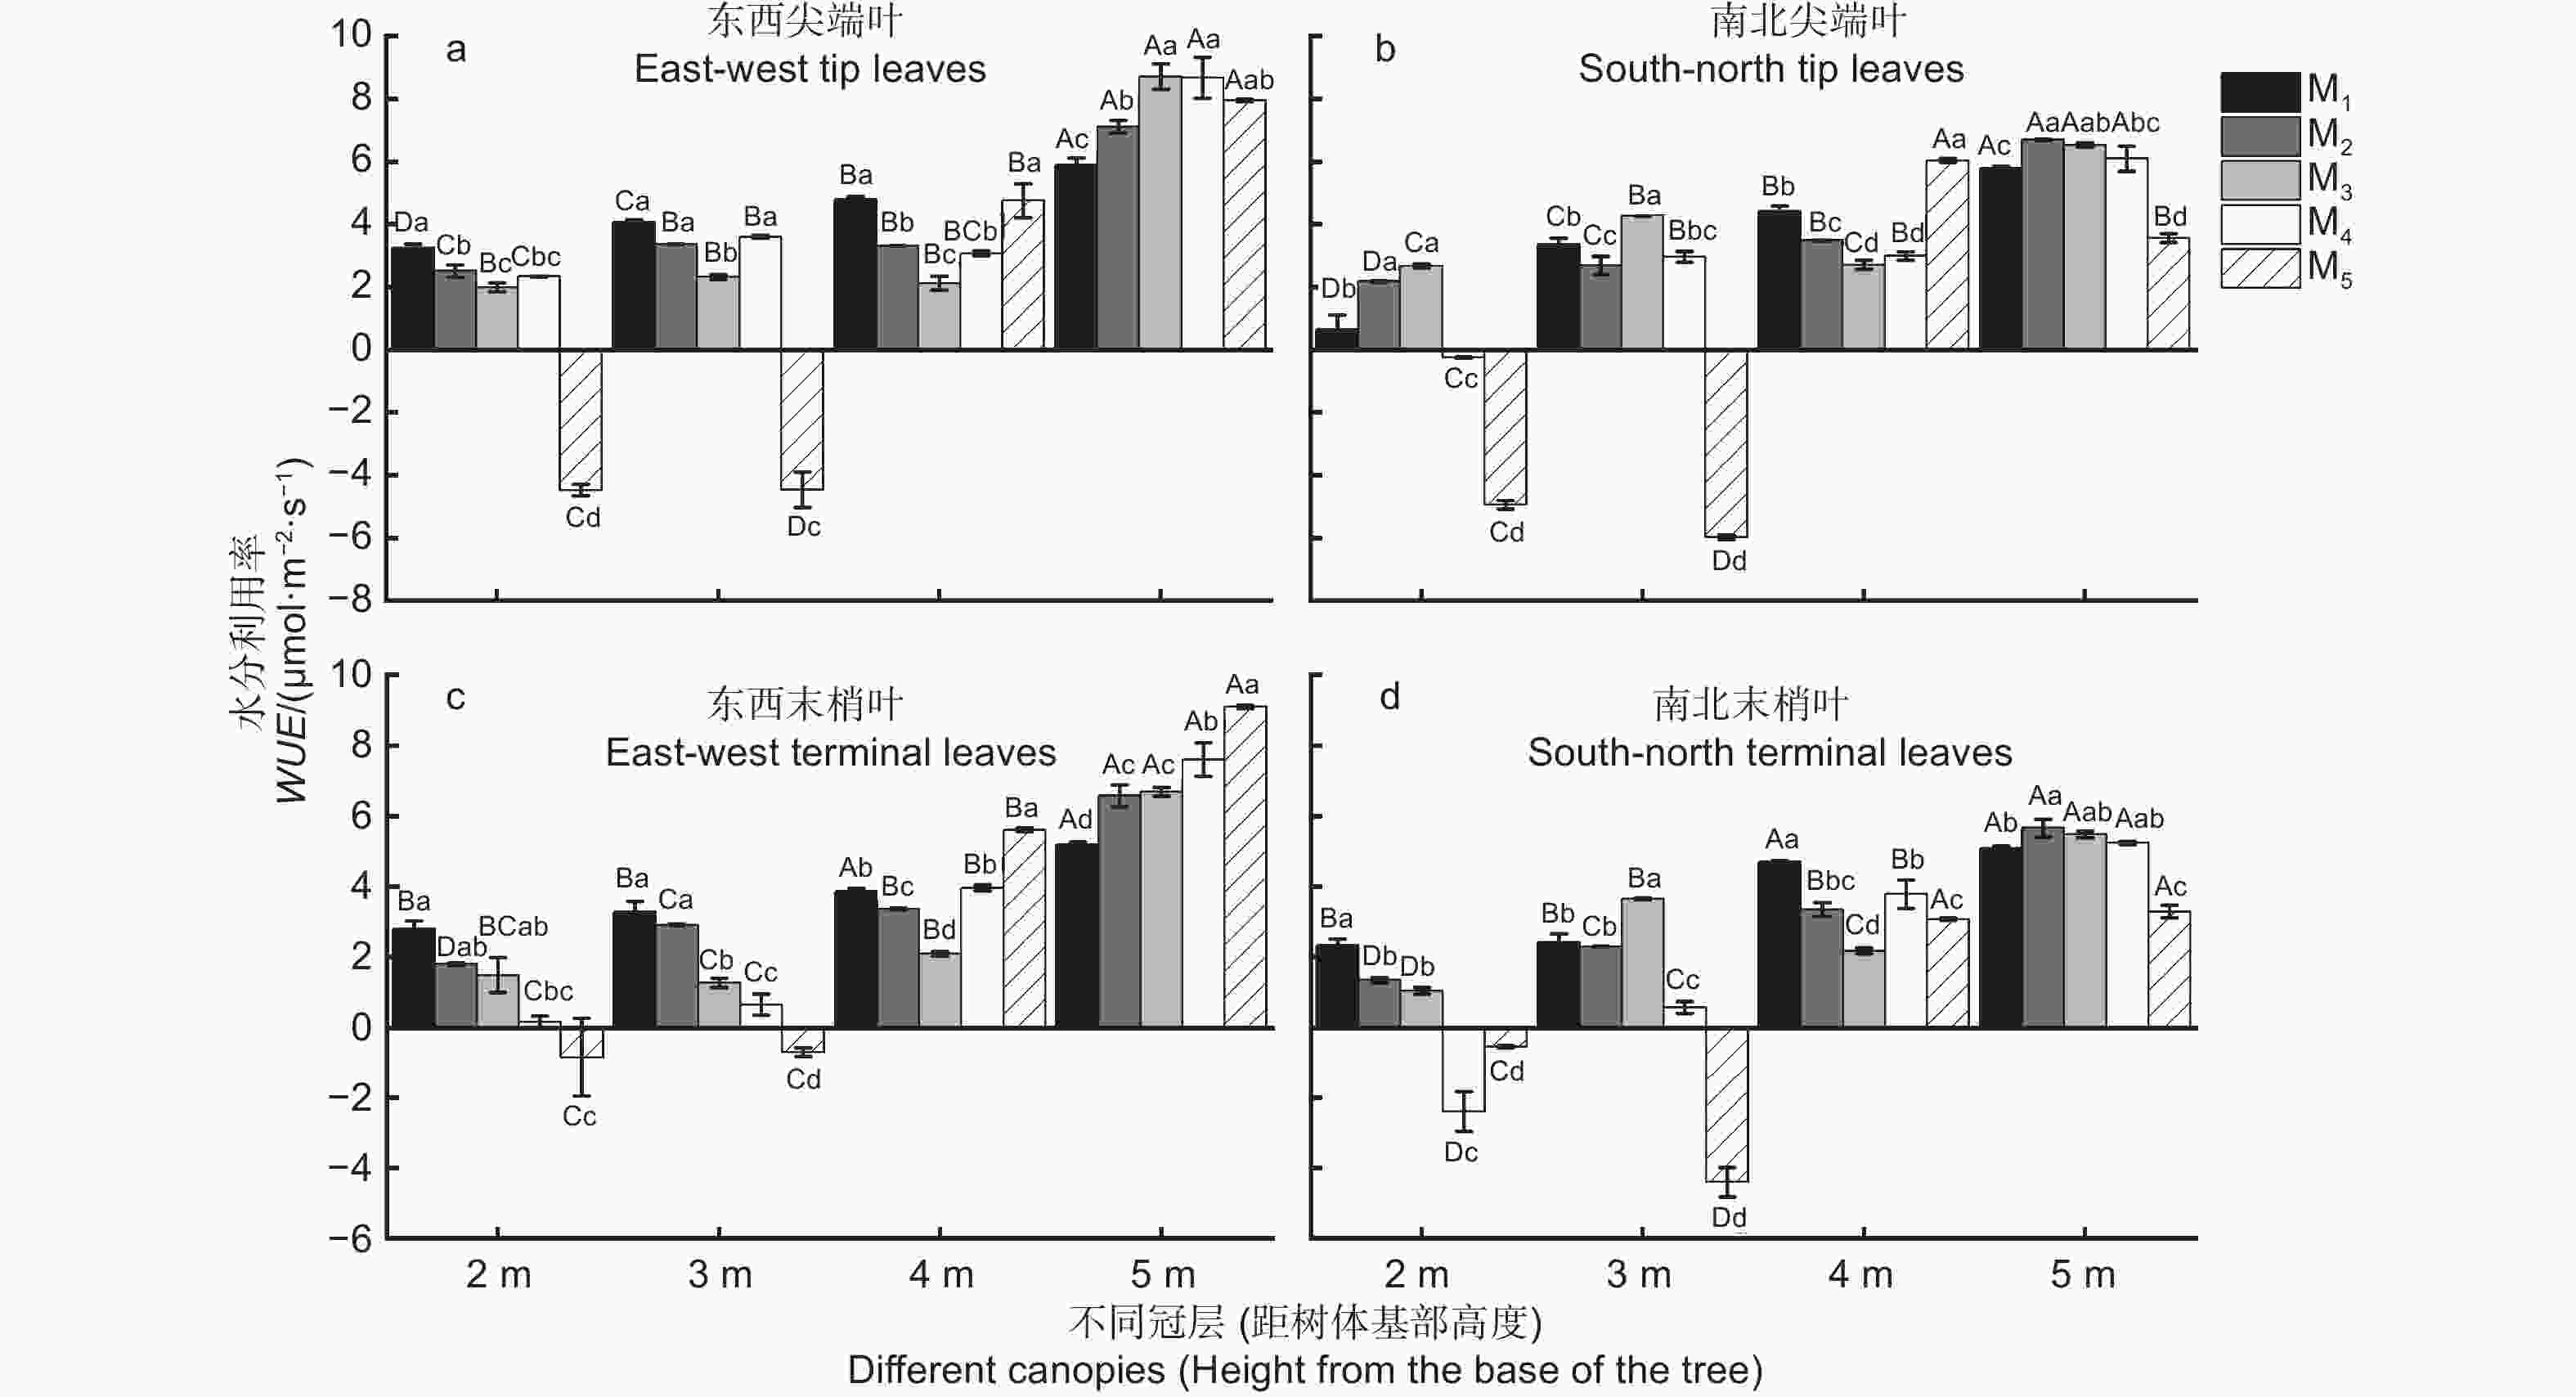
图 4 不同造林密度和冠层下杉木叶片的水分利用效率差异分析
Figure 4. Difference analysis of water use efficiency of C.lanceolata leaves under different planting densities and canopy
在不同冠层下,冠层2 m处东西向尖端叶、东西和南北向末梢叶的WUE均是M1密度下最大(图4a、c、d),但南北向尖端叶WUE在M3密度下最大(图4b)。在冠层3 m处,东西向尖端和末梢叶的WUE均在M1密度最大(图4a、c),而南北向尖端和末梢叶WUE均在M3密度下最大(图4b、d)。在冠层4 m处,东西向尖端叶和南北向末梢叶的WUE值均在M1密度下最大(图4a、d),而南北尖端叶和东西末梢叶的WUE均在M5密度下最大(图4b、c)。在冠层5 m处,东西向尖端和末梢叶的WUE分别在M3和M5密度下最大(图4a、c),而南北向尖端和末梢叶WUE均在M2密度下最大(图4b、d)。
-
由表2可知,在树冠2 m和 3 m处,造林密度M1、M2、M3、M4下杉木叶片在不同枝条部位上的Pn、WUE大多表现为尖端叶>末梢叶,但 M5造林密度下大多表现为末梢叶>尖端叶。在5个造林密度中,M1密度在树冠2 m和3 m处东西向尖端叶的Pn、WUE均为最大,分别是其他方向和枝条部位最小值的10.6、5.1倍和2.6、1.7倍;在M2密度下,树冠2 m和3 m处南北向尖端叶的Pn值均最大,树冠 2 m和3 m处东西向尖端叶的WUE均最大。在M3密度下,树冠2 m和 3 m处南北向尖端叶的Pn、WUE均为最大。在M4密度下,树冠2 m处东西向尖端叶的Pn、WUE均为最大;树冠 3 m处南北向尖端叶的Pn最大,东西向尖端叶WUE最大。在M5密度下,树冠2 m处东西向末梢叶的Pn最大,南北向末梢叶的WUE最大,树冠3 m东西向末梢叶的Pn、WUE均为最大。
表 2 不同造林密度和冠层(距离树体基部2 m和3 m处)杉木叶片光合特性在不同方向和枝条部位间的差异分析
Table 2. Analysis of photosynthetic characteristics of C.lanceolata leaves in different directions and branches in different forest densities and canopy layers (2 m and 3 m away from the base of the tree)
不同冠层
Different canopy距离树体基部2 m处
2 m from the base of the tree距离树体基部3 m处
3 m from the base of the tree不同造林密度
Different afforestation
densities不同方向、枝条部位
Different directions,
branch parts净光合速率
Pn/
(μmol·m−2·s−1)水分利用率
WUE/
(μmol·m−2·s−1)净光合速率
Pn/
(μmol·m−2·s−1)水分利用率
WUE/
(μmol·m−2·s−1)
M1东西尖端叶 6.46 ± 0.06 a 3.25 ± 0.11 a 7.97 ± 0.38 a 4.07 ± 0.08 a 东西末梢叶 1.94 ± 0.04 b 2.80 ± 0.23 ab 4.61 ± 0.60 bc 3.29 ± 0.29 b 南北尖端叶 0.61 ± 0.18 c 0.64 ± 0.46 c 5.97 ± 1.17 ab 3.37 ± 0.18 b 南北末梢叶 1.67 ± 0.34 b 2.34 ± 0.17 b 3.02 ± 1.07 c 2.42 ± 0.24 c
M2东西尖端叶 2.22 ± 0.17 b 2.51 ± 0.19 a 10.07 ± 0.03 ab 3.37 ± 0.00 a 东西末梢叶 0.88 ± 0.05 c 1.80 ± 0.04 c 9.02 ± 0.17 b 2.91 ± 0.03 b 南北尖端叶 3.08 ± 0 .38 a 2.18 ± 0.03 b 12.32 ± 2.03 a 2.68 ± 0.29 bc 南北末梢叶 1.00 ± 0.03 c 1.35 ± 0.08 d 3.95 ± 0.04 c 2.29 ± 0.01 c
M3东西尖端叶 1.76 ± 0.11 b 1.99 ± 0.14 ab 1.93 ± 0.03 c 2.32 ± 0.08 c 东西末梢叶 0.70 ± 0.25 c 1.49 ± 0.05 bc 1.83 ± 0.23 c 1.27 ± 0.13 d 南北尖端叶 2.82 ± 0.33 a 2.67 ± 0.06 a 6.39 ± 0.04 a 4.26 ± 0.01 a 南北末梢叶 0.91 ± 0.10 c 1.04 ± 0.09 c 3.01 ± 0.05 b 3.65 ± 0.03 b
M4东西尖端叶 3.33 ± 0.04 a 2.34 ± 0.01 a 3.89 ± 0.30 a 3.60 ± 0.04 a 东西末梢叶 0.31 ± 0.08 b 0.13 ± 0.18 b 0.47 ± 0.17 b 0.65 ± 0.03 c 南北尖端叶 −0.19 ± 0.01 b −0.25 ± 0.02 b 4.07 ± 0.25 a 2.96 ± 0.17 b 南北末梢叶 −2.67 ± 0.59 c −2.40 ± 0.56 c 0.24 ± 0.07 b 0.57 ± 0.17 c
M5东西尖端叶 −1.33 ± 0.03 b −4.48 ± 0.18 b −1.14 ± 0.21 b −4.46 ± 0.57 b 东西末梢叶 −0.52 ± 0.48 a −0.85 ± 1.11 a −0.45 ± 0.02 a −0.70 ± 0.12 a 南北尖端叶 −1.85 ± 0.03 b −4.93 ± 0.13 b −1.33 ± 0.05 b −5.98 ± 0.08 c 南北末梢叶 −1.50 ± 0.09 b −0.54 ± 0.03 a −1.38 ± 0.03 b −4.40 ± 0.42 b 注:不同小写字母表示光合特性在同一冠层下不同方向和不同枝条部位之间差异显著(P<0.05)。下同
Notes: Different lowercase letters indicate significant differences in photosynthetic characteristics between different directions and branches under the same canopy (P<0.05). The same below由表3可知,树冠4 m和5 m处,5个密度下杉木不同枝条部位上叶片的Pn、WUE总体表现为尖端叶>末梢叶。在M1密度下,树冠4 m和5 m处东西向尖端叶的Pn、WUE为最大,分别是其他方向和枝条部位最小值的2.2、1.2、2.2、1.2倍。在M2密度下,树冠4 m和5 m处南北向尖端叶的Pn为最大,但WUE的差异不显著。在M3密度下,树冠4 m处南北向尖端叶的Pn、WUE均最大,树冠5 m处东西向尖端叶的Pn、WUE均最大。在M4密度下,树冠4 m处南北向尖端叶的Pn最大,树冠5 m处东西向尖端叶的Pn、WUE最大,分别是南北末梢叶(最小值)的3.8、1.7倍。在M5密度下,树冠4 m和5 m处东西向尖端叶的Pn最大。
表 3 不同造林密度和冠层(距离树体基部4 m和5 m处)杉木叶片光合特性在不同方向和不同枝条部位间的差异分析
Table 3. Analysis of photosynthetic characteristics of C.lanceolata leaves in different directions and branches in different forest densities and canopy layers (4 m and 5 m away from the base of the tree)
不同冠层
Different canopy距离树体基部4 m处
4 m from the base of the tree距离树体基部5 m处
5 m from the base of the tree不同造林密度
Different afforestation
densities不同方向、枝条部位
Different directions,
branch parts净光合速率
Pn/
(μmol·m−2·s−1)水分利用率
WUE/
(μmol·m−2·s−1)净光合速率
Pn/
(μmol·m−2·s−1)水分利用率
WUE/
(μmol·m−2·s−1)M1 东西尖端叶 9.66 ± 0.31 a 4.80 ± 0.09 a 14.62 ± 2.22 a 5.89 ± 0.21 a 东西末梢叶 5.17 ± 0.22 b 3.87 ± 0.08 c 6.51 ± 0.75 c 5.19 ± 0.07 b 南北尖端叶 8.98 ± 0.64 a 4.41 ± 0.17 a 11.76 ± 0.23 ab 5.78 ± 0.07 a 南北末梢叶 4.40 ± 0.03 b 4.71 ± 0.02 b 9.27 ± 0.25 bc 5.08 ± 0.06 b M2 东西尖端叶 10.44 ± 0.09 bc 3.31 ± 0.01 a 20.06 ± 0.70 b 7.11 ± 0.21 a 东西末梢叶 9.77 ± 0.06 c 3.36 ± 0.03 a 14.29 ± 0.63 c 6.57 ± 0.31 a 南北尖端叶 13.68 ± 0.39 a 3.48 ± 0.01 a 22.96 ± 1.32 a 6.70 ± 0.02 a 南北末梢叶 10.81 ± 0.49 b 3.35 ± 0.20 a 13.97 ± 0.29 c 5.65 ± 0.26 b M3 东西尖端叶 3.18 ± 0.20 c 2.12 ± 0.22 b 23.06 ± 1.18 a 8.71 ± 0.40 a 东西末梢叶 1.94 ± 0.26 d 2.10 ± 0.06 b 10.44 ± 0.19 c 6.68 ± 0.13 b 南北尖端叶 8.50 ± 0.18 a 2.74 ± 0.14 a 18.03 ± 1.73 b 6.53 ± 0.07 b 南北末梢叶 4.93 ± 0.28 b 2.18 ± 0.09 b 12.08 ± 0.15 c 5.48 ± 0.09 c M4 东西尖端叶 4.54 ± 0.16 b 3.07 ± 0.08 b 20.97 ± 2.61 a 8.67 ± 0.65 a 东西末梢叶 6.48 ± 0.19 a 3.96 ± 0.09 a 13.81 ± 0.63 b 7.59 ± 0.47 a 南北尖端叶 6.84 ± 0.50 a 2.99 ± 0.14 b 12.48 ± 0.82 b 6.09 ± 0.40 b 南北末梢叶 3.46 ± 0.31 c 3.78 ± 0.40 a 5.46 ± 0.39 c 5.24 ± 0.05 b M5 东西尖端叶 7.85 ± 1.54 a 4.76 ± 0.54 b 15.03 ± 0.10 a 7.95 ± 0.03 b 东西末梢叶 5.09 ± 0.79 b 5.60 ± 0.05 a 12.50 ± 0.15 b 9.09 ± 0.05 a 南北尖端叶 7.37 ± 0.30 ab 6.04 ± 0.07 a 9.71 ± 0.32 c 3.56 ± 0.13 c 南北末梢叶 1.59 ± 0.04 c 3.08 ± 0.04 c 7.46 ± 0.35 d 3.29 ± 0.18 c 由表4可见,不同密度,不同冠层,不同方向,不同枝条部位及其交互作用均对杉木叶片的光合特性指标有极显著影响(P<0.01),但不同方向和不同枝条部位的交互作用对杉木的光合特性指标均无显著影响(P>0.05)。
表 4 不同密度、冠层、方向和枝条部位对杉木光合指标和水分利用效率影响的多因素方差
Table 4. Multivariate variance of the effects of different densities, canopy layers, directions and branch positions on photosynthetic indexes and water use efficiency of C.lanceolata
因子
Factordf 净光合速率
Pn气孔导度
Gs蒸腾速率
Tr水分利用效率
WUEF P F P F P F P 密度(M) 4 196.701 <0.001** 201.671 <0.001** 344.191 <0.001** 321.605 <0.001** 冠层(G) 3 1366.650 <0.001** 1001.410 <0.001** 493.114 <0.001** 2043.925 <0.001** 方向(X) 1 35.664 <0.001** 20.724 <0.001** 35.286 <0.001** 220.393 <0.001** 枝条部位(W) 1 482.325 <0.001** 346.671 <0.001** 299.087 <0.001** 27.300 <0.001** M × G 12 33.263 <0.001** 89.177 <0.001** 75.609 <0.001** 198.737 <0.001** M × X 4 32.231 <0.001** 26.711 <0.001** 39.416 <0.001** 51.716 <0.001** M × W 4 9.528 <0.001** 16.579 <0.001** 41.586 <0.001** 72.122 <0.001** G × X 3 25.111 <0.001** 11.672 <0.001** 18.251 <0.001** 56.980 <0.001** G × W 3 50.343 <0.001** 96.328 <0.001** 37.262 <0.001** 9.936 <0.001** X × W 1 3.314 0.069 1.349 0.246 2.794 0.095 2.710 0.100 M × G × X 12 10.936 <0.001** 31.948 <0.001** 25.587 <0.001** 25.184 <0.001** M × G × W 12 7.958 <0.001** 16.060 <0.001** 12.575 <0.001** 30.181 <0.001** M × X × W 4 11.854 <0.001** 13.125 <0.001** 20.412 <0.001** 12.820 <0.001** G × X × W 3 14.181 <0.001** 42.600 <0.001** 67.654 <0.001** 3.425 0.017* M × G × X × W 12 3.254 <0.001** 8.817 <0.001** 9.883 <0.001** 4.852 <0.001** 注/Notes:*,P<0.05;**,P<0.01 -
植物光合作用对林木生长发育具有重要的影响,特别是林木树冠光合作用的空间异质性研究可为林木光合能力进行精确评估提供科学依据[13]。同时,确定造林密度是人工林培育环节中的一个重要环节,合理的造林密度是林木获取养分资源和保证生长发育的前提[14-15]。本研究通过对杉木幼林不同造林密度、冠层、方向、枝条部位叶片进行系统的光合特征指标的测定[16]。研究发现,冠层2 m处M1密度的Pn、WUE反而更高,说明低造林密度以及下冠层对弱光的利用率要分别大于高造林密度以及上冠层,这与骆丹等[17]对西南桦(Betula alnoides D. Don)、李勇[18]等对油松(Pinus tabuliformis Carrière)、刘强[19]等对长白落叶松(Larix olgensis A. Henry)等研究的结果基本一致,可能是杉木低冠层长期处于弱光环境,且低造林密度的林分具有较长的树冠及较大的冠幅,上冠层枝叶的遮挡使光辐射透过率较低,下冠层光环境更弱。在冠层3~5 m处,Pn、Tr、Gs、WUE值随造林密度增大总体呈现出先升后降的趋势,这与赵连春等[20]人对怪柳(Tamarix chinensis Lour.)光合特性的研究结果基本一致,M2密度达到最大值说明不同造林密度对杉木光合特性有显著的影响,合理的造林密度对于培育高效优质的杉木人工林有很关键作用[21]。此外,在树冠2、3 m处Pn、WUE出现负值,这可能是与M4、M5密度较大,使杉木叶片之间相互遮阳逐渐形成不利于叶片光合作用的环境[22],表明较高的造林密度会导致光照在林分中的分布变得不均匀。在高密度林地中,上层树冠相互竞争光照资源,使下层枝叶接受到较弱的光照,从而降低下层枝条的光合作用效率[3],故可考虑进行适当营林措施优化树冠结构,以促进杉木的生长和发育。
-
研究表明杉木叶片光合特性的影响因素很多,但多数学者认为光环境变化是造成不同部位叶片光合能力差异的主要原因[23-25],Baldochhi等认为,光在林木冠层中的传递和分配方式适用于比尔定律[13],即光照强度从树冠2~5 m呈指数函数递增,周围的空气温度和湿度也随之变化,使不同冠层形成不同的微气候环境。在本研究中,杉木各光合指标在4个冠层上有明显的差异,随冠层升高其光合指标Pn、Gs、Tr、WUE显著增大,这与郑元[16]和孟陈[10]等人研究结果一致,造成这种差异可能与光照强度、叶片中的叶绿素和叶氮含量在冠层垂直分布的差异有关[26-28]。因此,依据不同冠层枝条叶片的光合特性的差异,对下冠层光合能力较差的枝条进行营林措施处理,可提高其光合能力。本研究发现树冠3~4 m差别较小,而树冠2和5 m差异显著,产生这种差异主要与其所处的光环境有关,树冠5 m处的枝叶光照条件充足,而树冠2 m的枝叶获得的透射光或散射光较少,且强度较弱[17]。此外,提供给光合作用的物质能量和水分主要来源于蒸腾作用,光环境不仅对光照条件有直接影响,且对水分、温湿度等也有间接影响,进而对蒸腾速率和水分利用效率产生影响[18],本研究发现不同冠层叶片所处的光照条件的差异[29-30],不仅影响各冠层的光合速率,还对蒸腾和水分利用效率均产生了显著的影响。
-
一般认为,气孔是植物进行CO2和水汽交换的一个重要通道,反映这种交换能力的一个关键指标就是Gs[31],而Tr和Gs之间有着非常紧密的联系,二者都是影响光合速率的重要生理指标[32],在本研究结果中杉木叶片Gs、Tr对Pn的影响表现出较大的差异。另外,不同造林密度和冠层的杉木光合特征在不同方向上差异均显著,这与郑元[16]对刺槐(Robinia pseudoacacia L.)的研究结果不一致,可能是郑元等人将树冠分为东、西、南、北4个方位进行测定,而本实验采用东西向与南北向两个方位测定;也可能是所选用林木的龄级不同使本实验结果与郑元等人研究不一致。
在自然条件下,人工林中林木同一枝条不同部位针叶的净光合率差异显著[23]。本研究发现,Pn、WUE在不同枝条部位上均表现为尖端叶>末梢叶,这与郭继善[33]和肖文发[23]等的研究结果基本一致。由于不同部位的枝叶对稳态和动态光照的反应与其对所处光环境的长期适应有一定关系,处于枝条末梢的叶片靠近树干,冠层浓密,光照强度较弱,而处于枝条尖端的叶片光环境相对优越[24-25]。但本研究发现在M5较高密度下树冠2~3 m处的光合指标表现为末梢叶大于尖端叶,这可能是因为造林密度过大,冠层上部和周围林冠的长期遮阳使光线因子失去光合时的主导性[7]。
-
整体上,5年生杉木叶片在冠层2 m处的Pn、WUE随造林密度的增加而减小,在冠层3~5 m处,Pn、Gs、Tr、WUE随造林密度的增加呈现先升后降的趋势。Pn、Gs、Tr、WUE均随冠层的升高而显著增大,树冠5 m处的枝叶光照条件充足,光合作用较强。5个造林密度中M2密度(1667 株·hm−2)的杉木叶片在不同冠层和枝条方向上的光合能力整体上更强,在4个冠层中各造林密度下均为树冠5 m处的杉木叶片表现出更大的光合潜力,尖端叶的光合能力强于末梢叶,东西向枝条叶片光合能力强于南北向枝条叶片。在M5造林密度(6667 株·hm−2)的冠层2 m和3 m处、M4密度造林(3333 株·hm−2)的冠层2 m处的枝条叶片净光合速率出现负值,即密度的增加会对森林内光照资源产生影响,特别是位于低冠层的枝叶,且密度越大,冠层受到的影响也越明显。
不同造林密度和冠层下杉木幼林叶片光合特性的差异研究
Photosynthetic Characteristics of Leaves under Different Planting Densities and Canopies in Young Cunninghamia lanceolata Seedlings
-
摘要:
目的 合理的造林密度和冠层结构可有效提高林木光合效率和生长发育,研究不同造林密度下的杉木幼林不同冠层、方向和枝条部位的叶片光合特征,可为杉木大径级无节良材培育中科学界定合理的造林密度和修枝高度提供理论依据。 方法 以5年生杉木林为对象,于5个造林密度(M1: 833、M2: 1667、M3: 2500、M4: 3 333、M5: 6 667 株·hm−2)样地中选择3株标准木,分5个不同冠层(距离树体基部1、2、3、4、5 m处)、枝条朝向(东西和南北)、枝条叶片部位(尖端和末梢),测量光合特性值净光合速率(Pn)、蒸腾速率(Tr)和气孔导度(Gs)并计算水分利用效率(WUE)。 结果 1)在冠层2 m处,Pn、WUE随造林密度的增加而减小,在冠层3~5 m处Pn、Gs、Tr、WUE随造林密度的增加呈现先升后降的趋势。2)Pn、Gs、Tr、WUE均随冠层的升高而显著增大,树冠5 m处的枝叶光照条件充足,光合作用较强。3)除在M4、M5密度下树冠2~3 m处的杉木叶片Pn、Gs、Tr、WUE在不同枝条部位表现为末梢叶>尖端叶外,其余的不同冠层和不同密度下的杉木叶片Pn、Gs、Tr、WUE在不同枝条部位表现为尖端叶>末梢叶。 结论 5个造林密度中M2密度(1667株·hm−2)的杉木叶片在不同冠层和枝条方向上的光合能力整体上更强,在4个冠层中各造林密度下均为树冠5 m处的杉木叶片表现出更大的光合潜力,尖端叶的光合能力强于末梢叶,东西向枝条叶片光合能力强于南北向枝条叶片。在M5造林密度(6667株·hm−2)的冠层2和3 m处、M4密度造林(3333株·hm−2)的冠层2 m处的枝条叶片净光合速率出现负值,即密度的增加会对林内光照资源产生影响,特别是位于低冠层的枝叶,且密度越大冠层光合能力受到的影响也越明显。 Abstract:Objective Reasonable planting density and canopy structure can effectively improve the photosynthetic efficiency and growth of forest trees. The study of leaf photosynthetic characteristics of Cunninghamia lanceolata seedlings in different canopy layers, directions and branch positions under different planting densities can provide theoretical basis for scientifically defining reasonable planting density and pruning height of C. lanceolata in the cultivation of large-diameter classless trees. Method Three standard trees were selected from five plots with planting density (M1: 833、M2: 1667、M3: 2500、M4: 3333、M5: 6667 tree·hm−2) , there are five different canopy layers (1, 2, 3, 4, 5 m away from the base of the tree), two different orientations of branches (east and west, north and south), and two different parts of branches and leaves (tips and endings).The net photosynthetic rate (Pn), transpiration rate (Tr), and stomatal conductance (Gs) were measured, and water use efficiency (WUE) was calculated. Result 1) At 2 m of the canopy, the Pn and WUE decreased with the increase of planting density, and the Pn, Gs, Tr, and WUE increased first and then decreased at 3~5 m of the canopy. 2) the Pn, Gs, Tr, and WUE increased significantly with the increase of canopy, and the light condition of branches and leaves at 5 m of canopy was sufficient and photosynthesis was strong. 3) Except for the leaves at 2 to 3 m of the canopy under M4 and M5 densities, Pn, Gs, Tr, and WUE in terminal leaves were larger than those in tip leaves at different branch positions, Pn, Gs, Tr, and WUE in the remaining leaves under different canopies and different densities showed the order of tip leaves > terminal leaves in different branch locations. Conclusion Among the five planting densities, the leaves at M2 density (1667 tree·hm−2) have stronger photosynthetic capacity in different canopy and branch directions. In the four canopies, the leaves at 5 m of the canopy showed greater photosynthetic potential. The photosynthetic capacity of the tip leaf was stronger than that of the terminal leaf, and that of the east-west branch leaf was stronger than that of the south-north branch leaf. The net photosynthetic rate of branches and leaves in the canopy 2 m and 3 m of M5 planting density (6667 tree·hm−2) and 2 m of M4 density (3333 tree·hm−2) showed a negative value in C. lanceolata, that is, the increase of density will have an impact on the light resources in the forest, especially in the branches and leaves in the low canopy. The higher the density, the more obvious the impact on the canopy. -
图 1 不同造林密度冠层下杉木叶片的净光合速率差异分析
Figure 1. Analysis on the difference of net photosynthetic rate of C.lanceolata leaves under different afforestation densities and canopy
图 2 不同造林密度和不同冠层下杉木叶片的气孔导度差异分析
Figure 2. Analysis of stomatal conductance difference of C.lanceolata leaves under different planting densities and canopy
图 3 不同造林密度和冠层下杉木叶片的蒸腾速率差异分析
Figure 3. Analysis of transpiration rate difference of C.lanceolata leaves under different afforestation densities and canopy
图 4 不同造林密度和冠层下杉木叶片的水分利用效率差异分析
Figure 4. Difference analysis of water use efficiency of C.lanceolata leaves under different planting densities and canopy
表 1 不同造林密度下杉木幼龄林生长和土壤养分基本数据表
Table 1. Basic data table of growth and soil nutrients of C.lanceolata under different planting densities
造林密度
Afforestation density/
(株·hm−2)样树信息
Sample tree information土壤养分数据
Soil nutrient data胸径 DBH /cm 树高 H /m 全氮含量
Total nitrogen content/
(g·kg−1)全磷含量
Total phosphorus content/
(g·kg−1)全钾含量
Total potassium content/
(g·kg−1)有机质含量
Organic matter content/
(g·kg−1)样树一
Sample tree 1样树二
Sample tree 2样树三
Sample tree 3样树一
Sample tree 1样树二
Sample tree 2样树三
Sample tree 3M1 833 11.1 12.2 12.25 8.15 8.09 8.27 1.03AB 0.29A 9.33AB 37.5AB M2 1667 12.9 12.5 12.55 8.23 7.83 8.03 1.04AB 0.30A 9.56AB 38.2A M3 2500 9.2 12.2 10.85 7.83 8.36 8.02 1.00B 0.34A 9.21B 35.5B M4 3333 9.5 9.1 9.15 7.52 7.24 7.50 1.07A 0.32A 9.66A 37.4AB M5 6667 9.8 7.2 8.65 7.96 7.25 7.38 1.06AB 0.32A 9.59AB 37.9A 注:相同大写字母表示土壤养分在不同造林密度之间差异不显著(p > 0.05)
Note:Different uppercase letters indicate significant differences in soil nutrients between different afforestation density 下载: 导出CSV
表 2 不同造林密度和冠层(距离树体基部2 m和3 m处)杉木叶片光合特性在不同方向和枝条部位间的差异分析
Table 2. Analysis of photosynthetic characteristics of C.lanceolata leaves in different directions and branches in different forest densities and canopy layers (2 m and 3 m away from the base of the tree)
不同冠层
Different canopy距离树体基部2 m处
2 m from the base of the tree距离树体基部3 m处
3 m from the base of the tree不同造林密度
Different afforestation
densities不同方向、枝条部位
Different directions,
branch parts净光合速率
Pn/
(μmol·m−2·s−1)水分利用率
WUE/
(μmol·m−2·s−1)净光合速率
Pn/
(μmol·m−2·s−1)水分利用率
WUE/
(μmol·m−2·s−1)
M1东西尖端叶 6.46 ± 0.06 a 3.25 ± 0.11 a 7.97 ± 0.38 a 4.07 ± 0.08 a 东西末梢叶 1.94 ± 0.04 b 2.80 ± 0.23 ab 4.61 ± 0.60 bc 3.29 ± 0.29 b 南北尖端叶 0.61 ± 0.18 c 0.64 ± 0.46 c 5.97 ± 1.17 ab 3.37 ± 0.18 b 南北末梢叶 1.67 ± 0.34 b 2.34 ± 0.17 b 3.02 ± 1.07 c 2.42 ± 0.24 c
M2东西尖端叶 2.22 ± 0.17 b 2.51 ± 0.19 a 10.07 ± 0.03 ab 3.37 ± 0.00 a 东西末梢叶 0.88 ± 0.05 c 1.80 ± 0.04 c 9.02 ± 0.17 b 2.91 ± 0.03 b 南北尖端叶 3.08 ± 0 .38 a 2.18 ± 0.03 b 12.32 ± 2.03 a 2.68 ± 0.29 bc 南北末梢叶 1.00 ± 0.03 c 1.35 ± 0.08 d 3.95 ± 0.04 c 2.29 ± 0.01 c
M3东西尖端叶 1.76 ± 0.11 b 1.99 ± 0.14 ab 1.93 ± 0.03 c 2.32 ± 0.08 c 东西末梢叶 0.70 ± 0.25 c 1.49 ± 0.05 bc 1.83 ± 0.23 c 1.27 ± 0.13 d 南北尖端叶 2.82 ± 0.33 a 2.67 ± 0.06 a 6.39 ± 0.04 a 4.26 ± 0.01 a 南北末梢叶 0.91 ± 0.10 c 1.04 ± 0.09 c 3.01 ± 0.05 b 3.65 ± 0.03 b
M4东西尖端叶 3.33 ± 0.04 a 2.34 ± 0.01 a 3.89 ± 0.30 a 3.60 ± 0.04 a 东西末梢叶 0.31 ± 0.08 b 0.13 ± 0.18 b 0.47 ± 0.17 b 0.65 ± 0.03 c 南北尖端叶 −0.19 ± 0.01 b −0.25 ± 0.02 b 4.07 ± 0.25 a 2.96 ± 0.17 b 南北末梢叶 −2.67 ± 0.59 c −2.40 ± 0.56 c 0.24 ± 0.07 b 0.57 ± 0.17 c
M5东西尖端叶 −1.33 ± 0.03 b −4.48 ± 0.18 b −1.14 ± 0.21 b −4.46 ± 0.57 b 东西末梢叶 −0.52 ± 0.48 a −0.85 ± 1.11 a −0.45 ± 0.02 a −0.70 ± 0.12 a 南北尖端叶 −1.85 ± 0.03 b −4.93 ± 0.13 b −1.33 ± 0.05 b −5.98 ± 0.08 c 南北末梢叶 −1.50 ± 0.09 b −0.54 ± 0.03 a −1.38 ± 0.03 b −4.40 ± 0.42 b 注:不同小写字母表示光合特性在同一冠层下不同方向和不同枝条部位之间差异显著(P<0.05)。下同
Notes: Different lowercase letters indicate significant differences in photosynthetic characteristics between different directions and branches under the same canopy (P<0.05). The same below
下载: 导出CSV
表 3 不同造林密度和冠层(距离树体基部4 m和5 m处)杉木叶片光合特性在不同方向和不同枝条部位间的差异分析
Table 3. Analysis of photosynthetic characteristics of C.lanceolata leaves in different directions and branches in different forest densities and canopy layers (4 m and 5 m away from the base of the tree)
不同冠层
Different canopy距离树体基部4 m处
4 m from the base of the tree距离树体基部5 m处
5 m from the base of the tree不同造林密度
Different afforestation
densities不同方向、枝条部位
Different directions,
branch parts净光合速率
Pn/
(μmol·m−2·s−1)水分利用率
WUE/
(μmol·m−2·s−1)净光合速率
Pn/
(μmol·m−2·s−1)水分利用率
WUE/
(μmol·m−2·s−1)M1 东西尖端叶 9.66 ± 0.31 a 4.80 ± 0.09 a 14.62 ± 2.22 a 5.89 ± 0.21 a 东西末梢叶 5.17 ± 0.22 b 3.87 ± 0.08 c 6.51 ± 0.75 c 5.19 ± 0.07 b 南北尖端叶 8.98 ± 0.64 a 4.41 ± 0.17 a 11.76 ± 0.23 ab 5.78 ± 0.07 a 南北末梢叶 4.40 ± 0.03 b 4.71 ± 0.02 b 9.27 ± 0.25 bc 5.08 ± 0.06 b M2 东西尖端叶 10.44 ± 0.09 bc 3.31 ± 0.01 a 20.06 ± 0.70 b 7.11 ± 0.21 a 东西末梢叶 9.77 ± 0.06 c 3.36 ± 0.03 a 14.29 ± 0.63 c 6.57 ± 0.31 a 南北尖端叶 13.68 ± 0.39 a 3.48 ± 0.01 a 22.96 ± 1.32 a 6.70 ± 0.02 a 南北末梢叶 10.81 ± 0.49 b 3.35 ± 0.20 a 13.97 ± 0.29 c 5.65 ± 0.26 b M3 东西尖端叶 3.18 ± 0.20 c 2.12 ± 0.22 b 23.06 ± 1.18 a 8.71 ± 0.40 a 东西末梢叶 1.94 ± 0.26 d 2.10 ± 0.06 b 10.44 ± 0.19 c 6.68 ± 0.13 b 南北尖端叶 8.50 ± 0.18 a 2.74 ± 0.14 a 18.03 ± 1.73 b 6.53 ± 0.07 b 南北末梢叶 4.93 ± 0.28 b 2.18 ± 0.09 b 12.08 ± 0.15 c 5.48 ± 0.09 c M4 东西尖端叶 4.54 ± 0.16 b 3.07 ± 0.08 b 20.97 ± 2.61 a 8.67 ± 0.65 a 东西末梢叶 6.48 ± 0.19 a 3.96 ± 0.09 a 13.81 ± 0.63 b 7.59 ± 0.47 a 南北尖端叶 6.84 ± 0.50 a 2.99 ± 0.14 b 12.48 ± 0.82 b 6.09 ± 0.40 b 南北末梢叶 3.46 ± 0.31 c 3.78 ± 0.40 a 5.46 ± 0.39 c 5.24 ± 0.05 b M5 东西尖端叶 7.85 ± 1.54 a 4.76 ± 0.54 b 15.03 ± 0.10 a 7.95 ± 0.03 b 东西末梢叶 5.09 ± 0.79 b 5.60 ± 0.05 a 12.50 ± 0.15 b 9.09 ± 0.05 a 南北尖端叶 7.37 ± 0.30 ab 6.04 ± 0.07 a 9.71 ± 0.32 c 3.56 ± 0.13 c 南北末梢叶 1.59 ± 0.04 c 3.08 ± 0.04 c 7.46 ± 0.35 d 3.29 ± 0.18 c
下载: 导出CSV
表 4 不同密度、冠层、方向和枝条部位对杉木光合指标和水分利用效率影响的多因素方差
Table 4. Multivariate variance of the effects of different densities, canopy layers, directions and branch positions on photosynthetic indexes and water use efficiency of C.lanceolata
因子
Factordf 净光合速率
Pn气孔导度
Gs蒸腾速率
Tr水分利用效率
WUEF P F P F P F P 密度(M) 4 196.701 <0.001** 201.671 <0.001** 344.191 <0.001** 321.605 <0.001** 冠层(G) 3 1366.650 <0.001** 1001.410 <0.001** 493.114 <0.001** 2043.925 <0.001** 方向(X) 1 35.664 <0.001** 20.724 <0.001** 35.286 <0.001** 220.393 <0.001** 枝条部位(W) 1 482.325 <0.001** 346.671 <0.001** 299.087 <0.001** 27.300 <0.001** M × G 12 33.263 <0.001** 89.177 <0.001** 75.609 <0.001** 198.737 <0.001** M × X 4 32.231 <0.001** 26.711 <0.001** 39.416 <0.001** 51.716 <0.001** M × W 4 9.528 <0.001** 16.579 <0.001** 41.586 <0.001** 72.122 <0.001** G × X 3 25.111 <0.001** 11.672 <0.001** 18.251 <0.001** 56.980 <0.001** G × W 3 50.343 <0.001** 96.328 <0.001** 37.262 <0.001** 9.936 <0.001** X × W 1 3.314 0.069 1.349 0.246 2.794 0.095 2.710 0.100 M × G × X 12 10.936 <0.001** 31.948 <0.001** 25.587 <0.001** 25.184 <0.001** M × G × W 12 7.958 <0.001** 16.060 <0.001** 12.575 <0.001** 30.181 <0.001** M × X × W 4 11.854 <0.001** 13.125 <0.001** 20.412 <0.001** 12.820 <0.001** G × X × W 3 14.181 <0.001** 42.600 <0.001** 67.654 <0.001** 3.425 0.017* M × G × X × W 12 3.254 <0.001** 8.817 <0.001** 9.883 <0.001** 4.852 <0.001** 注/Notes:*,P<0.05;**,P<0.01
下载: 导出CSV
-
[1] 刘 静, 赵铭臻, 王利艳, 等. 间伐保留密度和套种对杉木中龄林材种结构的影响[J]. 森林与环境学报, 2021, 41(6):593-600. [2] 潘尚慧. 杉木不同造林密度林分生长效应探讨[J]. 农家科技, 2019(2):106-107. [3] 苏迎光. 造林密度对林木生长的影响分析[J]. 科技创新与应用, 2014(12):260. [4] 白东雪, 刘 强, 董利虎, 等. 长白落叶松人工林有效冠高的确定及其影响因子[J]. 北京林业大学学报, 2019, 41(5):76-87. [5] 赵辉. 燕山山地华北落叶松人工林修枝高度研究[D]. 保定: 河北农业大学, 2019. [6] GRANADO YELA C, GARCÍA VERDUGO C, CARRILLO K, et al. Temporal matching among diurnal photosynthetic patterns within the crown of the evergreen sclerophyll Olea europaea L.[J]. Plant, Cell & Environment, 2011, 34(5): 800-810. [7] 马永春, 方升佐. 欧美杨107不同冠层光合特性的研究[J]. 南京林业大学学报(自然科学版), 2011, 35(4):39-42. [8] YOSHIMURA K. Irradiance heterogeneity within crown affects photosynthetic capacity and nitrogen distribution of leaves in Cedrela sinensis[J]. Plant, Cell & Environment, 2010, 33(5): 750-758. [9] 郝 建, 潘丽琴, 潘启龙, 等. 格木人工林不同冠层光合特征[J]. 浙江农林大学学报, 2017, 34(5):871-877. [10] 孟 陈, 徐明策, 李俊祥, 等. 栲树冠层光合生理特性的空间异质性[J]. 应用生态学报, 2007,18(9):1932-1936. [11] 田小琴, 韦小丽. 不同密度和修枝强度对猴樟人工林冠层特性的影响[J]. 浙江林业科技, 2016, 36(1):6-9. [12] 王立冬, 陈艳艳, 汤行昊, 等. 3种珍贵树种幼苗光合特性及日进程研究[J]. 山地农业生物学报, 2022, 41(4):8-17. [13] BALDOCCHI D, COLLINEAU S. The physical nature of solar radiation in heterogeneous canopies: spatial and temporal attributes[J]. Exploitation of Environmental Heterogeneity by Plants: Ecophysiological Processes Above‐and Belowground, 1994: 21-71. [14] 江上喜. 造林密度对6年生杉木幼林生长及林下光环境的影响[J]. 亚热带农业研究, 2022, 18(4):223-228. [15] 谢建文. 不同造林密度下杉木人工林的生物量与分配特征[J]. 亚热带农业研究, 2020, 16(2):84-88. [16] 郑 元, 赵 忠, 周 慧, 等. 刺槐树冠光合作用的空间异质性[J]. 生态学报, 2010, 30(23):6399-6408. [17] 骆 丹, 王春胜, 曾 杰. 西南桦幼林冠层光合特征及其对造林密度的响应[J]. 中南林业科技大学学报, 2202, 40(4):44-49,139. [18] 李 勇, 韩海荣, 康峰峰, 等. 油松人工林冠层光合生理特性的空间异质性[J]. 东北林业大学学报, 2013, 41(4):32-35. [19] 刘 强, 董利虎, 李凤日, 等. 长白落叶松冠层光合作用的空间异质性[J]. 应用生态学报, 2016, 27(9):2789-2796. [20] 赵连春, 赵成章, 陈 静, 等. 秦王川湿地不同密度柽柳枝-叶性状及其光合特性[J]. 生态学报, 2018, 38(5):1722-1730. [21] 杨月吉, 杨新烟. 不同造林密度对杉木生长的影响分析[J]. 农村科学实验, 2022(12):141-143. [22] HUANG Z, LIU Q, AN B, et al. Effects of planting density on morphological and photosynthetic characteristics of leaves in different positions on Cunninghamia lanceolata saplings[J]. Forests, 2021, 12(7): 853. doi: 10.3390/f12070853 [23] 肖文发, 徐德应, 刘世荣, 等. 杉木人工林针叶光合与蒸腾作用的时空特征[J]. 林业科学, 2002(5):38-46. [24] 张小全, 徐德应. 杉木中龄林不同部位和叶龄针叶光合特性的日变化和季节变化[J]. 林业科学, 2000(3):19-26. [25] 张小全, 徐德应. 18年生杉木不同部位和叶龄针叶光响应研究[J]. 生态学报, 2001(3):409-414. [26] AMTHOR J S. Scaling CO2-photosynthesis relationships from the leaf to the canopy[J]. Photosynthesis Research, 1994, 39(3): 321-350. doi: 10.1007/BF00014590 [27] CALDWELL M M, MEISTER H P, TENHUNEN J D, et al. Canopy structure, light microclimate and leaf gas exchange of Quercus coccifera L. in a Portuguese macchia: measurements in different canopy layers and simulations with a canopy model[J]. Trees, 1986, 1(1): 25-41. [28] HAN Q, CHIBA Y. Leaf photosynthetic responses and related nitrogen changes associated with crown reclosure after thinning in a young Chamaecyparis obtusa stand[J]. Journal of Forest Research, 2009, 14(6): 349-357. doi: 10.1007/s10310-009-0146-4 [29] 裴保华, 蒋湘宁, 郑均宝, 等. 林分密度对Ⅰ-69杨树冠结构和光能分布的影响[J]. 林业科学研究, 1990((3):201-206. [30] 王军邦, 张秀娟, 韩海荣, 等. 亚热带常绿人工针叶林冠层内光能利用率[J]. 生态学杂志, 2010, 29(4):611-616. [31] 张小全, 徐德应, 赵茂盛, 等. CO2增长对杉木中龄林针叶光合生理生态的影响[J]. 生态学报, 2000, 20(3):390-396. [32] 刘遵春, 包东娥. ‘金光杏梅’叶片净光合速率与生理生态因子的关系[J]. 西北植物学报, 2008(03):564-568. [33] 郭继善. 利用14CO2研究杉木的光合特性[J]. 南京林业大学学报(自然科学版), 1992(04):87-89. -

 点击查看大图

计量
- 文章访问数: 1637
- HTML全文浏览量: 1165
- PDF下载量: 63
- 被引次数: 0
