

-
树高胸径关系是森林资源调查中最基本也是最重要的关系之一[4],树高胸径方程用于反映树高随胸径的变化规律,常用于预测树高并与削度方程、蓄积方程和生物量方程等结合使用[1],并镶嵌于林分模拟和林木个体收获和预估模型中[2]。描述林分垂直结构和预测未来林分发展需要准确的树高[5],为了准确的预测树高,常在树高胸径曲线中加入林龄、立地指数、林分平均优势高和林分密度等因子[3]。
树高胸径模型形式可大致分为简单模型[6-9]和广义模型[10-12],简单模型只与胸径有关,广义模型除了胸径外还包含其他因子[13]。从模型拟合方法看,除了最小二乘法,混合效应模型[14-17]、广义可加模型[18-19]、分位数回归模型[20]也开始应用于树高胸径关系模拟。目前,对树高胸径的研究主要还是集中于纯林,而对于混交林的树高曲线拟合较少。
现阶段对于树高胸径曲线的拟合,大多从全林分的角度入手,纯林测量各个径阶若干株林木的树高,绘制全林分树高曲线,混交林分树种测量树高绘制树高曲线,这在林分结构相对简单的林分可以得出较好的结果。通常情况下,分树种研究树高胸径关系是一种可以获得较高精度的方法,但是中亚热带天然阔叶林的树种较多、较杂,林龄跨度大,很难分树种测量统计各个树种每个径阶的树高来绘制树高曲线,树高胸径的关系远比同龄纯林、异龄纯林或单层林来的复杂,在林业实践调查中,常只测量每个径阶内的几株林木来拟合全林分树高胸径,如果相同径阶内树高变化范围较大,选择较少的林木很难以代表整个径阶,这将导致径阶平均高与现实差距较大,从而导致全林分树高胸径关系与现实严重不符。量化计算天然阔叶林林分材积和生物量的林分生长、收获预估的预测和碳估计都严重依赖树高胸径关系[15]。天然阔叶林中的林木个体树高胸径关系通常因为林分中林木空间分布方式和相对位置关系而变得复杂[19]。分层是天然阔叶林的林分结构的主要特征,分林层研究复层林树高胸径的文献较少,本文在划分林层的基础上,探讨天然阔叶林树高胸径关系,从林层角度研究树高曲线可以为揭示复层林林分特征提供帮助。
-
按以下标准选择典型中亚热带天然阔叶林为试验林分:(1)达到地带性顶级群落;(2)基本未经过人为干扰;(3)基本符合中亚热带天然阔叶林理想结构的标准;(4)群落类型多样且相对集中[21]。按以上标准要求、在全面踏查基础上选择建瓯万木林省级自然保护区内5个典型林分为试验林分。
-
建瓯万木林省级自然保护区是1957年林业部根据人大代表的提议划定的全国首批19个天然森林禁伐区、是我国最早的自然保护区之一;经过持续600多年封禁保护[22],已经自然演替成为最为典型的中亚热带森林生态系统(常绿阔叶林);保护区位于闽北建瓯市境内,地理坐标为:118°08′22″~118°09′23″ E,27°02′28″~27°03′32″ N,属武夷山南坡低山丘陵,海拔230~556 m;中生代燕山运动侵入的花岗岩为主要成土母岩,红壤,立地类型以Ⅱ类地为主;保护区属中亚热带海洋性季风气候,热量丰富、降水充沛、季风显著、四季分明;年平均气温18.7℃,1月份平均气温13.8℃,极端最低气温-5.9℃,7月份平均气温28.3℃,极端最高气温40.7℃;年平均降水量1 700 mm,6月最多,雨日年平均166 d。保护区主要有壳斗科(Fagaceae)、樟科(Lauraceae)、山茶科(Theaceae)、木兰科(Magnoliaceae)、金缕梅科(Hamamelidaceae)和杜英科(Elaeocarpaceae)等常绿阔叶树种,并有珍稀树种观光木(Tsoongiodendron odorum Chun)、乐东拟单性木兰(Parakmeria lotungensis (Chun et C. Tsoong) Law)、沉水樟(Cinnamomum micranthum (Hay.) Hay)、闽楠(Phoebe bournei (Hemsl.) Yang)、红豆树(Ormosia hosiei Hemsl. et Wils)、蓝果树(Nyssa sinensis Oliv.)等[23]。
-
经全面踏查,在建瓯万木林省级自然保护区内较平坦的地段中选择最典型的中亚热带天然阔叶林作为试验林分,共设置5块50 m×50 m的样地。对样地内胸径≥5.0 cm的林木进行定位并调查林木的树种、胸径、树高和林层归属等因子。
表 1 各样地基本数据和亚层下限值
Table 1. Basis data and storey limited value of plots
样地号
Plot群落类型
Community type株数
Stems/(n·hm-2)蓄积
Volume/(m3·hm-2)林分平均胸径Mean DBH/cm 平均高
Mean Height/m亚层下限值
Stratum limited value物种丰富度
Species richnessS-W多样性指数
S-W index第Ⅰ亚层stratumⅠ 第Ⅱ亚层stratumⅡ 1 A 1 164 481.73 20.9 26.81 25 17 36 3.82 2 B 952 591.5 25.7 27.88 27 16.5 50 4.56 3 C 1 076 435.4 22.0 23.92 25 17 49 4.83 4 D 1 056 493.31 23.4 24.33 22.9 17 45 4.51 5 E 1 056 442.97 21.9 24.24 25 16 45 4.47 注:类型A表示木荷+光叶山矾, Schima superba Gardn. et Champ.+Symplocos lancifolia Sieb. et Zucc.;类型B表示猴欢喜+木荷, Sloanea sinensis(Hance) Hemsl+Schima superba Gardn. et Champ.;类型C表示木荷+新木姜子, Schima superba Gardn. et Champ.+Neolitsea aurata(Hay.) Koidz.;类型D表示木荷+浙江桂, Schima superba Gardn. et Champ.+Cinnamomum chekiangense Nakai;类型E表示浙江桂+木荷, Cinnamomum chekiangense Nakai+Schima superba Gardn. et Champ.。
Note:A means Schima superba Gardn. et Champ.+Symplocos lancifolia Sieb. et Zucc.; B means Sloanea sinensis(Hance) Hemsl+Schima superba Gardn. et Champ.; C means Schima superba Gardn. et Champ.+Neolitsea aurata(Hay.) Koidz.; D means Schima superba Gardn. et Champ.+Cinnamomum chekiangense Nakai; E means Cinnamomum chekiangense Nakai+Schima superba Gardn. et Champ. -
研究方法包括划分林层的最大受光面法(Maximum Light Receiving Plane,MLRP),树高曲线拟合方程的Schumacher式和Curtis式,以及模型评价指标剩余离差平方和(RMSE)、决定系数(R2)和平均绝对误差(AMR)等。
-
采用最大受光面法(MLRP)进行典型中亚热带天然阔叶林[24-26]林层划分,确定林分所有林木所属林层,在此基础上进行相关的林层特征分析。最大受光面法指依据林木树冠是否能接受到光照和是否明显突出进行典型中亚热带天然阔叶林的林层划分方法,首先依据典型林分的林木树冠(林隙内的林木树冠除外)是否能接受到光照将典型林分的所有林木树冠划分为受光层(所有能接受到光照的林木树冠组成的一个层次,包括第Ⅰ和第Ⅱ亚层两个亚层)和非受光层(所有不能接受到光照的林木树冠组成的一个层次,只包含第Ⅲ亚层),其次在受光层中再依据其林木树冠是否明显突出划分为林木树冠明显突出的受光层(第Ⅰ亚层)和林木树冠不明显突出的受光层(第Ⅱ亚层)。由于受光层与非受光层之间的交界面正好就是其高度以上所有能接受到光照的林木树冠的垂直投影面积(受光面积)最大的水平截面(简称最大受光面),将这种方法称为最大受光面法。
-
Curtis研究指出,常规的树高胸径模型拟合得出的结果基本一致[27],故选择两种常规的非线性模型对各林层(包括全林分和各亚层)树高胸径进行拟合。方程如下:
$H=1.3+a e^{(-b / D)} $
(1) $H=1.3+\exp \left(a+b D^{c}\right) $
(2) (1) 式为Schumacher式,具有形式简单,数学解析性能良好,可以线性化的特点,广泛应用于树高胸径曲线的拟合[28]。(2)式是为Curtis 1967年提出的树高曲线方程,本文简称Curtis式。
-
剩余离差平方和(RMSE):
$ R M S E=\sqrt{\sum\limits_{i=1}^{n} \frac{\left(\hat{h}_{i}-h_{i}\right)^{2}}{n-k}} $
(3) 决定系数(R2):
$ R^{2}=1-\frac{\sum\limits_{i=1}^{n}\left(h_{i}-\hat{h}_{i}\right)^{2}}{\sum\limits_{i=1}^{n}\left(h_{i}-\bar{h}_{i}\right)^{2}} $
(4) 平均绝对误差(AMR):
$ A M R=\sum\limits_{i=1}^{n}\left|\frac{h_{i}-\hat{h}_{i}}{n}\right| $
(5) 式中:$ \hat{h}_{i} $表示高度模型估计值,hi表示高度实测值,k表示模型参数数量,hi表示树高实测均值,n表示林木株数。选择RMSE、AMR较小,R2较高的模型作为最终模型。
-
采用式(1)和式(2)拟合1~5号样地的树高胸径,具体参数值和评价指标结果如表 2所示。
表 2 各方程参数结果和评价指标
Table 2. Parameters and evaluation indicators of models
标准地号
Sample plot层属
StrataSchumacher式Schumacher model Curtis式Curtis model 参数Parameters 评价指标Evaluation indicators 参数Parameters 评价指标Evaluation indicators a b R2 RMSE AMR a b c R2 RMSE AMR 1 S 36.755 12.380 0.882 1 2.839 3 2.209 5 4.066 -6.616 -0.587 0.895 2.655 2 1.974 0 Ⅰ 33.704 5.880 0.268 1 2.511 2 1.952 3 3.189 0.005 0.939 0.292 6 2.468 8 1.876 3 Ⅱ 23.331 4.314 0.262 4 1.775 1 1.478 5 3.760 -1.768 -0.252 0.267 3 1.769 1 1.466 0 Ⅲ 20.045 6.984 0.594 1 1.930 5 1.538 4 3.215 -5.548 -0.779 0.594 9 1.928 6 1.537 1 2 S 33.472 12.894 0.827 3 3.341 2.600 3 4.803 -5.427 -0.325 0.878 4 2.751 5 2.090 6 Ⅰ 37.566 10.243 0.302 2 3.301 4 2.659 9 3.612 -13.230 -1.086 0.302 3 3.301 1 2.661 5 Ⅱ 22.241 3.772 0.222 1 1.783 4 1.466 3 3.439 -1.267 -0.293 0.229 1 1.775 3 1.466 3 Ⅲ 17.850 6.458 0.613 4 1.953 9 1.569 4 2.948 -5.747 -0.904 0.613 6 1.953 2 1.564 5 3 S 29.693 10.547 0.841 2.755 7 2.069 9 4.317 -5.021 -0.395 0.871 7 2.456 7 1.857 8 Ⅰ 33.154 8.372 0.240 4 2.661 5 2.162 1 2.816 0.108 0.395 0.263 6 2.620 4 2.096 2 Ⅱ 22.241 3.772 0.222 1 1.7834 1.466 3 3.439 -1.267 -0.293 0.229 1 1.775 3 1.466 3 Ⅲ 19.146 6.565 0.680 8 1.792 7 1.442 6 2.883 -7.666 -1.120 0.681 3 1.791 4 1.443 2 4 S 30.754 10.814 0.846 9 2.948 2 2.219 1 3.887 -5.731 -0.561 0.861 5 2.791 4 2.037 2 Ⅰ 30.368 6.667 0.309 9 2.292 9 1.837 4 2.759 0.122 0.367 0.330 3 2.258 7 1.806 3 Ⅱ 17.953 0.345 0.007 3 1.359 2 1.206 9 2.603 0.218 0.066 0.009 5 1.357 7 1.199 1 Ⅲ 18.209 6.409 0.648 7 1.820 9 1.374 9 2.892 -6.551 -1.017 0.648 7 1.820 9 1.374 7 5 S 32.312 11.381 0.865 4 2.754 2.112 8 3.990 -5.922 -0.547 0.882 9 2.549 5 1.947 1 Ⅰ 35.303 9.983 0.299 6 2.958 2 2.130 1 3.227 0.000 1.901 0.344 2.863 2.208 3 Ⅱ 24.662 5.910 0.502 2 1.667 9 1.420 7 3.127 -22.401 -1.555 0.515 1 1.646 1 1.423 6 Ⅲ 19.170 6.821 0.589 1 1.947 9 1.591 2.871 -8.003 -1.130 0.589 4 1.947 1 1.593 7 注:S表示全林分;Ⅰ表示第Ⅰ亚层;Ⅱ表示第Ⅱ亚层;Ⅲ表示第Ⅲ亚层。
Note:S means stand,Ⅰmeans stratum Ⅰ,Ⅱmeans stratumⅡ,Ⅲmeans stratumⅢ从表 2中可以看出,Schumacher式可以很好的拟合全林分树高胸径之间的关系,R2都在0.82以上,对第Ⅲ亚层的拟合效果也还不错,R2在0.58~0.68之间。但对于第Ⅰ亚层和第Ⅱ亚层,Schumacher式的拟合效果较差,第Ⅰ亚层R2最高的是4号样地的0.309 9,最低的是3号样地的0.240 4;第Ⅱ亚层R2最高的是5号样地的为0.502 2,其余样地均低于0.35,4号样地的R2只有0.007 3。
Curtis式同样可以较好的拟合样地全林分的树高胸径关系,其R2达到0.86以上,拟合第Ⅲ亚层时R2也在0.58以上。与Schumacher式一样,Curtis式在拟合第Ⅰ亚层和第Ⅱ亚层时效果较差,第Ⅰ亚层拟合效果最好的是5号样地的0.334 0,最差的是3号样地的0.263 6;第Ⅱ亚层拟合效果最好的同样也是5号样地的0.515 1,最差的是4号样地的0.009 5。
对比Schumacher式、Curtis式的拟合结果,发现Curtis式在拟合全林分和第Ⅲ亚层的R2较高,RMSE和AMR较小,故选择Curtis作为1~5号样地的树高胸径曲线。如图 1所示。
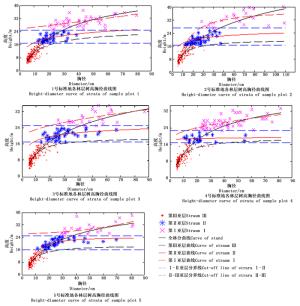
图 1 15号样地各林层树高曲线图
Figure 1. Height-diameter curve of strata of plot 15
在中亚热带天然阔叶林中,林分内树高胸径关系往往因为林龄和树种的差异而显得较为复杂和没有规律,最高的林木胸径往往不是最大,且有可能与最大胸径相差30 cm以上;同一树高的林木径阶相差较大,可能处于40径阶,也可能处于80径阶;同一径阶内的林木树高相差也较大,30径阶的林木可能是14 m,也可能是28 m。由于林分结构复杂,中亚热带天然阔叶林通常具有多样的生物学特性和生态学特性,其过于离散的树高和胸径关系在拟合树高曲线时可能会造成极大困扰。
从图 1中可以看出,尽管全林分树高胸径有较高的相关关系,但随着胸径的增大,树高趋于分散,树高胸径关系会产生较大的变化。同一样地内不同林层的树高胸径曲线之间的差异较大,各亚层树高胸径曲线并不重合,说明不同亚层内树高胸径关系存在差异。虽然全林分树高曲线拟合全林分树高产生的AMR值不大,但采用全林分树高胸径曲线单独估算各亚层内林木树高可能会产生较大误差,采用全林分树高曲线估计各亚层树高时各亚层树高AMR如表 3所示。
表 3 全林分树高曲线时各林层平均误差绝对值(AMR)
Table 3. Strata AMR of stand height-diameter model
样地号
Plot全林分
Stand第Ⅰ亚层
Stratum Ⅰ第Ⅱ亚层
Stratum Ⅱ第Ⅲ亚层
Stratum Ⅲ1 1.974 3.072 2.207 1.673 2 2.091 4.258 2.260 1.725 3 1.565 3.366 2.658 1.515 4 2.037 2.841 3.182 1.673 5 1.947 3.190 2.257 1.690 从表 3中可以看出,采用全林分树高模型估算第Ⅰ亚层和第Ⅱ亚层的树高时,其AMR都有所增加,说明采用全林分树高模型估算各亚层内树高的误差在增大。第Ⅲ亚层的AMR虽然有所下降,但还是大于表 2中各样地第Ⅲ亚层树高模型的AMR。尽管表 2中第Ⅰ亚层和第Ⅱ亚层树高曲线模型的R2较低,但其AMR小于采用全林分树高模型估计的第Ⅰ亚层和第Ⅱ亚层的AMR,从模型变量的角度看,即使是各亚层单独拟合的效果也都不是很理想(无论是Schumacher式、Curtis式的R2都不是很理想,无法很好的解释变量),分亚层拟合树高模型的误差都比采用全林分树高胸径模型估计各亚层的树高会产生的误差小。
-
在现实调查中,我们常采用全林分树高曲线估计林分内各林木的树高,这在纯林或结构相对简单的林分中可以取得较好的效果。而在天然异龄林中,林分内林龄和树种差异较大,具有较为多样的生物学和生态学特性,林分内林木的生长情况呈现出多样化现象,导致树高曲线拟合难度的增大。由于树高胸径关系的复杂性,如果在实践中采取径阶平均高来绘制树高曲线,往往会因为在某一径阶内选择的树高无法代表该径阶的真实平均高而导致树高曲线误差的增大,导致无法准确反映林分的基本情况。
在天然阔叶林中,树高胸径生长不匹配的林木往往是揭示林分结构的关键,如在第Ⅲ亚层中的林木具有较大胸径,说明该种林木可能是被压木;在第Ⅱ亚层中,如果胸径很小,说明该林木可能处在林窗中,也可能是林木本身选择“先抽高,再长壮”的生物学特征;而第Ⅰ亚层中的林木,由于其生长不受抑制,处于优势地位,如果有相对异常的情况(如胸径较小的情况),将在很大程度上表明物种的特性。因此,这些生长“异常”的林木在研究时很难被当做异常点剔除。分析表明,即使第Ⅰ、Ⅱ亚层树高曲线模型拟合的R2较低,其模型估算各亚层内树高的AMR也小于全林分树高模型,这表明在天然阔叶林中分亚层研究树高是有必要的。
为了验证数据量对本研究的影响,本次研究中曾尝试将位置较近的2、3号样地和4、5号样地合并成为新的23号和45号样地,合并后各亚层树高胸径的散点图还是比较离散,采用Curtis式拟合时第Ⅰ、Ⅱ亚层R2有小幅度的提升,在0.34左右(合并前在0.2~0.3之间),全林分树高胸径模型估计上层林木树高时误差还是比较大,这与原样地得出的结果相似。
无论哪种模型对4号样地的第Ⅱ亚层的拟合效果都很差,通过对散点图的分析发现,4号样地的第Ⅱ亚层树高随胸径的变化规律性不强,其出现了较小胸径却有较高树高、较大胸径却有较低树高的情况。在天然异龄林中,不同树种间树高胸径关系具有较大的差异。
-
本研究在划分林层的基础上对中亚热带天然阔叶林典型林分的树高胸径关系进行研究,表明在天然异龄林各林层中,采用常规模型拟合全林分树高胸径关系和第Ⅲ亚层树高胸径关系可以得到较高的R2。但对于第Ⅰ、Ⅱ亚层树高胸径关系,无论是S式还是C式拟合的效果都不是很好,具体表现为R2较低。模型表现差异说明随着林层高度的升高,树高胸径关系变得相对离散,各亚层树高胸径间的关系有较大差异。采用全林分树高模型拟合各亚层树高,结果表明其所产生的AMR要大于采用各亚层的树高胸径模型。在典型中亚热带天然阔叶林中,无论是全林树高模型还是分林层树高模型,C式的适应性均比S式高。选择C式全林分树高模型估计各亚层树高产生的误差比各亚层采用各自的C式树高模型拟合的误差大,说明在复杂的天然异龄复层林中分林层研究树高曲线是有必要的。
典型中亚热带天然阔叶林各林层树高胸径关系研究
Study on Height-diameter Relationship in Each Stratum of Typical Natural Broadleaved Forests in Mid-subtropics
-
摘要:
目的 在划分林层的基础上,探讨天然阔叶林树高胸径关系,从林层角度研究树高曲线以揭示复层林林分特征。 方法 根据典型中亚热带天然阔叶林各林层数据情况选择Schumacher式(简称S式),Curtis式(简称C式)对典型林分各林层树高胸径关系进行拟合。 结果 S式和C式在拟合全林分和第Ⅲ亚层的效果较好,全林分树高模型的R2均在0.86以上,第Ⅲ亚层的R2均在0.58以上,且RMSE和AMR均较小,但无论是S式还是C式都不能很好的拟合第Ⅰ、Ⅱ亚层,其拟合R2的结果较低,大都在0.2~0.3左右。选取模型拟合结果R2较大,RMSE、AMR较小的C式拟合各林层树高胸径模型,结果表明采用全林分模型推算各亚层(不包括全林分)的树高会产生较大的AMR;虽然分层拟合各亚层树高胸径时获得的模型的R2较小,但其估计相应层内树高产生的AMR值却小于全林分模型,表明采用亚层树高胸径模型估计相应层内林木树高时具有较小的误差。 结论 在典型中亚热带天然阔叶林中,无论是全林树高模型还是分林层树高模型,C式的适应性均比S式高。选择C式全林分树高模型估计各亚层树高产生的误差比各亚层采用各自的C式树高模型拟合的误差大。 Abstract:Objective To investigate the height-diameter relationship in strata (including the whole stand and every stratum) of typical natural broad-leaved forests in mid-subtropics. Method The Schumacher (S) model and Curtis (C) model were chosen to fit the height-diameter relationship in strata of all plots based on the data of typical natural broad-leaved forest in mid-subtropics. Result The results showed that both the S model and C model could fit the whole stand (R2>0.86) and stratum Ⅲ(R2>0.58) well, and the RMSE and AMR were small. But both the S model and C model could not fit the stratum Ⅰ and Ⅱ well, the R2 were small, almost stayed and their values were between 0.2 and 0.3. Because of the bigger R2, smaller RMSE and ARM, the C model was selected to compare the height-diameter relations in each stratum, and the bigger AMR would be brought when using the whole stand height-diameter model to estimate the height in each stratum (except the whole stand); although the R2 of the height-diameter model in stratification was small, the AMR of them were smaller than the model of the whole stand, indicating that the error was smaller when using height-diameter model of stratification to estimate the height in appropriate stratum. Conclusion It is proved that the research on height-diameter relationship in of forest in strata is both necessary and significant. -
表 1 各样地基本数据和亚层下限值
Table 1. Basis data and storey limited value of plots
样地号
Plot群落类型
Community type株数
Stems/(n·hm-2)蓄积
Volume/(m3·hm-2)林分平均胸径Mean DBH/cm 平均高
Mean Height/m亚层下限值
Stratum limited value物种丰富度
Species richnessS-W多样性指数
S-W index第Ⅰ亚层stratumⅠ 第Ⅱ亚层stratumⅡ 1 A 1 164 481.73 20.9 26.81 25 17 36 3.82 2 B 952 591.5 25.7 27.88 27 16.5 50 4.56 3 C 1 076 435.4 22.0 23.92 25 17 49 4.83 4 D 1 056 493.31 23.4 24.33 22.9 17 45 4.51 5 E 1 056 442.97 21.9 24.24 25 16 45 4.47 注:类型A表示木荷+光叶山矾, Schima superba Gardn. et Champ.+Symplocos lancifolia Sieb. et Zucc.;类型B表示猴欢喜+木荷, Sloanea sinensis(Hance) Hemsl+Schima superba Gardn. et Champ.;类型C表示木荷+新木姜子, Schima superba Gardn. et Champ.+Neolitsea aurata(Hay.) Koidz.;类型D表示木荷+浙江桂, Schima superba Gardn. et Champ.+Cinnamomum chekiangense Nakai;类型E表示浙江桂+木荷, Cinnamomum chekiangense Nakai+Schima superba Gardn. et Champ.。
Note:A means Schima superba Gardn. et Champ.+Symplocos lancifolia Sieb. et Zucc.; B means Sloanea sinensis(Hance) Hemsl+Schima superba Gardn. et Champ.; C means Schima superba Gardn. et Champ.+Neolitsea aurata(Hay.) Koidz.; D means Schima superba Gardn. et Champ.+Cinnamomum chekiangense Nakai; E means Cinnamomum chekiangense Nakai+Schima superba Gardn. et Champ. 下载: 导出CSV
表 2 各方程参数结果和评价指标
Table 2. Parameters and evaluation indicators of models
标准地号
Sample plot层属
StrataSchumacher式Schumacher model Curtis式Curtis model 参数Parameters 评价指标Evaluation indicators 参数Parameters 评价指标Evaluation indicators a b R2 RMSE AMR a b c R2 RMSE AMR 1 S 36.755 12.380 0.882 1 2.839 3 2.209 5 4.066 -6.616 -0.587 0.895 2.655 2 1.974 0 Ⅰ 33.704 5.880 0.268 1 2.511 2 1.952 3 3.189 0.005 0.939 0.292 6 2.468 8 1.876 3 Ⅱ 23.331 4.314 0.262 4 1.775 1 1.478 5 3.760 -1.768 -0.252 0.267 3 1.769 1 1.466 0 Ⅲ 20.045 6.984 0.594 1 1.930 5 1.538 4 3.215 -5.548 -0.779 0.594 9 1.928 6 1.537 1 2 S 33.472 12.894 0.827 3 3.341 2.600 3 4.803 -5.427 -0.325 0.878 4 2.751 5 2.090 6 Ⅰ 37.566 10.243 0.302 2 3.301 4 2.659 9 3.612 -13.230 -1.086 0.302 3 3.301 1 2.661 5 Ⅱ 22.241 3.772 0.222 1 1.783 4 1.466 3 3.439 -1.267 -0.293 0.229 1 1.775 3 1.466 3 Ⅲ 17.850 6.458 0.613 4 1.953 9 1.569 4 2.948 -5.747 -0.904 0.613 6 1.953 2 1.564 5 3 S 29.693 10.547 0.841 2.755 7 2.069 9 4.317 -5.021 -0.395 0.871 7 2.456 7 1.857 8 Ⅰ 33.154 8.372 0.240 4 2.661 5 2.162 1 2.816 0.108 0.395 0.263 6 2.620 4 2.096 2 Ⅱ 22.241 3.772 0.222 1 1.7834 1.466 3 3.439 -1.267 -0.293 0.229 1 1.775 3 1.466 3 Ⅲ 19.146 6.565 0.680 8 1.792 7 1.442 6 2.883 -7.666 -1.120 0.681 3 1.791 4 1.443 2 4 S 30.754 10.814 0.846 9 2.948 2 2.219 1 3.887 -5.731 -0.561 0.861 5 2.791 4 2.037 2 Ⅰ 30.368 6.667 0.309 9 2.292 9 1.837 4 2.759 0.122 0.367 0.330 3 2.258 7 1.806 3 Ⅱ 17.953 0.345 0.007 3 1.359 2 1.206 9 2.603 0.218 0.066 0.009 5 1.357 7 1.199 1 Ⅲ 18.209 6.409 0.648 7 1.820 9 1.374 9 2.892 -6.551 -1.017 0.648 7 1.820 9 1.374 7 5 S 32.312 11.381 0.865 4 2.754 2.112 8 3.990 -5.922 -0.547 0.882 9 2.549 5 1.947 1 Ⅰ 35.303 9.983 0.299 6 2.958 2 2.130 1 3.227 0.000 1.901 0.344 2.863 2.208 3 Ⅱ 24.662 5.910 0.502 2 1.667 9 1.420 7 3.127 -22.401 -1.555 0.515 1 1.646 1 1.423 6 Ⅲ 19.170 6.821 0.589 1 1.947 9 1.591 2.871 -8.003 -1.130 0.589 4 1.947 1 1.593 7 注:S表示全林分;Ⅰ表示第Ⅰ亚层;Ⅱ表示第Ⅱ亚层;Ⅲ表示第Ⅲ亚层。
Note:S means stand,Ⅰmeans stratum Ⅰ,Ⅱmeans stratumⅡ,Ⅲmeans stratumⅢ
下载: 导出CSV
表 3 全林分树高曲线时各林层平均误差绝对值(AMR)
Table 3. Strata AMR of stand height-diameter model
样地号
Plot全林分
Stand第Ⅰ亚层
Stratum Ⅰ第Ⅱ亚层
Stratum Ⅱ第Ⅲ亚层
Stratum Ⅲ1 1.974 3.072 2.207 1.673 2 2.091 4.258 2.260 1.725 3 1.565 3.366 2.658 1.515 4 2.037 2.841 3.182 1.673 5 1.947 3.190 2.257 1.690
下载: 导出CSV
-
[1] Adamec Z, Drapela K. Generalized additive models as an alternative approach to the modeling of the tree height-diameter relationship[J]. Journal of Forest Science, 2015, 61(6): 235-243. [2] 孟宪宇. 测树学(第三版)[M]. 北京: 中国林业出版社, 2006: 65. [3] Burkhart H E, Tome M. Modelinng Forest Trees and Stands[M]. Springer, 2012. [4] Staudhammer C, LeMay V. Height prediction equations using diameter and stand density measures[J]. Journal of Forestry Chronicle, 2000, 76(2): 303-309. doi: 10.5558/tfc76303-2 [5] Krumland B E, Wensel L C. A generalized height-diameter equation fir coastal California species[J]. West Journal of Applied Forestry, 1988, 3, 113-115. doi: 10.1093/wjaf/3.4.113 [6] Meyer H A. A mathematical expression for height curves[J]. Journal of Forest, 1940, 38: 415-420. [7] Stage A R. Prediction of height increment for models of forest growth[R]. USDA For Serv Res Pap. INT-164.1975. [8] 王明亮, 李希菲. 非线性树高曲线模型的研究[J]. 林业科学研究, 2000, 13(1): 75-79. doi: 10.3321/j.issn:1001-1498.2000.01.012 [9] 卢军, 张会儒, 雷相东, 等. 长白山云冷杉针阔混交林幼树树高-胸径模型[J]. 北京林业大学学报, 2015, 37(11): 10-25. [10] Temesgen H, Gadow K v. Generalized height-diameter models-an application for major tree species in complex stands of interior British Columbia[J]. Eurpean Journal of Forest Research, 2004, 123: 45-51. doi: 10.1007/s10342-004-0020-z [11] Huang S, Wiens D P, Yang Y, et al. Assessing the impacts of species composition, top height and density on individual tree height prediction of quaking aspen in boreal mixedwoods[J]. Forest Ecology and Management, 2009, 258: 1235-1247. doi: 10.1016/j.foreco.2009.06.017 [12] 金星姬, 李凤日, 贾玮玮, 等. 树木胸径和树高二元分布的建模与预测[J]. 林业科学, 2013, 49(6): 74-82. [13] Lei X, Peng C, Wang H, et al. Individual height-diameter models for young black spruce(Picea mariana) and jack pine(Pinus banksiana) plantations in New Brunswick, Canada[J]. The Forestry Chronicle, 2009, 85(1): 43-56. doi: 10.5558/tfc85043-1 [14] Mehtatalo L. A longitudinal height-diameter model for Norway spruce in Finand[J]. Canadian Journal of Forest Research, 2004, 34: 131-140. doi: 10.1139/x03-207 [15] Temesgen H, Zhang C H, Zhao X H. Modeling tree height-diameter relationships in multi-species and multi-stratumed forests: A large observational study from Northeast China[J]. Forest Ecology and Management, 2014, 316: 78-89. doi: 10.1016/j.foreco.2013.07.035 [16] 李春明, 李利学, 基于非线性模型的栓皮栎树高与胸径关系研究[J]. 北京林业大学学报, 2009, 31(4): 7-12. doi: 10.3321/j.issn:1000-1522.2009.04.002 [17] 王冬至, 张冬燕, 张志东, 等. 基于非线性混合模型的针阔混交林树高与胸径关系[J]. 林业科学, 2016, 52(1): 30-39. doi: 10.3969/j.issn.1006-1126.2016.01.006 [18] Zhang L, Ma A, Guo L. Spatially assessing model errors of four regression techniques for three tyoes of forest stands[J]. Forestry, 2008, 81: 209-225. doi: 10.1093/forestry/cpn014 [19] Schmidt M, Kiviste A, Gadow K v. A spatially explicit height-diameter model for Scots pine in Estonia[J]. Eurpean Journal of Forest Research, 2011, 130: 303-315. doi: 10.1007/s10342-010-0434-8 [20] Rust S. Analysis of regional variation of height growth and slenderness in populations of six urban tree species using a quantile regression[J]. Urban Forestry & Urban Greening, 2014, 13: 336-343. [21] 黄清麟, 李志明, 郑群瑞. 福建中亚热带天然阔叶林理想结构探讨[J]. 山地学报, 2003, 21(1): 116-120. doi: 10.3969/j.issn.1008-2786.2003.01.019 [22] 何友钊. 建瓯县万木林保护区史事考[J]. 林史文集, 1989, 1(1): 139-140. [23] 高峻, 郑群瑞, 杨斌生, 等. 福建万木林自然保护区植被研究[J]. 上海师范大学学报: 自然科学版, 1998, 27(1): 77-82. [24] 黄清麟. 中亚热带天然阔叶林可持续经营技术研究[D]. 北京: 北京林业大学, 1998. [25] 黄清麟, 董乃钧, 李元红. 福建中亚热带天然阔叶林的主要类型与特征[J]. 山地学报, 1999, 17(4): 368-374. [26] 黄清麟, 罗发潘, 郑群瑞. 闽北天然阔叶林林层特征研究[J]. 福建林学院学报, 1995, 15(1): 17-21 [27] Curtis R O. Height-diameter and height-diameter-age equations for second-growth Douglas-fir[J]. Forest Science, 1967, 13: 365-375. [28] 王明亮, 唐守正. 标准树高曲线的研制[J]. 林业科学研究, 1997, 10(3): 259-264. doi: 10.3321/j.issn:1001-1498.1997.03.006 -

 点击查看大图

图(1) / 表(3)
计量
- 文章访问数: 4114
- HTML全文浏览量: 922
- PDF下载量: 625
- 被引次数: 0
