

-
杉木(Cunninghamia lanceolata (Lamb.) Hook.)是我国最主要用材树种之一,由于人工林普遍密度较大、树种单一、林分结构简单等原因,杉木人工林出现了地力衰退[1]和生产力下降[2]的情况。前人针对地力衰退对杉木人工林理化性质的影响进行了大量研究[3-5],而间伐对土壤生物学特征(土壤酶、土壤微生物等)的影响研究相对较少,土壤养分和土壤生物学特征共同推动土壤质量的变化[6]。
土壤酶在土壤中参与许多物质循环和生物化学过程,其活性可作为土壤生态胁迫或土壤生态恢复等早期的敏感性指标[7],用作土壤养分及养分循环的指示物[6-8],在森林生态系统的生化过程中起关键的调节作用,土壤酶活性的高低可以反映土壤养分转化的强弱[9]。土壤微生物在土壤养分转化过程和植被生态系统中发挥着重要作用,因此,一直是研究热点内容之一[10]。国内研究表明,适宜间伐强度能改善林分水热状况,提高林下植物多样性,增强土壤微生物[3, 7, 11]和酶活性[12]。前人的研究主要集中在间伐对人工林生态系统单方面影响,如间伐对人工林林下植被[13]发育、生物量[14]、生长和出材量[15]、土壤酶演变[16-17]、土壤理化性质变化[5]的影响,而对人工林间伐后土壤微生物数量和土壤酶活性之间的关系少见报道。因此,探讨间伐后土壤酶活性与土壤微生物数量之间的关系,对了解森林生态系统过程具有深远意义,为科学制定杉木人工林经营技术措施和掌握间伐对土壤微生物及酶活性的影响提供参考。
-
样地位于贵州省黔东南州榕江县定威乡龙坡(108°16′56″E,25°53′39″N),海拔535 m,坡度25°~32°,位于坡中下部,东南向,无霜期328 d,相对湿度80%,年均气温18.3℃,年均降水量1 350 mm,属亚热带季风湿润气候,是贵州杉木中心产区。林分平均胸径为(16.02±0.99) cm,平均树高(14.18±1.38) m,密度1 800株·hm-2左右,郁闭度0.95。林下主要植物有菝葜(Smilax china Linn.)、毛叶南烛(Lyonia villosa (Wall.ex C.B.Clarke) Hand.-Mazz.)、盐肤木(Rhus chinensis Mill.)、茅栗(Castanea seguinii Dode)、水竹(Phyllostachys heteroclada Oliver)、红锥(Castanopsis hystrix Miq.)、红毛悬钩子(Rubus pinfaensis Levl. et Vant.)、野漆树(Toxicodendron succedaneum (Linn.) O. Kuntze)、湘桂柿(Diospyros xiangguiensis S.Lee)、五节芒(Miscanthus floridulus (Lab.) Warb. ex Schum. et Laut.)、狗尾草(Setaria viridis(L.) Beauv.)、狗脊蕨(Woodwardia japonica (L. f.) Sm.)、山桐子(Idesia polycarpa Maxim.)、何首乌(Fallopia multiflora (Thunb.) Harald.)、乌蕨(Stenoloma chusanum Ching)、铁芒萁(Dicranopteris linearis (Burm.) Underw.)、金星蕨(Parathelypteris glanduligera (Kze.) Ching)、凤尾蕨(Pteris cretica Linn. var. nervosa (Thunb.)Ching et S.H.Wu)、红盖鳞毛蕨(Dryopteris erythrosora (Eaton) O. Ktze.)等。
-
在研究样地内,沿等高线随机区组设计4个间伐强度:TS0(未间伐(0.0%),1 800株·hm-2)、TS1(轻度间伐(16.7%),1 500株·hm-2)、TS2(中度间伐(33.3%),1 200株·hm-2)和TS3(重度间伐(50.0%),900株·hm-2),按照保留株数控制间伐强度,重复3次,每个试验小区面积为30 m×20 m。2014年8月29日至9月2日在每个试验小区内按照对角线设置5个2 m×2 m小样方,在每个小区5个小样方内挖取土壤剖面,按0~15、15~30、30~45 cm进行土壤取样1 kg,带回实验室剔除土壤中杂物并分成2份,1份自然风干后过2 mm筛,用于测定土壤酶活性,另1份测定土壤微生物数量,贮藏于4℃冰箱备用。
-
过氧化氢酶采用高锰酸钾滴定法测定,碱性磷酸酶采用pH=10的硼酸盐缓冲液比色法测定,蔗糖酶采用3, 5-二硝基水杨酸比色法测定,脲酶活性采用苯酚钠比色法测定。土壤细菌和氨化细菌采用牛肉膏蛋白胨培养基法测定,真菌采用马丁式培养基法测定,放线菌采用改良高氏Ⅰ号培养基法测定,硝化细菌采用改良的斯蒂芬森培养基法测定。
-
采用SPSS21.0软件对数据进行分析处理,单因素方差(one-way ANOVA)分析不同间伐强度下土壤酶和土壤微生物数量的显著差异性,用皮尔森(Pearson)法分析土壤酶和土壤微生物数量之间的相关性,采用origin8.6作图。
-
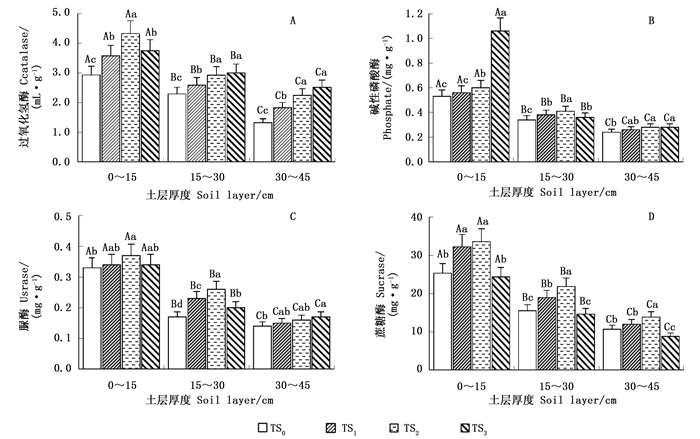
由图 1A可知:0~15 cm土层的过氧化氢酶活性最强,随土壤深度的加深,过氧化氢酶活性显著降低。0~15 cm土壤的过氧化氢酶活性随间伐强度的增加,呈先显著增强后减弱的趋势(P<0.05),TS2处理的活性最强(4.33 mL·g-1),TS1、TS2、TS3分别比TS0提高21.84%、47.78%、27.99%;15~30 cm土层,随间伐强度的增强,过氧化氢酶活性增强,处理间差异显著,但TS2与TS3差异不显著,TS1、TS2、TS3分别比TS0提高12.66%、27.51%、30.57%;30~45 cm土层,随间伐强度的增强,过氧化氢酶活性显著增强,TS1、TS2、TS3分别比TS0提高37.88%、69.70%、90.15%。

图 1 间伐对杉木人工林土壤酶活性的影响
Figure 1. Effects of soil enzymes activity with thinning on C. lanceoolata plantation
-
由图 1B可知:间伐3年后,不同间伐强度的土壤碱性磷酸酶显著高于对照(P<0.05),并随土壤深度的增加,土壤碱性磷酸酶显著降低,但各处理在3个土层的变化特点并不相同。0~15 cm土层,随间伐强度的增加,碱性磷酸酶活性显著增加,TS1、TS2、TS3分别比TS0提高5.66%、13.21%、100%;15~30 cm土层,碱性磷酸酶活性呈先增加后减弱的变化趋势,且TS1、TS2、TS3比TS0 分别提高5.88%、20.59%、11.76%;30~45 cm土层,间伐后碱性磷酸酶活性得到提高,TS1比TS0提高12.5%,TS2、TS3与TS0相比增加的幅度相同,均为16.67%,且TS2、TS3二种间伐强度与对照TS0 差异显著(P<0.05)。
-
由图 1C可知:间伐对土壤脲酶活性产生了一定的影响,随土层加深其活性显著降低。0~15、15~30 cm土层随间伐强度的增大,呈先增强后减弱的趋势,均以TS2处理的活性最强;0~15 cm土层,TS1、TS2、TS3分别比TS0 提高3.85%、12.50%、3.85%,且TS0与TS2差异显著;15~30 cm土层,TS1、TS2、TS3分别比TS0 提高15.13%、32.03%、3.89%;30~45 cm土层的TS1、TS2、TS3分别比TS0 提高6.72%、20.33%、21.74%,且TS0与TS3差异显著(P<0.05)。
-
由图 1D可知:蔗糖酶随土层的加深显著降低;随间伐强度的增大,不同土层均呈先增强后减弱的趋势,均以TS2处理的活性最强。0~15 cm土层,T S1、TS2、TS3分别比TS0 提高27.19%、32.48%、-3.87%,且TS1、TS2与TS0、TS3差异显著;15~30 cm土层,TS1、TS2、TS3分别比TS0 提高22.04%、40.85%、-5.73%;30~45 cm土层,TS1、TS2、TS3分别比TS0 提高12.49%、30.14%、-17.28%;15~30、30~45 cm土层的TS2与其他3种间伐强度均差异显著(P<0.05)。
-
表 1表明:间伐显著增加了土壤微生物的数量,土壤各层微生物均以细菌数量最多,其次是放线菌,硝化细菌最少。除放线菌在15~30、30~45 cm随间伐强度增加呈先减小后增加的趋势外,其余土壤微生物数量在各土层均呈先增后降的变化趋势,并随土层的加深微生物数量显著减少,各类群微生物数量均以TS2处理的最多。
表 1 杉木人工林土壤微生物数量(平均值±标准误)
Table 1. Effect of soil microbial quantity in C. lanceolata plantion(Mean±SE)
(×105 cfu·g-1) 菌类
Fungus土层
Soil layer/cm间伐强度Thinning intensity TS0 TS1 TS2 TS3 细菌
Bacteria0~15 7 412.084±259.043 Ad 9 960.316±464.823 Ab 10 974.229±79.690 Aa 8 727.700±162.156 Ac 15~30 4 296.517±102.431 Bc 6 046.878±191.465 Bb 7 128.763±245.444 Ba 6 152.256±171.332 Bb 30~45 3 050.219±83.643 Cc 3 105.607±111.704 Cc 3 842.158±119.724 Ca 3 573.155±53.404 Cb 放线菌
Actinomyces0~15 233.908±11.576 Ac 264.695±8.288 Aba 286.604±2.401 Aa 246.379±7.893 Abc 15~30 178.769±7.898 Ba 142.766±1.768 Bc 112.581±7.234 Bd 165.469±3.753 Bb 30~45 139.414±3.353 Ca 94.662±3.070 Cb 85.844±5.467 Cc 87.240±1.954 Cc 真菌
Fungi0~15 4.337±0.087 Ab 4.895±0.283 Aa 5.129±0.044 Aa 4.946±0.082 Aa 15~30 3.016±0.102 Bc 3.562±0.141 Bb 3.864±0.089 Ba 3.067±0.089 Bc 30~45 1.607±0.013 Cc 2.007±0.042 Cb 2.312±0.054 Ca 2.106±0.042 Cb 氨化细菌
Ammonifier0~15 16.178±0.369 Aa 15.234±0.631 Ab 16.048±0.411 Aa 10.943±0.205 Abc 15~30 10.285±0.244 Bb 8.309±0.211Bc 12.455±0.372 Ba 7.318±0.107 Bd 30~45 3.888±0.155 Cb 4.995±0.055 Cb 6.174±0.191 Ca 3.366±0.042 Cc 硝化细菌
Nitrifying bacteria0~15 0.066±0.005 Ac 0.075±0.004 Abc 0.094±0.003 Aa 0.082±0.004 Ab 15~30 0.041±0.004 Bc 0.054±0.004 Bb 0.071±0.001 Ba 0.060±0.002 Bb 30~45 0.028±0.001Cb 0.030±0.003 Cab 0.034±0.001 Ca 0.034±0.000 Ca 合计
Total0~15 7 666.573±270.240 Ad 10 245.215±473.940 Ab 11 282.104±81.414 Aa 8 990.050±169.608 Ac 15~30 4 488.628±110.173 Bc 6 201.569±193.552 Bb 7 257.734±251.272 Ba 6 328.170±168.529 Bb 30~45 3 195.156±80.959 Cc 3 206.301±111.825 Cc 3 936.522±125.238 Ca 3 665.901±52.083 Cb 注:大写字母表示同一间伐强度不同土层的显著性,小写字母表示不同间伐强度下同一土层的显著性。
Note: Different capital letters meant significant difference at 0.05 level in different soil layers under the same thinning intensity,lowercase letters meant significant difference at 0.05 level under different thinning intensities in the same soil layer.0~15 cm土层,土壤细菌数量TS1、TS2、TS3分别比TS0增加34.38%、48.06%、17.75%;15~30 cm土层,土壤细菌数量TS1、TS2、TS3比TS0分别提高40.74%、65.92%、43.19%;30~45 cm土层,土壤细菌数量TS1、TS2、TS3分别比TS0提高1.82%、25.96%、17.14%。不同类群微生物在不同强度和不同土层中的变化特征不同,放线菌数量TS1、TS2、TS3除0~15 cm土层比对照TS0提高5.33%~22.53%外,15~30、35~40 cm土层比TS0低7.44%~38.43%;真菌数量TS1、TS2、TS3在0~45 cm土层比对照TS0提高0.33%~43.47%;氨化细菌在0~15 cm土层TS1、TS2、TS3分别比TS0降低5.87%、0.80%、32.39%,15~30 cm土层TS1、TS3分别比TS0降低19.24%、28.86%,TS2比TS0提高21.09%。硝化细菌数量在0~45 cm土层TS1、TS2、TS3比TS0提高7.14%~73.17%。不同种类微生物数量总体以TS2间伐强度最高,表明TS2间伐强度对微生物的活动最有利,有益于改善土壤理化性质。
-
从表 2可看出:间伐3 a后,土壤脲酶与过氧化氢酶、蔗糖酶呈极显著正相关,过氧化氢酶与碱性磷酸酶呈显著正相关,过氧化氢酶与蔗糖酶、碱性磷酸酶与脲酶呈正相关,蔗糖酶与碱性磷酸酶呈负相关。土壤过氧化氢酶和脲酶均与细菌、真菌和硝化细菌呈极显著正相关,与放线菌呈极显著负相关;氨化细菌与过氧化氢酶呈负相关,而与脲酶呈正相关;碱性磷酸酶与细菌、真菌和硝化细菌呈正相关,与氨化细菌呈极显著负相关、与放线菌呈负相关, 蔗糖酶与细菌、放线菌和氨化细菌呈极显著正相关,与硝化细菌呈正相关,与放线菌呈负相关。土壤微生物数量之间也有较强的相关性,细菌、真菌和硝化细菌三者间均呈极显著正相关,氨化细菌与细菌、放线菌、真菌以及硝化细菌呈正相关,放线菌与细菌、真菌和硝化细菌呈极显著负相关。
表 2 杉木人工林林地土壤微生物数量及土壤酶活性的相关性分析
Table 2. The correlation analysis of soil microbial quantity and soil enzymes in C. lanceolata plantion
指标Index B1 B2 B3 B4 B5 B6 B7 B8 B2 0.691* B3 0.799** 0.209 B4 0.305 -0.432 0.746** B5 0.860** 0.258 0.931** 0.728** B6 -0.838** -0.483 -0.871** -0.496 -0.850** B7 0.829** 0.207 0.906** 0.749** 0.996** -0.820** B8 -0.081 -0.716** 0.365 0.728** 0.300 0.043 0.325 B9 0.928** 0.470 0.883** 0.515 0.923** -0.828** 0.894** 0.195 注:表中B1~B9分别代表过氧化氢酶、碱性磷酸酶、脲酶、蔗糖酶、细菌、放线菌、真菌、氨化细菌和硝化细菌。*表示显著相关(P<0.05),** 表示极显著相关(P<0.01)。
Note:The B1-B9 represent of hydrogen peroxide enzyme, phosphate enzyme, urease, sucrase, bacteria, actinomycosis, fungi, ammonifying bacteria and nitrifying bacteria. * correlation meant significant difference at the P<0.05, * * correlation meant very significant difference at the P<0.01. -
土壤酶活性是土壤生态系统新陈代谢强度和有效营养养分的直观表现,是确定土壤中微生物活性最可靠的指标之一[19],土壤中各种生物化学和化学反应过程都有土壤酶的作用[20]。于海群等[21]对油松人工林研究得出,随间伐强度的加大,林内土壤孔隙度增大,促进了林内凋落物分解,提高了有机质含量,增强了土壤微生物活动,从而使酶活性增强。本研究间伐3 a后,土壤酶活性显著提高,不同土层间酶活性差异显著。在0~15 cm土层,随间伐强度的增强,除碱性磷酸酶一直增强外,其他土壤酶活性呈先增强后减弱趋势,中度间伐的酶活性最高。这与前人对马尾松、侧柏、油松等人工林的研究结果相似[11, 22]。土壤脲酶和碱性磷酸酶活性的变化与成向荣等[12]研究的弱度间伐活性最强存在一定差异,这可能与间伐强度的大小、立地条件和环境因子等不同所致。本研究中,0~15 cm土层,除碱性磷酸酶外,其他酶活性均以TS2处理的最强;15~30 cm土层,除过氧化氢酶活性在TS3处理最大外,其他酶活性均以TS2处理的最大,且与其它处理差异显著;30~45 cm土层,除蔗糖酶活性TS3处理的最小外,其他酶活性随间伐强度的增强逐渐增强。间伐使土壤酶的活性增强,可能与间伐后林下植被增多[3]或间伐影响植物生长间接影响土壤酶活性[11],也可能是林分郁闭度降低,透光度增强,林内温湿度得到改善所致[23]。
前人研究认为,间伐后,一方面林下植被生物多样性提高,土壤养分循环加速,使土壤微生物多样性和数量提高[3, 24];另一方面改变林下微环境,加速根系分泌,促进凋落物分解,影响土壤中的有机质数量与质量[25-26],最终影响微生物群落。本研究结果与张鼎华等[3]、郑伟等[27]的研究结果相似。本研究中,土壤微生物数量均以TS2处理的最多,可能由于中度间伐后林分环境最有利于土壤微生物的发育,从而数量最多。
前人研究得出,酶活性与土壤微生物数量的相关性较高[28-29],本研究亦得出相似的结论。过氧化氢酶、脲酶与真菌、细菌及硝化细菌呈极显著相关性,与王笛等[29]的研究结论基本一致,但与陈军军等[30]等研究间伐对松栎混交林所得的结果有所不同;碱性磷酸酶与细菌、真菌和硝化细菌呈正相关,与氨化细菌呈极显著负相关、与放线菌呈负相关,这与陈军军等[30]的研究结果略有不同,这可能与二者的研究地域、林分类型、立地、干扰措施及环境等不同有关。
-
(1) 间伐显著提高了土壤过氧化氢酶、碱性磷酸酶、脲酶和蔗糖酶的活性,不同土层间酶活性差异显著。除过氧化氢酶(15~30、30~45 cm)、碱性磷酸酶(0~15 cm)和脲酶(30~45 cm)以TS3处理的酶活性最高外,其他酶活性均以TS2处理的最高。
(2) 间伐显著增加了杉木人工林土壤微生物的数量,不同土层间差异显著。土壤各层微生物数量以细菌最多,其次是放线菌,硝化细菌最少,中度间伐微生物数量最多。
(3) 土壤过氧化氢酶和脲酶均与细菌、真菌和硝化细菌呈极显著正相关,与放线菌呈极显著负相关,氨化细菌与过氧化氢酶呈负相关,而与脲酶呈正相关;碱性磷酸酶与细菌、真菌和硝化细菌呈正相关,与氨化细菌呈极显著负相关,与放线菌呈负相关;蔗糖酶与细菌、真菌和氨化细菌呈极显著正相关,与硝化细菌呈正相关,与放线菌呈负相关。
(4) 中度间伐可以促进杉木对林地养分的吸收和利用,就土壤微生物数量和酶活性而言,对18年生杉木人工林采用中度间伐(保留密度1 200株·hm-2)比较合适。
间伐对杉木人工林土壤酶活性及微生物的影响
Impacts of Thinning on Soil Enzymes Activity and Microorganisms in Cunninghamia lanceolata Plantation
-
摘要:
目的 研究间伐对杉木人工林土壤微生物数量、酶活性及关系的影响,试图了解不同间伐强度作用下土壤恢复的过程和机制,为人工林经营提供理论依据。 方法 以18年生杉木人工林为研究对象,采用随机区组试验设计,分析4种间伐强度TS0(未间伐(0.0%),1 800株·hm-2)、TS1(轻度(16.7%),1 500株·hm-2)、TS2(中度(33.3%),1 200株·hm-2)和TS3(重度(50.0%),900株·hm-2)下杉木人工林土壤微生物数量及土壤酶活性特点,探讨土壤微生物数量与酶活性的相关性。 结果 表明:间伐3年后,林下土壤层酶活性和微生物数量显著提高,不同土层间土壤微生物数量和酶活性均差异显著;间伐显著提高了土壤过氧化氢酶、碱性磷酸酶、脲酶和蔗糖酶的活性,除过氧化氢酶(15~30、30~45 cm)、碱性磷酸酶(0~15、30~45 cm)以及脲酶(30~45 cm)以TS3处理的酶活性最高外,其他酶活性在各土层和不同间伐强度下均以TS2处理的酶活性最高;土壤各层微生物以细菌数量最多,其次是放线菌,硝化细菌最少,且TS2处理的微生物数量最多。土壤过氧化氢酶和脲酶活性均与细菌、真菌和硝化细菌数量呈极显著正相关,与放线菌数量呈极显著负相关,氨化细菌数量与过氧化氢酶活性呈负相关,而与脲酶活性呈正相关;碱性磷酸酶活性与细菌、真菌和硝化细菌数量呈正相关,与氨化细菌数量呈极显著负相关,与放线菌数量呈负相关;蔗糖酶活性与细菌、真菌和氨化细菌数量呈极显著正相关,与硝化细菌数量呈正相关,与放线菌数量呈负相关。 结论 间伐改善了林分环境、光照、温度以及林下植被的发育,提高了林下土壤酶活性并增加了微生物数量。间伐3年后的综合表现表明,中度间伐最利于杉木人工中、近熟林阶段的经营,对于改善土壤性质较好。 Abstract:Objective In order to understand the process and mechanism of soil restoration under different thinning intensities, and provide theoretical basis for management of plantation, the impact of thinning intensity on soil enzyme activity and microorganisms in Cunninghamia lanceolata plantation and the interaction between them were studied. Method 18-year-old C. lanceolata plantations in Rongjiang county of Guizhou province were studied with random block experiments. The soil enzyme activity and soil microorganisms under 4 different thinning intensities, TS0 (no thinning (0.0%), 1 800 trees·hm-2), TS1 (mild (16.7%), 1 500 trees·hm-2) and TS2 (moderate (33.3%), 1 200 trees·hm-2) and TS3 (severe (50.0%), 900 trees·hm-2) were analyzed, the correlation of soil microorganisms and soil enzyme activities were also revealed. Result After 3 years' thinning, both the enzyme activities and microorganism amounts in soil layer significantly increased, the differences in soil microbe amount and enzyme activity among different soil layers were significant, and the activities of soil catalase, phosphatase, urease and invertase significantly increased. The activities of catalase (15-30 cm and 30-45 cm), alkaline phosphatase (0-15 cm and 30-45 cm) and urease(30-45 cm)in treatment TS3 were higher than that in other treatments, while the activities of the other enzymes in different soil layers and different intensities were higher in treatment TS2. The amount of bacteria was the most in each layer, followed by actinomyces and nitrifying bacteria. The amount of microorganisms in treatment TS2 was more than that in other treatments. The activities of urease and catalase had very significantly positive correlation with the amounts of bacteria, fungi and digestion, while they were very significantly negative correlation with actinomycetes. The amount of ammonifying bacteria had negative correlation with hydrogen peroxide enzyme activity, and had positive correlation with urease activity. The activities of phosphatase had positive correlation with the amounts of bacteria, fungi and nitrifying bacteria, and had very significantly negative correlation with ammonifying bacteria amount, and had negative correlation with actinomycetes amount. The activities of invertase had very significantly positive correlation with the amount of bacteria, actinomyces, and ammonifying bacteria, and had positive correlation with amount of nitrifying bacteria, and had negative correlation with actinomycetes. Conclusion The forest environment, light, temperature and the growth of vegetation were improved after thinning, and the soil enzyme activities and the amount of microorganisms increased. The general performances after 3 years' thinning indicated that middle thinning intensity is the best in the management of near-mature C. lanceolata plantations and improvement of soil properties. -
Key words:
- Cunninghamia lanceolata
- / plantation
- / thinning intensity
- / soil microbes
- / soil enzyme
-
图 1 间伐对杉木人工林土壤酶活性的影响
Figure 1. Effects of soil enzymes activity with thinning on C. lanceoolata plantation
表 1 杉木人工林土壤微生物数量(平均值±标准误)
Table 1. Effect of soil microbial quantity in C. lanceolata plantion(Mean±SE)
(×105 cfu·g-1) 菌类
Fungus土层
Soil layer/cm间伐强度Thinning intensity TS0 TS1 TS2 TS3 细菌
Bacteria0~15 7 412.084±259.043 Ad 9 960.316±464.823 Ab 10 974.229±79.690 Aa 8 727.700±162.156 Ac 15~30 4 296.517±102.431 Bc 6 046.878±191.465 Bb 7 128.763±245.444 Ba 6 152.256±171.332 Bb 30~45 3 050.219±83.643 Cc 3 105.607±111.704 Cc 3 842.158±119.724 Ca 3 573.155±53.404 Cb 放线菌
Actinomyces0~15 233.908±11.576 Ac 264.695±8.288 Aba 286.604±2.401 Aa 246.379±7.893 Abc 15~30 178.769±7.898 Ba 142.766±1.768 Bc 112.581±7.234 Bd 165.469±3.753 Bb 30~45 139.414±3.353 Ca 94.662±3.070 Cb 85.844±5.467 Cc 87.240±1.954 Cc 真菌
Fungi0~15 4.337±0.087 Ab 4.895±0.283 Aa 5.129±0.044 Aa 4.946±0.082 Aa 15~30 3.016±0.102 Bc 3.562±0.141 Bb 3.864±0.089 Ba 3.067±0.089 Bc 30~45 1.607±0.013 Cc 2.007±0.042 Cb 2.312±0.054 Ca 2.106±0.042 Cb 氨化细菌
Ammonifier0~15 16.178±0.369 Aa 15.234±0.631 Ab 16.048±0.411 Aa 10.943±0.205 Abc 15~30 10.285±0.244 Bb 8.309±0.211Bc 12.455±0.372 Ba 7.318±0.107 Bd 30~45 3.888±0.155 Cb 4.995±0.055 Cb 6.174±0.191 Ca 3.366±0.042 Cc 硝化细菌
Nitrifying bacteria0~15 0.066±0.005 Ac 0.075±0.004 Abc 0.094±0.003 Aa 0.082±0.004 Ab 15~30 0.041±0.004 Bc 0.054±0.004 Bb 0.071±0.001 Ba 0.060±0.002 Bb 30~45 0.028±0.001Cb 0.030±0.003 Cab 0.034±0.001 Ca 0.034±0.000 Ca 合计
Total0~15 7 666.573±270.240 Ad 10 245.215±473.940 Ab 11 282.104±81.414 Aa 8 990.050±169.608 Ac 15~30 4 488.628±110.173 Bc 6 201.569±193.552 Bb 7 257.734±251.272 Ba 6 328.170±168.529 Bb 30~45 3 195.156±80.959 Cc 3 206.301±111.825 Cc 3 936.522±125.238 Ca 3 665.901±52.083 Cb 注:大写字母表示同一间伐强度不同土层的显著性,小写字母表示不同间伐强度下同一土层的显著性。
Note: Different capital letters meant significant difference at 0.05 level in different soil layers under the same thinning intensity,lowercase letters meant significant difference at 0.05 level under different thinning intensities in the same soil layer. 下载: 导出CSV
表 2 杉木人工林林地土壤微生物数量及土壤酶活性的相关性分析
Table 2. The correlation analysis of soil microbial quantity and soil enzymes in C. lanceolata plantion
指标Index B1 B2 B3 B4 B5 B6 B7 B8 B2 0.691* B3 0.799** 0.209 B4 0.305 -0.432 0.746** B5 0.860** 0.258 0.931** 0.728** B6 -0.838** -0.483 -0.871** -0.496 -0.850** B7 0.829** 0.207 0.906** 0.749** 0.996** -0.820** B8 -0.081 -0.716** 0.365 0.728** 0.300 0.043 0.325 B9 0.928** 0.470 0.883** 0.515 0.923** -0.828** 0.894** 0.195 注:表中B1~B9分别代表过氧化氢酶、碱性磷酸酶、脲酶、蔗糖酶、细菌、放线菌、真菌、氨化细菌和硝化细菌。*表示显著相关(P<0.05),** 表示极显著相关(P<0.01)。
Note:The B1-B9 represent of hydrogen peroxide enzyme, phosphate enzyme, urease, sucrase, bacteria, actinomycosis, fungi, ammonifying bacteria and nitrifying bacteria. * correlation meant significant difference at the P<0.05, * * correlation meant very significant difference at the P<0.01.
下载: 导出CSV
-
[1] 方奇. 杉木连栽对土壤肥力及其林木生长的影响[J]. 林业科学, 1987, 23(4): 289-297. [2] 黄成标, 曹继钊, 吴庆标, 等. 秃杉林与杉木连栽林的土壤理化性质及林木生长量比较[J]. 林业科学, 2010, 46(4): 1-7. doi: 10.3969/j.issn.1672-8246.2010.04.001 [3] 张鼎华, 叶章发, 范必有, 等. 抚育间伐对人工林土壤肥力的影响[J]. 应用生态学报, 2001, 12(5): 672-676. doi: 10.3321/j.issn:1001-9332.2001.05.007 [4] 吴蔚东, 张桃林, 孙波, 等. 人工杉木林地有机物和养分库的退化与调控[J]. 土壤学报, 2000, 37(1): 41-49. doi: 10.3321/j.issn:0564-3929.2000.01.006 [5] 孙启武, 杨承栋, 焦如珍. 江西大岗山连栽杉木人工林土壤性质的变化[J]. 林业科学, 2003, 39(3): 1-5. doi: 10.3321/j.issn:1001-7488.2003.03.001 [6] 牛小云, 孙晓梅, 陈东升, 等. 日本落叶松人工林枯落物土壤酶活性[J]. 林业科学, 2015, 51(4): 16-25. [7] 郭蓓, 刘勇, 李国雷, 等. 飞播油松林地土壤酶活性对间伐强度的响应[J]. 林业科学, 2007, 43(7): 128-133. [8] 杨涛, 徐慧, 方德华, 等. 樟子松林下土壤养分、微生物及酶活性的研究[J]. 土壤通报, 2005, 37(2): 253-257. doi: 10.3321/j.issn:0564-3945.2005.02.027 [9] 陈立新. 落叶松人工林施肥对土壤酶和微生物的影响[J]. 应用生态学报, 2004, 15(6): 1000-1004. doi: 10.3321/j.issn:1001-9332.2004.06.017 [10] 杨万勤, 王开运. 森林土壤酶的研究进展[J]. 林业科学, 2004, 40(2): 152-159. doi: 10.3321/j.issn:1001-7488.2004.02.027 [11] 郝俊鹏, 凌宁, 李瑞霞, 等. 间伐对马尾松人工林土壤酶活性的影响[J]. 南京林业大学学报: 自然科学版, 2013, 37(4): 51-56. [12] 成向荣, 徐金良, 刘佳, 等. 间伐对杉木人工林林下植被多样性及其营养元素现存量影响[J]. 中国农学通报, 2014, 30(4): 17-22. [13] 龚固堂, 牛牧, 慕长龙, 等. 间伐强度对柏木人工林生长及林下植物的影响[J]. 林业科学, 2015, 51(4): 8-15. [14] 熊有强, 盛炜彤, 曾满生. 不同间伐强度杉木林下植被发育及生物量研究[J]. 林业科学研究, 1995, 8(4): 408-412. doi: 10.3321/j.issn:1001-1498.1995.04.013 [15] 徐金良, 毛玉明, 郑成忠, 等. 抚育间伐对杉木人工林生长及出材量的影响[J]. 林业科学研究, 2014, 27(1): 99-107. [16] 方晰, 田大伦, 秦国宣, 等. 杉木林采伐迹地连栽和撂荒对林地土壤养分与酶活性的影响[J]. 林业科学, 2009, 45(12): 65-71. [17] 张超, 刘国彬, 薛萐, 等. 黄土丘陵区不同林龄人工刺槐林土壤酶演变特征[J]. 林业科学, 2010, 46(12): 24-29. [18] 李振高, 骆永明, 腾应. 土壤与环境微生物研究法[M]. 北京: 科学出版社, 2008. [19] Singh S K, Rai J P N, Singh A. Influence of prevailing disturbances on soil biology and biochemistry of montane habitats at Nanda Devi Biosphere Reserve(NDBR). India during wet and dry seasons[J]. Geoderma, 2011, 162(3/4): 296-302. [20] Jimenez M D, de la Horra A M, Pruzzo L, et al. Soil quality; a new index based on microbiological and biochemical parameters[J]. Biology and Fertility of Soils, 2002, 35(4): 302-306. doi: 10.1007/s00374-002-0450-z [21] 于海群, 刘勇, 李国雷, 等. 油松幼龄人工林土壤质量对间伐强度的响应[J]. 水土保持通报, 2008, 28(3): 65-70. [22] 李国雷, 刘勇, 甘敬, 等. 飞播油松林地土壤酶活性对间伐强度的季节响应[J]. 北京林业大学学报, 2008, 30(2): 82-88. doi: 10.3321/j.issn:1000-1522.2008.02.014 [23] 万忠梅, 吴景贵. 土壤酶活性影响因子研究进展[J]. 西北农林科技大学学报: 自然科学版, 2005, 33(6): 87-92. doi: 10.3321/j.issn:1671-9387.2005.06.019 [24] 殷鸣放, 周立君, 毕刚蕊, 等. 带状间伐对长白落叶松人工纯林诱导复层林效果评价[J]. 东北林业大学学报, 2013, 41(5): 20-24. doi: 10.3969/j.issn.1000-5382.2013.05.005 [25] Blanco J A, Imbert J B, Castillo F J. Nutrient return via litterfall in two contrasting Pinus sylvestris forests in the Pyrenees under different thinning intensities[J]. Forest Ecology and Management, 2008, 256(11): 1840-1852. doi: 10.1016/j.foreco.2008.07.011 [26] Hynes H M, Germida J J. Relationship between ammonia oxidizing bacteria and bioavailable nitrogen in harvested forest soils of central lberta[J]. Soil Biology and Biochemistry, 2012, 46(1): 18-25. [27] 郑伟, 霍光华, 骆昱春, 等. 马尾松低效林不同改造模式土壤微生物及土壤酶活性的研究[J]. 江西农业大学学报, 2010, 32(4): 743-751. doi: 10.3969/j.issn.1000-2286.2010.04.021 [28] 丁菡, 胡海波, 王人潮. 半干旱区土壤酶活性与其理化及微生物的关系[J], 南京林业大学学报: 自然科学版, 2007, 31(2): 12-18. [29] 王笛, 马风云, 姚秀粉, 等. 黄河三角洲退化湿地土壤养分、微生物与土壤酶特性及其关系分析[J], 中国水土保持科学, 2012, 10(5): 94-98. [30] 陈军军, 侯琳, 李银, 等. 秦岭松栎混交林土壤微生物及酶活性[J]. 东北林业大学学报, 2014, 42(3): 103-106, 111. -

 点击查看大图
图(1) / 表(2)
计量
- 文章访问数: 3857
- HTML全文浏览量: 906
- PDF下载量: 645
- 被引次数: 0
