


-
近30 a来,随着我国工业、农业的迅速发展,大量的固体、液体和气态污染物无序排放进入环境,以增产为目的而大量施用的化肥和农药,大部分也流失到了水土环境中,最终导致了日趋严重的土壤污染,其中,重金属污染土地面积已达到2×10⁷ hm2,占全国耕地面积的1/5[1]。重金属不能被生物降解,因而能在土壤中长期积累,对农业生产、环境安全和人体健康产生危害[2]。治理土壤污染、保护有限土地资源已经成为我国面临的紧迫问题。土壤重金属污染的传统治理方法包括物理修复、化学修复,如蒸汽浸提修复技术、电动力学修复技术、土壤性能改良技术、化学氧化修复技术等,但传统方法存在修复成本高、破坏土壤结构、易造成二次污染等许多弊端。因此,一种绿色的修复技术——植物修复应运而生并日益受到重视。
植物修复是利用植物及微生物的联合作用移除或者固定环境污染物的修复方法,可以用在有机污染物和重金属的去除上[3]。植物修复具有低成本、高效、环境友好、太阳供能、原位修复等特点,正逐步被用于土壤及水体污染治理中[4-5]。针对重金属污染的植物修复,人们对超富集植物和重金属耐性植物给予了较多关注,并开展了大量研究,发现了海洲香薷(Elsholtzia haichowensis Sun)、蜈蚣草(Pteris vittata L.)、龙葵(Solanum Nigrum L.)等超积累植物[6-8],这些超积累植物具有很高的重金属耐性及积累能力。近年我国学者还发现,藤类植物蔓长春花(Vinca major L.)对Cd污染土壤有较大修复潜力[9]。但这些植物基本都是草本植物,具有生物量较小、根系不够发达、生长周期短、需要收割和重新栽种、人力耗费大、二次处理成本高昂等缺点,不利于重金属污染土壤的长期修复。
木本植物生物量巨大、根系更发达、耐受和富集能力强、有更强的适应性,具有更大的重金属污染修复潜力[10]。研究表明,杂交杨(Populus tricocapa × P. deltoides)组织中Cd积累量最高可达209 mg·kg-1[11]。Hammer等发现,在Cd、Zn轻度污染的土地进行5 a的修复试验后,蒿柳(Salix viminalis L.)地上部对污染土壤(pH值7.3)Cd和Zn的移除量分别达到170 g·hm-2、13.4 kg·hm-2,修复效益高于同等条件下Cd超积累植物油菜(Brassica napus L.)等草本植物[12];Jensen等发现,在Cd、Zn、Pb和Cu严重污染的情况下,蒿柳依旧能有效从土壤中转运、积累重金属,只是生物量与轻度污染土壤情况相比有所下降[13];而张春燕等发现,在Cd、Zn、Pb严重污染土壤中生长的8个杨树(Populus spp.)和6个柳树(Salix spp.)树种(品种)中,苏柳61-1(S. jiangsuensis CL.’61-1’)和苏柳795(S. jiangsuensis CL. ‘795’)的生物量随土壤重金属含量升高显著降低,而苏柳2205(S. jiangsuensis CL. ‘2205’)和苏柳928(S. jiangsuensis CL. ‘928’)等的生物量、株高等相比轻度污染土壤反而有所升高[14]。正是由于木本植物突出的重金属积累能力,人们开始研究运用速生木本植物修复重金属污染的可能。
本文研究了浙江杭州一处重金属污染稻田中4个耐水湿树种的生长状况及重金属积累能力,分析了其对重金属污染湿地的修复效益,在目前野外实地植物修复试验数据较少的情况下,以期为重金属污染土地植物修复的树种选择提供一定的理论依据。
-
试验点位于浙江省杭州市富阳区小剡村(29°53′ N,119°54′ E),处于亚热带季风区,四季分明,雨量充沛,全年平均气温17.8℃,平均相对湿度70.3%,年降水量1 454 mm,年日照时数1 765 h。试验区属于水稻田,被生产ZnSO4化学试剂的小型化工厂排放的废水污染,污染发生后稻田停止种植水稻并闲置多年。污染区域面积约7 000 m2。因周围都是正常耕作的稻田,灌溉沟渠里的水位随种植季节变化,污染土地存在季节性淹水情况,区域内多种重金属含量普遍偏高,且重金属浓度存在一定变化幅度。
该污染区划为4个区块,2009年春在B区种植杞柳‘微山湖’(S. integra ‘Weishanhu’),C区种植沙柳(S. psammophila C. Wang et Chang Y. Yang),D区种植墨西哥落羽杉(Taxodium mucronatum Tenore),2011年春在A区种植水紫树(Nyssa aquatic L.)。杞柳‘微山湖’和沙柳分别来自山东省临沂市林业科学研究所和山东省林业科学研究院(东营分院),采用1年生枝条扦插种植;墨西哥落羽杉和水紫树来自中国林业科学研究院亚热带林业研究所试验苗圃1年生幼苗,采用裸根幼苗栽种。
-
2015年8月,采用梅花形取样法在各区块确定5个采样点,每个采样点采集树木样本和土样1份。统计树木基径、胸径以及高度,基径从地面以上10 cm处测量,胸径从地面以上1.3 m处测量,树高为地面到树木最高生长点间的垂直距离。每个采样点将土壤表层覆盖的落叶除去后采集表层土样(深度0~20 cm)1份。树木整株挖出,并尽量保持根部完整性,立即将根系泥土洗净并擦干水分,植物样品分为根部、主干、枝条、叶片分别称质量,并取试验足够用量用塑封袋带回实验室,带回的样品分别用自来水和去离子水冲洗干净,用滤纸吸干表面水分,称量鲜质量,在烘箱中105℃杀青30 min,再经80℃烘干至恒质量,计算含水率,并通过含水率计算整株树木生物量。
-
采集的土样自然风干后用木棒碾碎,除去2 mm以上砂砾和植物残体。土样分别过2、1、0.149 mm筛,用来测定土壤pH、有机质、氮、磷、钾以及重金属(Cd、Zn、Pb、Cu、Mn、Cr、Ni)全量。植物样品剪碎后,用球磨机粉碎(Retsch MM400, GER),过100目筛,测定重金属含量。
重金属测定方法:土样用硝酸-氢氟酸-高氯酸以体积比为8:4:1的混合酸消解,植物样用硝酸-高氯酸以体积比为10:1的混合酸消解。经消解后的土壤和植物样品用电感耦合等离子体质谱仪(ICP-MS, Agilent 7700 ×, USA)测定Cd、Zn、Pb、Cu、Cr、Ni含量,用电感耦合等离子体发射光谱仪(ICP-AES, Perkin Elmer Optima 8000, USA)测定Mn含量。
-
地质累积指数(Igeo)既反映了重金属分布的自然变化特征,也可以判别人为活动对环境的影响,是区分人为活动影响的重要参数[15-17]。
$ I_{g e o} = \log _{2}\left[C_{n} / 1.5 B_{n}\right] $
式中:Cn为样品中元素的浓度,Bn为背景值,1.5为修正指数,通常用来表征沉积特征、岩石地质及其它影响。
地质累积指数可分为7个级别,若Igeo < 0,污染级别为0级,表示无污染;0≤Igeo < 1,污染级别为1级,表示无污染到中度污染;1≤Igeo < 2,污染级别为2级,表示中度污染;2≤Igeo < 3,污染级别为3级,表示中度污染到强污染;3≤Igeo < 4,污染级别为4级,表示强污染;4≤Igeo < 5,污染级别为5级,表示强污染到极强度污染;Igeo≥5,污染级别为6级,表示极强污染。
植物各部分对重金属的积累能力和将重金属从根系向地上部分转移的能力可以利用植物各部分的重金属含量进行生物富集系数(BCF)和转移系数(TF)计算[1-2],植物各部位重金属浓度结合生物量计算重金属的积累量。公式如下:
$ \begin{aligned} B C F & = C_{\text { harvested tisue }} / C_{\text { soil }} \\ T F & = C_{\text { aerial parts }} / C_{\text { roots }} \end{aligned} $
式中:Charvested tissue为目标部位重金属含量;Csoil为土壤重金属含量;Caerial parts为地上部重金属含量;Croots为根部重金属含量。
-
计算平行样品间平均值与标准差作为最终结果。利用DPS 7.05软件进行数据处理及单因素方差分析,采用Excel 2015和Origin Pro 8软件作图。
-
从表 1可以看出:试验区土壤pH值为7.49~8.03,属于碱性土壤,可能是废水排放导致土壤pH值上升的结果。数据表明:A区、B区和C区、D区土壤理化性质有显著性差异,而A区、B区之间和C区、D区之间理化性质基本一致。试验区土壤中的重金属种类主要为Cd、Zn、Pb、Cu、Mn、Cr和Ni。各地块重金属含量与土壤环境质量标准进行比较[18],结果Cd和Zn属于超三级标准,Pb和Cu属于二级标准,Cr和Ni属于一级标准,Mn未达到污染等级。不同地块重金属含量分布不均,C区与D区中Cd、Zn、Cu浓度明显高于其它2块土地,而另外4种重金属浓度接近。
表 1 土壤理化性质
Table 1. Physical and chemical properties of soil
理化性质
Physicochemical propertiesA区
Block AB区
Block BC区
Block CD区
Block DpH值 8.03±0.11 a 7.96±0.06 a 7.49±0.13 b 7.58±0.09 b 有机质Organic matter/(g·kg-1) 54.36±6.20 b 52.80±7.19 b 75.26±12.91 a 75.82±9.69 a 全氮Total nitrogen/(g·kg-1) 3.04±0.30 b 2.95±0.33 b 3.97±0.78 a 4.05±0.46 a 全磷Total phosphors/(g·kg-1) 1.05±0.06 a 1.03±0.05 a 1.03±0.12 a 1.09±0.08 a 全钾Total potassium/(g·kg-1) 6.95±0.43 a 7.21±0.72 a 5.62±0.08 b 5.03±0.32 b 水解氮Hydrolytic N/(mg·kg-1) 249.60±73.11 b 223.80±35.34 b 371.40±91.93 a 342.80±58.50 a 有效磷Available P/(mg·kg-1) 16.32±2.35 b 15.04±1.69 b 35.34±12.60 a 42.76±13.26 a 速效钾Available K/(mg·kg-1) 54.70±12.44 b 57.72±12.31 b 149.16±49.22 a 140.20±24.04 a Cd/(mg·kg-1) 11.22±4.68 c 15.61±8.76 bc 35.44±19.29 ab 55.00±22.72 a Zn/(mg·kg-1) 508.60±128.64 b 631.40±243.45 b 1 198.40±579.19 ab 1 662.80±829.11 a Pb/(mg·kg-1) 70.88±10.90 b 76.36±19.73 b 126.44±51.00 b 229.80±93.54 a Cu/(mg·kg-1) 40.94±3.33 b 42.62±6.07 b 74.26±24.28 a 79.20±25.53 a Mn/(mg·kg-1) 479.40±55.00 b 536.60±56.92 ab 497.60±23.44 ab 542.80±44.37 a Cr/(mg·kg-1) 44.28±1.98 a 46.58±2.23 a 38.34±2.27 b 34.38±3.41 c Ni/(mg·kg-1) 24.20±0.54 a 25.28±1.23 a 24.70±3.04 a 23.10±3.33 a 注:不同小写字母表示不同地块土壤同一指标差异显著(P < 0.05)。
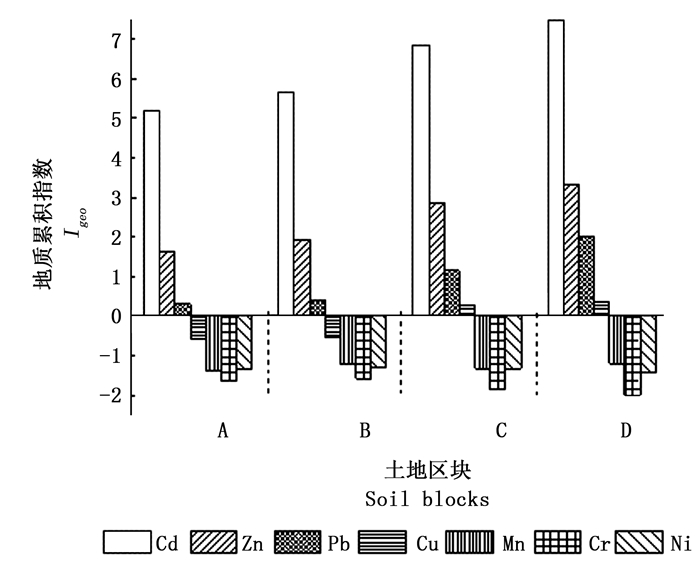
Note: Different small letters indicate significant differences among the same index between different soil plots (P < 0.05).地质累积指数中土壤背景值采用杭嘉湖平原区背景值进行计算[19],计算结果可更实际地反映当地重金属污染状况。结果(图 1)显示:各区块土壤存在不同程度的Cd、Zn、Pb污染,各区域Cd都达到了极强污染程度;A区和B区Zn为中度污染,C区为中度污染到强污染,D区为强污染;A区和B区Pb为无污染到中度污染水平,C区为中度污染水平,D区为中度污染到强污染水平;A区和B区Cu为无污染情况,C区、D区为无污染到中度污染水平。土壤Mn、Cr、Ni含量较低,无污染情况出现。根据土壤污染情况,本文着重探讨了4个树种对Cd、Zn、Pb和Cu的积累能力,同时,考虑到水紫树较强的Mn的积累和转运能力,也进行了相应的Mn积累和转运的探讨。

图 1 地质累积指数
Figure 1. Geoaccumulation Index (Igeo)
-
各树种在重金属复合污染条件下生长差异较大(表 2),其中, 沙柳的植株高度和生物量高于其它树种,分别为12.18 m、35.44 kg·株-1;墨西哥落羽杉的基径最大,为17.50 cm;水紫树各项生长指标数值均低于其它树种;杞柳‘微山湖’是灌木树种,基径和胸径不作测量。
表 2 4个树种生长情况
Table 2. Growth indices of different tree species
树种
Species基径
Basal diameter/cm胸径
Breast diameter/cm高度
Height/m生物量
Biomass/(kg·株-1)沙柳S. psammophila 14.60±2.30 b 10.60±2.10 a 12.18±3.19 a 35.44±14.77 a 杞柳‘微山湖’ S. interga ‘Weishanhu’ -- -- 4.25±0.09 b 23.53±9.63 ab 墨西哥落羽杉T. mucronatum 17.50±2.37 a 10.10±1.56 a 5.09±0.32 b 19.41±7.05 b 水紫树N. aquatica 6.72±0.81 c 4.34±0.66 b 3.75±0.29 b 1.94±0.42 c 注:不同小写字母代表不同树种同一指标差异显著(P < 0.05),水紫树是第4年生长数据,其它树种是第6年数据。
Note: Different small letters indicate significant differences among the same index between different tree species (P < 0.05), the data of N. aquatica 4 years, the other species is 6 years.4个树种的生物量差异较大,沙柳的生物量最大,其次是杞柳‘微山湖’和墨西哥落羽杉,水紫树单株生物量最小,仅有1.94 kg。4个树种的地上部生物量占单株生物量的比例为70.65%(水紫树)~86.03%(沙柳)。水紫树、杞柳‘微山湖’、沙柳各部位生物量比例为主干>根部>枝条>叶片,而墨西哥落羽杉为主干>枝条>根部>叶片(图 2)。
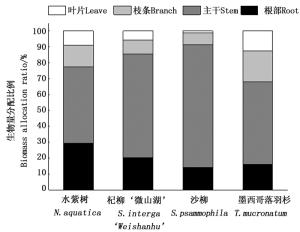
图 2 4个树种的生物量分配
Figure 2. The biomass allocation ratio of different tree species
-
不同树种对重金属的积累能力差异显著(表 3)。杞柳‘微山湖’各部位的Cd和Zn浓度均较高,范围分别为15.66(主干)~57.62 mg·kg-1 (叶片)、128.60(主干)~691.00 mg·kg-1 (叶片)。沙柳和墨西哥落羽杉的根部Zn的浓度分别为232.20、172.86 mg·kg-1。墨西哥落羽杉根部和沙柳叶部Pb的浓度明显高于其它植物同一部位,但整体而言Pb在各树种不同部位中含量均较低。杞柳‘微山湖’各部位Cu浓度较高,范围是9.63(主干)~14.88 mg·kg-1(叶片)。Cu在墨西哥落羽杉细枝中浓度达到19.56 mg·kg-1,但在其它部位浓度较低。水紫树各部位Mn的浓度明显高于其它植物,范围达到98.88(主干)~685.00 mg·kg-1 (叶片)。
表 3 树木各部位重金属含量
Table 3. Heavy metals concentration in each part of different tree species
树种
Species部位
Organ重金属含量Heavy metals concentration/(mg·kg-1) Cd Zn Pb Cu Mn 水紫树
N. aquatica根Root 2.36±0.68 c 38.43±13.13 b 4.27±2.69 b 11.10±0.67 ab 111.35±66.48 a 主干Stem 0.73±0.55 c 20.84±9.71 c 3.18±2.06 a 8.23±1.34 a 98.88±27.03 a 枝条Branch 0.91±0.22 bc 31.20±4.81 c 3.38±0.51 ab 10.39±2.42 bc 161.48±56.03 a 叶Leaf 0.73±0.34 b 29.60±5.36 b 4.99±1.99 b 7.37±1.58 c 685.00±242.38 a 杞柳‘微山湖’
S. interga ‘Weishanhu’根Root 25.02±8.19 a 225.60±34.11 a 7.09±1.24 ab 13.48±0.93 a 40.96±5.96 b 主干Stem 15.66±2.32 a 128.60±14.98 a 2.25±0.64 ab 9.63±0.92 a 10.36±2.47 b 枝条Branch 20.72±4.80 a 173.80±30.63 a 2.77±0.45 b 12.81±3.27 b 27.46±2.23 b 叶Leaf 57.62±18.81 a 691.00±186.41 a 6.22±0.78 b 14.88±1.08 a 86.16±5.17 b 沙柳
S. psammophila根Root 12.47±7.27 b 232.20±116.41 a 7.01±2.74 ab 8.68±3.81 bc 27.20±10.09 b 主干Stem 4.44±1.54 b 83.26±18.09 b 2.17±0.44 ab 5.47±0.96 b 12.05±4.31 b 枝条Branch 4.14±1.06 b 61.88±13.49 b 3.77±1.51 ab 8.56±0.96 c 19.84±3.63 b 叶Leaf 4.27±1.62 b 100.02±34.88 b 12.53±5.92 a 11.38±1.14 b 85.96±16.54 b 墨西哥落羽杉
T. mucronatum根Root 6.48±5.02 bc 172.86±94.97 a 10.09±6.81 a 6.75±1.22 c 41.72±14.89 b 主干Stem 0.35±0.03 c 14.30±1.46 c 0.97±0.51 b 4.17±1.41 b 9.02±4.62 b 枝条Branch 0.59±0.10 c 39.64±8.39 bc 4.69±1.79 a 19.56±3.78 a 8.56±1.08 b 叶Leaf 0.35±0.05 b 31.80±5.12 b 5.43±1.31 b 7.38±1.08 c 36.00±3.71 b 注:不同小写字母代表不同树种同一部位指标差异显著(P < 0.05),下同。
Note: Different small letters indicate significant differences among the same index of the same part between different tree species (P < 0.05), the same below.不同树种对重金属的生物富集系数和转运系数不同(表 4)。杞柳‘微山湖’各部位对Cd的富集系数都大于1.00,其中,叶片达到4.94,根部达到2.26,杞柳‘微山湖’叶片对Zn、水紫树叶片对Mn的富集系数分别为1.24和1.41。水紫树对Pb(1.16)和Mn(2.34)、墨西哥落羽杉对Cu(1.32)的转运系数均大于1.00,其中,水紫树对Mn的转运系数最高,为2.34;杞柳‘微山湖’对Zn和Cd转运系数最高,同为0.89;沙柳对Cu转运系数达到0.80。
表 4 4个树种不同部位的重金属生物富集系数及转运系数
Table 4. BCFs and TFs in each part of different tree species
树种Species 项目Item Cd Zn Pb Cu Mn 水紫树
N. aquatica富集系数
BCF根部Root 0.29±0.19 b 0.08±0.03 b 0.07±0.05 ab 0.28±0.01 a 0.23±0.13 a 主干Stem 0.08±0.08 b 0.05±0.03 b 0.05±0.03 a 0.20±0.04 a 0.20±0.04 a 枝条Branch 0.10±0.05 b 0.07±0.02 b 0.05±0.01 a 0.26±0.07 a 0.33±0.08 a 叶片Leaf 0.07±0.03 b 0.06±0.02 b 0.07±0.04 ab 0.18±0.05 b 1.41±0.40 a 转运系数TF 0.38±0.28 b 0.73±0.40 a 1.16±0.71 a 0.81±0.15 b 2.34±1.12 a 杞柳‘微山湖’
S. interga ‘Weishanhu’富集系数
BCF根部Root 2.26±1.76 a 0.40±0.16 a 0.10±0.03 a 0.32±0.04 a 0.08±0.02 b 主干Stem 1.36±0.94 a 0.24±0.13 a 0.03±0.01 ab 0.23±0.03 a 0.02±0.00 b 枝条Branch 1.76±1.03 a 0.31±0.12 a 0.04±0.01 ab 0.30±0.07 a 0.05±0.01 b 叶片Leaf 4.94±3.09 a 1.24±0.54 a 0.09±0.02 a 0.35±0.04 a 0.16±0.02 b 转运系数TF 0.89±0.15 a 0.89±0.08 a 0.40±0.09 b 0.79±0.07 b 0.53±0.06 b 沙柳
S. psammophila富集系数
BCF根部Root 0.45±0.40 b 0.22±0.15 b 0.06±0.02 b 0.13±0.08 b 0.05±0.02 b 主干Stem 0.14±0.06 b 0.08±0.03 b 0.02±0.01 b 0.08±0.03 b 0.02±0.01 b 枝条Branch 0.15±0.09 b 0.06±0.03 b 0.03±0.01 b 0.12±0.03 b 0.04±0.01 b 叶片Leaf 0.16±0.12 b 0.11±0.07 b 0.11±0.04 a 0.17±0.05 b 0.17±0.04 b 转运系数TF 0.41±0.14 b 0.42±0.18 b 0.42±0.17 b 0.80±0.39 b 0.63±0.35 b 墨西哥落羽杉
T. mucronatum富集系数
BCF根部Root 0.13±0.09 b 0.11±0.08 b 0.04±0.02 b 0.09±0.03 b 0.08±0.03 b 主干Stem 0.01±0.00 b 0.01±0.01 b 0.01±0.01 b 0.06±0.04 b 0.02±0.01 b 枝条Branch 0.01±0.01 b 0.03±0.01 b 0.03±0.02 b 0.28±0.12 a 0.02±0.00 b 叶片Leaf 0.01±0.00 b 0.02±0.01 b 0.03±0.02 b 0.10±0.03 c 0.07±0.01 b 转运系数TF 0.10±0.06 c 0.19±0.14 b 0.45±0.36 b 1.32±0.40 a 0.38±0.15 b 水紫树叶片对Mn的积累量占水紫树积累总量的37.82%;杞柳‘微山湖’叶片对Zn、Mn的积累比例分别为22.88%和22.45%,对Cd的积累比例为17.57%;墨西哥落羽杉枝条对Cu、Pb的积累比例分别为49.14%、26.69%,叶片对Mn的积累比例达23.98%(表 5)。
表 5 4个树种各部位重金属积累量
Table 5. Heavy metals accumulation in each part of different tree species
树种
Species部位
Organ重金属积累量Heavy metals accumulation /(mg·Plant -1) Cd Zn Pb Cu Mn 水紫树
N. aquatica根部Root 1.35±0.59 c 22.31±11.67 b 2.57±1.88 b 6.39±2.80 c 53.84±13.25 b 主干Stem 0.66±0.47 c 19.02±8.04 b 2.84±1.68 c 7.57±0.90 b 90.42±19.74 b 枝条Branch 0.26±0.16 b 8.75±4.88 c 0.93±0.48 b 2.92±1.83 b 46.18±33.65 a 叶片Leaf 0.13±0.08 b 5.27±2.68 b 0.92±0.68 c 1.32±0.69 b 115.85±54.73 a 总量Total 2.40±0.95 c 55.35±22.34 b 7.26±3.25 b 18.20±5.32 b 306.29±108.75 a 杞柳‘微山湖’
S. interga ‘Weishanhu’根部Root 108.78±26.53 a 1 061.78±362.40 a 32.76±9.91 a 65.14±27.22 a 194.90±78.43 a 主干Stem 230.51±82.09 a 1 930.75±854.40 a 34.99±17.46 b 148.97±72.85 a 160.07±93.21 b 枝条Branch 42.02±18.82 a 355.51±152.39 a 5.80±2.83 b 26.95±14.34 b 55.32±22.30 a 叶片Leaf 81.29±40.24 a 993.28±467.64 a 8.64±2.99 b 20.79±6.89 a 118.79±34.14 a 总量Total 462.58±149.20 a 4 341.32±1 619.41 a 82.19±29.95 a 261.86±116.73 a 529.08±210.23 a 沙柳
S. psammophila根部Root 70.13±76.04 ab 1 209.24±1 139.54 a 34.48±21.17 a 49.78±44.86 ab 152.86±123.23 ab 主干Stem 117.87±55.88 b 2 266.09±1 104.97 a 58.36±24.66 a 156.04±79.17 a 334.70±224.84 a 枝条Branch 12.32±11.63 b 185.32±172.02 b 8.82±5.48 ab 21.57±13.61 b 51.94±35.55 a 叶片Leaf 2.07±1.46 b 49.30±35.25 b 5.31±2.34 b 5.18±2.35 b 38.14±17.07 b 总量Total 202.39±142.34 b 3 709.95±2 425.22 a 106.97±47.67 a 232.57±131.05 a 577.64±368.97 a 墨西哥落羽杉
T. mucronatum根部Root 25.13±27.44 bc 602.57±530.44 ab 33.61±29.71 a 21.10±9.66 bc 139.74±91.80 ab 主干Stem 3.50±0.97 c 141.73±35.16 b 9.87±5.78 c 42.51±22.85 b 100.88±76.33 b 枝条Branch 2.30±1.51 b 151.04±92.11 bc 20.44±18.50 a 78.32±53.19 a 32.41±18.29 a 叶片Leaf 0.84±0.27 b 76.08±25.25 b 12.65±3.72 a 17.46±5.02 a 86.14±25.04 a 总量Total 31.77±29.67 c 971.42±643.36 b 76.57±41.11 a 159.39±79.85 a 359.17±198.78 a 各树种地上部重金属积累量相对较高,除水紫树对Cd、Zn,落羽杉对Cd、Zn、Pb地上部积累量占积累总量 < 60.00%外,其它情况地上部的积累量均超过积累总量的60.00%,沙柳地上部每种重金属积累量都超过积累总量的60.00%。水紫树对Mn和墨西哥落羽杉对Cu的地上部积累量超过积累总量的80.00%。
不同植物的重金属积累总量差异明显, 杞柳‘微山湖’对Cd、Zn和Cu的积累总量最大,达到462.58、4 341.32、261.86 mg·株-1;沙柳对Pb、Mn的积累总量最大,分别为106.97、577.64 mg·株-1。
-
按照表 6中各树种的栽植密度,在6 a的生长周期内,杞柳‘微山湖‘对重金属污染土壤的重金属迁移量总体较高,对Cd、Zn、Pb、Cu、Mn的迁移量分别达到3.70、34.73、0.66、2.10、4.23 kg·hm-2,沙柳对Zn的迁移量可达22.26 kg·hm-2,水紫树在4 a内对Mn的迁移量达到3.80 kg·hm-2。
表 6 4个树种的重金属修复效益估算
Table 6. The remediation effect of different tree species
树种Species 种植密度Density /(Plants·hm-2) 迁移总量Removal /(kg·hm-2) Cd Zn Pb Cu Mn 水紫树N. aquatica 12 000 0.03 0.66 0.09 0.22 3.68 杞柳‘微山湖’ S. interga ‘Weishanhu’ 8 000 3.70 34.73 0.66 2.10 4.23 沙柳S. psammophila 6 000 1.21 22.26 0.64 1.40 3.47 墨西哥落羽杉T. mucronatum 3 000 0.10 2.91 0.23 0.48 1.08 -
对水紫树和墨西哥落羽杉重金属耐受力和积累能力的研究尚未有报道。在本研究土壤重金属浓度下,2个树种均没有出现明显中毒现象,表明这2个树种都能适应严重Cd污染、中度Zn污染以及轻微Pb污染的土壤环境。水紫树对Mn、杞柳‘微山湖’、沙柳对Zn和Cd、墨西哥落羽杉对Cu分别有较强的富集和转运能力,表现在该树种中某重金属含量高于其它树种,同时转运系数及富集系数相对较高,重金属积累总量及地上部积累量相对较高。虽然土壤Mn浓度未达到污染,但通过对其植物中含量的分析也可以观察Mn的积累和转运趋势。墨西哥落羽杉枝条对Cu、Pb的积累量分别占植物体积累总量的49.14%、26.69%,叶部对Mn的积累量也较大。水紫树各部位Mn的浓度都远大于其它几个树种,其富集系数在几个树种间最高,而转运系数更达到2.34,但因为极低的生物量导致积累总量排在第4位,不过也是几种重金属中与其它树种差距最小的一种,而且叶部对Mn的积累量占积累总量的36.54%,随着水紫树继续生长,对Mn的积累可能会有较大潜力;虽然水紫树对其它几种重金属转运系数也较高,但树体内含量较低,不具备植物修复的潜力。
本研究中, 沙柳和杞柳‘微山湖’对重金属污染土壤有较强适应能力,并且对重金属有较强的转运积累能力。已有研究同样表明了柳树对Cd和Zn具有较大的修复潜力,Migeon等将多种木本植物在重金属污染土地上进行田间试验发现,对Cd和Zn转运积累效果最好的是杂交杨(P. trichocarpa × P. deltoids、P. tremula × P. tremuloides、P. deltoides × P. nigra)和白柳(S. alba L.)及黄花柳(S. caprea L.)[20];张春燕等发现,6个柳树(苏柳2205、苏柳61-1、苏柳795等)品种在Cd、Zn、Pb复合污染土壤中生长3个月后,其Cd、Zn的转运系数分别为0.67~1.96、0.78~4.08,Pb仅为0.04~0.08[14]。本研究中,2种柳树Cd、Zn、Pb转运系数均值分别为0.65、0.66、0.41,Pb转运系数远大于前者,原因可能是前者土壤中Pb含量极高,植物体内重金属含量会随土壤重金属含量升高而升高,但转运效率随之降低。杨卫东等通过水培试验发现,3个杞柳品种在水体中Cd浓度10 μmol·L-1时,形态表现出对Cd的高忍耐性,3个杞柳品种对Cd的忍耐和积累没有显著差异[21]。
柳树属于速生树种,短生长期内生物量增加速度与同龄树种相比有明显优势。沙柳和杞柳‘微山湖’在5种重金属积累总量比较中都排在4个树种前2位,尤其是对Cd和Zn的迁移量巨大。Van Slycken等采用不同柳树品种进行田间试验得出的结论与本文结果相近,即柳树具有用于重金属污染修复的巨大潜力,且品种间生物量和重金属积累能力有显著差异[22]。本研究中,2种柳树在栽种密度低于Van Slycken等所用密度的情况下,对Cd和Zn的积累量依然明显高于前者所用的大多数品种。在植株体内重金属含量差异不大的情况下,本研究中单株柳树生物量要远大于前者每年轮伐累计产生的生物量,导致这个现象的原因可能是品种差异和植物生长年限较长,生物量增加会对体内重金属产生稀释效应[23],但二者综合作用下,在本研究的生长期内植株重金属积累总量依然明显增加。这说明如果能够在栽种密度、轮伐时间上加以优化,并改善栽培条件,可以更大程度地增加其生物量,从而强化其对重金属的积累能力和修复效果。
-
(1) 在研究区淹水土壤Cd、Zn、Pb分别达到重度污染、中度污染、轻度污染的复合污染情况下,沙柳、杞柳‘微山湖’、墨西哥落羽杉和水紫树4个树种能够维持生长,表现出较强的重金属耐性。
(2) 供试4个树种生物量差异明显,2种柳树生物量具有一定优势,各树种地上部生物量均超过单株总生物量的70.00%,较高的地上部生物量比例是重金属有效积累富集到地上部的基础。
(3) 4个树种对重金属积累能力有明显差异,同一树种对不同重金属积累能力也不同。沙柳和杞柳‘微山湖’对Cd和Zn具有较强的积累能力,有应用于重金属污染土壤树木修复的潜力。在土壤Cu污染较轻和Mn未达到污染等级的情况下,墨西哥落羽杉和水紫树表现出较强的Cu和Mn积累和转运能力,但这2个树种是否适用于Cu污染和Mn污染的土地(湿地)修复还需要进一步验证。4个树种树体内Pb含量接近且较低,均不适合用于Pb污染修复。
淹水土壤中4个耐水湿树种的重金属积累能力
Heavy Metal Accumulation in Four Flooding-Tolerant Tree Species Grown in Flooded Soil
-
摘要:
目的 比较研究4个耐水湿树种沙柳、杞柳‘微山湖’、水紫树和墨西哥落羽杉在浙江杭州一处重金属污染稻田中的生长情况和重金属积累能力,为重金属污染土地的树木修复提供依据。 方法 实地采样,测定树木各项生长指标,用电感耦合等离子体质谱仪和电感耦合等离子体发射光谱仪测定土样和树木不同部位中重金属含量,分析比较不同树种的重金属耐受力和积累能力。 结果 表明:在土壤Cd、Zn、Pb、Cu不同污染程度下,4个树种能够维持生长,表现出较强的适应性。不同树种对重金属的积累能力存在差异,杞柳‘微山湖’对Cd、Zn、Cu的积累量最大,分别为462.58、4 341.32、261.86 mg·株-1,沙柳对Pb、Mn积累量最大,分别为106.97、577.61 mg·株-1。在当地栽植密度下,经过6 a的生长,杞柳‘微山湖’对Cd、Zn、Pb、Cu、Mn迁移量分别达到3.70、34.73、0.66、2.10、4.23 kg·hm-2,沙柳对Zn迁移量达到22.26 kg·hm-2,水紫树在4 a内对Mn迁移量达到3.80 kg·hm-2。 结论 沙柳和杞柳‘微山湖’对Cd和Zn具有较强的积累能力,水紫树和墨西哥落羽杉分别对Mn和Cu污染的淹水土地具有修复潜力。 Abstract:Objective To compare the growth and ability of heavy metal accumulation in four flooding-tolerant tree species (Salix interga 'Weishanhu', S. psammophila, Nyssa aquatica, and Taxodium mucronatum) through a field experiment. Method By filed sampling, the growth indexes of different tree species were investigated, and the heavy metal contents in different parts of trees and soil samples were determined by ICP-MS and ICP-AES. Result The results show that the four tree species could maintain normal growth and showed relative strong adaptability in the soil polluted by Cd, Zn, Cu and Pb at different degrees. The ability of heavy metal accumulation varied among tree species. S. interga 'Weishanhu' showed the maximum total accumulation of Cd, Zn and Cu (462.58, 4 341.32,261.86 mg·plant-1). S. psammophila showed the maximum total accumulation of Pb and Mn (106.97,577.61 mg·plant-1). Under the local planting density, after six years of growth, S. interga 'Weishanhu' removed Cd 3.70, Zn 34.73, Pb 0.66, Cu 2.10, Mn 4.23 kg·hm-2 respectively, S. psammophila removed 22.26 kg Zn per hectare, N. aquatica removed 3.80 kg Mn per hectare in the past four years. Conclusion This study shows that S. psammophila and S. interga 'Weishanhu' have advantage on accumulating Cd and Zn, N. aquatica and T. mucronatum have potential ability on remediating Mn and Cu contaminated soil, respectively. -
Key words:
- tree
- / soil
- / heavy metals
- / accumulation
- / remediation
-
表 1 土壤理化性质
Table 1. Physical and chemical properties of soil
理化性质
Physicochemical propertiesA区
Block AB区
Block BC区
Block CD区
Block DpH值 8.03±0.11 a 7.96±0.06 a 7.49±0.13 b 7.58±0.09 b 有机质Organic matter/(g·kg-1) 54.36±6.20 b 52.80±7.19 b 75.26±12.91 a 75.82±9.69 a 全氮Total nitrogen/(g·kg-1) 3.04±0.30 b 2.95±0.33 b 3.97±0.78 a 4.05±0.46 a 全磷Total phosphors/(g·kg-1) 1.05±0.06 a 1.03±0.05 a 1.03±0.12 a 1.09±0.08 a 全钾Total potassium/(g·kg-1) 6.95±0.43 a 7.21±0.72 a 5.62±0.08 b 5.03±0.32 b 水解氮Hydrolytic N/(mg·kg-1) 249.60±73.11 b 223.80±35.34 b 371.40±91.93 a 342.80±58.50 a 有效磷Available P/(mg·kg-1) 16.32±2.35 b 15.04±1.69 b 35.34±12.60 a 42.76±13.26 a 速效钾Available K/(mg·kg-1) 54.70±12.44 b 57.72±12.31 b 149.16±49.22 a 140.20±24.04 a Cd/(mg·kg-1) 11.22±4.68 c 15.61±8.76 bc 35.44±19.29 ab 55.00±22.72 a Zn/(mg·kg-1) 508.60±128.64 b 631.40±243.45 b 1 198.40±579.19 ab 1 662.80±829.11 a Pb/(mg·kg-1) 70.88±10.90 b 76.36±19.73 b 126.44±51.00 b 229.80±93.54 a Cu/(mg·kg-1) 40.94±3.33 b 42.62±6.07 b 74.26±24.28 a 79.20±25.53 a Mn/(mg·kg-1) 479.40±55.00 b 536.60±56.92 ab 497.60±23.44 ab 542.80±44.37 a Cr/(mg·kg-1) 44.28±1.98 a 46.58±2.23 a 38.34±2.27 b 34.38±3.41 c Ni/(mg·kg-1) 24.20±0.54 a 25.28±1.23 a 24.70±3.04 a 23.10±3.33 a 注:不同小写字母表示不同地块土壤同一指标差异显著(P < 0.05)。
Note: Different small letters indicate significant differences among the same index between different soil plots (P < 0.05). 下载: 导出CSV
表 2 4个树种生长情况
Table 2. Growth indices of different tree species
树种
Species基径
Basal diameter/cm胸径
Breast diameter/cm高度
Height/m生物量
Biomass/(kg·株-1)沙柳S. psammophila 14.60±2.30 b 10.60±2.10 a 12.18±3.19 a 35.44±14.77 a 杞柳‘微山湖’ S. interga ‘Weishanhu’ -- -- 4.25±0.09 b 23.53±9.63 ab 墨西哥落羽杉T. mucronatum 17.50±2.37 a 10.10±1.56 a 5.09±0.32 b 19.41±7.05 b 水紫树N. aquatica 6.72±0.81 c 4.34±0.66 b 3.75±0.29 b 1.94±0.42 c 注:不同小写字母代表不同树种同一指标差异显著(P < 0.05),水紫树是第4年生长数据,其它树种是第6年数据。
Note: Different small letters indicate significant differences among the same index between different tree species (P < 0.05), the data of N. aquatica 4 years, the other species is 6 years.
下载: 导出CSV
表 3 树木各部位重金属含量
Table 3. Heavy metals concentration in each part of different tree species
树种
Species部位
Organ重金属含量Heavy metals concentration/(mg·kg-1) Cd Zn Pb Cu Mn 水紫树
N. aquatica根Root 2.36±0.68 c 38.43±13.13 b 4.27±2.69 b 11.10±0.67 ab 111.35±66.48 a 主干Stem 0.73±0.55 c 20.84±9.71 c 3.18±2.06 a 8.23±1.34 a 98.88±27.03 a 枝条Branch 0.91±0.22 bc 31.20±4.81 c 3.38±0.51 ab 10.39±2.42 bc 161.48±56.03 a 叶Leaf 0.73±0.34 b 29.60±5.36 b 4.99±1.99 b 7.37±1.58 c 685.00±242.38 a 杞柳‘微山湖’
S. interga ‘Weishanhu’根Root 25.02±8.19 a 225.60±34.11 a 7.09±1.24 ab 13.48±0.93 a 40.96±5.96 b 主干Stem 15.66±2.32 a 128.60±14.98 a 2.25±0.64 ab 9.63±0.92 a 10.36±2.47 b 枝条Branch 20.72±4.80 a 173.80±30.63 a 2.77±0.45 b 12.81±3.27 b 27.46±2.23 b 叶Leaf 57.62±18.81 a 691.00±186.41 a 6.22±0.78 b 14.88±1.08 a 86.16±5.17 b 沙柳
S. psammophila根Root 12.47±7.27 b 232.20±116.41 a 7.01±2.74 ab 8.68±3.81 bc 27.20±10.09 b 主干Stem 4.44±1.54 b 83.26±18.09 b 2.17±0.44 ab 5.47±0.96 b 12.05±4.31 b 枝条Branch 4.14±1.06 b 61.88±13.49 b 3.77±1.51 ab 8.56±0.96 c 19.84±3.63 b 叶Leaf 4.27±1.62 b 100.02±34.88 b 12.53±5.92 a 11.38±1.14 b 85.96±16.54 b 墨西哥落羽杉
T. mucronatum根Root 6.48±5.02 bc 172.86±94.97 a 10.09±6.81 a 6.75±1.22 c 41.72±14.89 b 主干Stem 0.35±0.03 c 14.30±1.46 c 0.97±0.51 b 4.17±1.41 b 9.02±4.62 b 枝条Branch 0.59±0.10 c 39.64±8.39 bc 4.69±1.79 a 19.56±3.78 a 8.56±1.08 b 叶Leaf 0.35±0.05 b 31.80±5.12 b 5.43±1.31 b 7.38±1.08 c 36.00±3.71 b 注:不同小写字母代表不同树种同一部位指标差异显著(P < 0.05),下同。
Note: Different small letters indicate significant differences among the same index of the same part between different tree species (P < 0.05), the same below.
下载: 导出CSV
表 4 4个树种不同部位的重金属生物富集系数及转运系数
Table 4. BCFs and TFs in each part of different tree species
树种Species 项目Item Cd Zn Pb Cu Mn 水紫树
N. aquatica富集系数
BCF根部Root 0.29±0.19 b 0.08±0.03 b 0.07±0.05 ab 0.28±0.01 a 0.23±0.13 a 主干Stem 0.08±0.08 b 0.05±0.03 b 0.05±0.03 a 0.20±0.04 a 0.20±0.04 a 枝条Branch 0.10±0.05 b 0.07±0.02 b 0.05±0.01 a 0.26±0.07 a 0.33±0.08 a 叶片Leaf 0.07±0.03 b 0.06±0.02 b 0.07±0.04 ab 0.18±0.05 b 1.41±0.40 a 转运系数TF 0.38±0.28 b 0.73±0.40 a 1.16±0.71 a 0.81±0.15 b 2.34±1.12 a 杞柳‘微山湖’
S. interga ‘Weishanhu’富集系数
BCF根部Root 2.26±1.76 a 0.40±0.16 a 0.10±0.03 a 0.32±0.04 a 0.08±0.02 b 主干Stem 1.36±0.94 a 0.24±0.13 a 0.03±0.01 ab 0.23±0.03 a 0.02±0.00 b 枝条Branch 1.76±1.03 a 0.31±0.12 a 0.04±0.01 ab 0.30±0.07 a 0.05±0.01 b 叶片Leaf 4.94±3.09 a 1.24±0.54 a 0.09±0.02 a 0.35±0.04 a 0.16±0.02 b 转运系数TF 0.89±0.15 a 0.89±0.08 a 0.40±0.09 b 0.79±0.07 b 0.53±0.06 b 沙柳
S. psammophila富集系数
BCF根部Root 0.45±0.40 b 0.22±0.15 b 0.06±0.02 b 0.13±0.08 b 0.05±0.02 b 主干Stem 0.14±0.06 b 0.08±0.03 b 0.02±0.01 b 0.08±0.03 b 0.02±0.01 b 枝条Branch 0.15±0.09 b 0.06±0.03 b 0.03±0.01 b 0.12±0.03 b 0.04±0.01 b 叶片Leaf 0.16±0.12 b 0.11±0.07 b 0.11±0.04 a 0.17±0.05 b 0.17±0.04 b 转运系数TF 0.41±0.14 b 0.42±0.18 b 0.42±0.17 b 0.80±0.39 b 0.63±0.35 b 墨西哥落羽杉
T. mucronatum富集系数
BCF根部Root 0.13±0.09 b 0.11±0.08 b 0.04±0.02 b 0.09±0.03 b 0.08±0.03 b 主干Stem 0.01±0.00 b 0.01±0.01 b 0.01±0.01 b 0.06±0.04 b 0.02±0.01 b 枝条Branch 0.01±0.01 b 0.03±0.01 b 0.03±0.02 b 0.28±0.12 a 0.02±0.00 b 叶片Leaf 0.01±0.00 b 0.02±0.01 b 0.03±0.02 b 0.10±0.03 c 0.07±0.01 b 转运系数TF 0.10±0.06 c 0.19±0.14 b 0.45±0.36 b 1.32±0.40 a 0.38±0.15 b
下载: 导出CSV
表 5 4个树种各部位重金属积累量
Table 5. Heavy metals accumulation in each part of different tree species
树种
Species部位
Organ重金属积累量Heavy metals accumulation /(mg·Plant -1) Cd Zn Pb Cu Mn 水紫树
N. aquatica根部Root 1.35±0.59 c 22.31±11.67 b 2.57±1.88 b 6.39±2.80 c 53.84±13.25 b 主干Stem 0.66±0.47 c 19.02±8.04 b 2.84±1.68 c 7.57±0.90 b 90.42±19.74 b 枝条Branch 0.26±0.16 b 8.75±4.88 c 0.93±0.48 b 2.92±1.83 b 46.18±33.65 a 叶片Leaf 0.13±0.08 b 5.27±2.68 b 0.92±0.68 c 1.32±0.69 b 115.85±54.73 a 总量Total 2.40±0.95 c 55.35±22.34 b 7.26±3.25 b 18.20±5.32 b 306.29±108.75 a 杞柳‘微山湖’
S. interga ‘Weishanhu’根部Root 108.78±26.53 a 1 061.78±362.40 a 32.76±9.91 a 65.14±27.22 a 194.90±78.43 a 主干Stem 230.51±82.09 a 1 930.75±854.40 a 34.99±17.46 b 148.97±72.85 a 160.07±93.21 b 枝条Branch 42.02±18.82 a 355.51±152.39 a 5.80±2.83 b 26.95±14.34 b 55.32±22.30 a 叶片Leaf 81.29±40.24 a 993.28±467.64 a 8.64±2.99 b 20.79±6.89 a 118.79±34.14 a 总量Total 462.58±149.20 a 4 341.32±1 619.41 a 82.19±29.95 a 261.86±116.73 a 529.08±210.23 a 沙柳
S. psammophila根部Root 70.13±76.04 ab 1 209.24±1 139.54 a 34.48±21.17 a 49.78±44.86 ab 152.86±123.23 ab 主干Stem 117.87±55.88 b 2 266.09±1 104.97 a 58.36±24.66 a 156.04±79.17 a 334.70±224.84 a 枝条Branch 12.32±11.63 b 185.32±172.02 b 8.82±5.48 ab 21.57±13.61 b 51.94±35.55 a 叶片Leaf 2.07±1.46 b 49.30±35.25 b 5.31±2.34 b 5.18±2.35 b 38.14±17.07 b 总量Total 202.39±142.34 b 3 709.95±2 425.22 a 106.97±47.67 a 232.57±131.05 a 577.64±368.97 a 墨西哥落羽杉
T. mucronatum根部Root 25.13±27.44 bc 602.57±530.44 ab 33.61±29.71 a 21.10±9.66 bc 139.74±91.80 ab 主干Stem 3.50±0.97 c 141.73±35.16 b 9.87±5.78 c 42.51±22.85 b 100.88±76.33 b 枝条Branch 2.30±1.51 b 151.04±92.11 bc 20.44±18.50 a 78.32±53.19 a 32.41±18.29 a 叶片Leaf 0.84±0.27 b 76.08±25.25 b 12.65±3.72 a 17.46±5.02 a 86.14±25.04 a 总量Total 31.77±29.67 c 971.42±643.36 b 76.57±41.11 a 159.39±79.85 a 359.17±198.78 a
下载: 导出CSV
表 6 4个树种的重金属修复效益估算
Table 6. The remediation effect of different tree species
树种Species 种植密度Density /(Plants·hm-2) 迁移总量Removal /(kg·hm-2) Cd Zn Pb Cu Mn 水紫树N. aquatica 12 000 0.03 0.66 0.09 0.22 3.68 杞柳‘微山湖’ S. interga ‘Weishanhu’ 8 000 3.70 34.73 0.66 2.10 4.23 沙柳S. psammophila 6 000 1.21 22.26 0.64 1.40 3.47 墨西哥落羽杉T. mucronatum 3 000 0.10 2.91 0.23 0.48 1.08
下载: 导出CSV
-
[1] 张雯, 魏虹, 孙晓灿, 等.镉在土壤-金丝垂柳系统中的迁移特征[J].生态学报, 2013, 33(19):6147-6153. [2] Ali H, Khan E, Sajad M A. Phytoremediation of heavy metals-Concepts and applications[J]. Chemosphere, 2013, 91(7):869-881. doi: 10.1016/j.chemosphere.2013.01.075 [3] Greipsson S. Phytoremediation[J]. Nature Education Knowledge, 2011, 3(1):643-668. [4] Sarma H. Metal hyperaccumulation in plants:a review focusing on phytoremediation technology[J]. Journal of Environmental Science and Technolgy, 2011, 4(2):118-138. doi: 10.3923/jest.2011.118.138 [5] Singh A, Prasad S M. Reduction of heavy metal load in food chain:technology assessment[J]. Review of Environmental Science and Bio/Technology, 2011, 10(3):199-214. doi: 10.1007/s11157-011-9241-z [6] 柯文山, 席红安, 杨毅, 等.大冶铜绿山款曲海州香薷(Elsholtzia haichowensis)植物地球化学特征分析[J].生态学报, 2001, 21(6):907-912. doi: 10.3321/j.issn:1000-0933.2001.06.008 [7] 陈同斌, 韦朝阳, 黄泽春, 等.砷超富集植物蜈蚣草及其对砷的富集特征[J].科学通报, 2002, 47(3):207-210. doi: 10.3321/j.issn:0023-074X.2002.03.011 [8] Wei S H, Clark G, Doronila A I, et al. Cd hyperaccumulative characteristics of Australia ecotype Solanum nigrum L. and its implication in screening hyperaccumulator[J]. International Journal of Phytoremediation, 2013, 15(3):199-205. doi: 10.1080/15226514.2012.687019 [9] 周杰良, 葛大兵, 李树战, 等.藤本植物中具镉超积累特征植物的筛选[J].林业科学研究, 2016, 29(4):515-520. doi: 10.3969/j.issn.1001-1498.2016.04.007 [10] Wuana R A, Okieimen F E. Heavy metals in contaminated soils:A review of sources, chemistry, risks and best available strategies for remediation[J]. ISRN Ecology, 2011, 2011:1-20. doi:10.5402/2011/402647. [11] Robinson B H, Mills T M, Petit D, et al. Natural and induced cadmium-accumulation in poplar and willow:Implications for phytoremediation[J]. Plant and Soil, 2000,227(1/2):301-306. doi: 10.1023/A:1026515007319 [12] Hammer D, Kayser A, Keller C. Phytoextraction of Cd and Zn with Salix viminalis in field trials.[J]. Soil Use & Management, 2003, 19(3):187-192. [13] Jensen J K, Holm P E, Nejrup J, et al. The potential of willow for remediation of heavy metal polluted calcareous urban soils[J]. Environmental Pollution, 2009,157(3):931-937. doi: 10.1016/j.envpol.2008.10.024 [14] 张春燕, 王瑞刚, 范稚莲, 等.杨树和柳树富集Cd、Zn、Pb的品种差异性[J].农业环境科学学报, 2013, 32(3):530-538. [15] 柴世伟, 温琰茂, 张亚雷, 等.地积累指数法在土壤重金属污染评价中的应用[J].同济大学学报:自然科学版, 2006, 34(12):1657-1661. [16] 张江华, 赵阿宁, 王仲复, 等.内梅罗指数和地质累积指数在土壤重金属评价中的差异探讨-以秦小岭金矿带为例[J].黄金, 2010, 8(31):43-46. [17] Zhang C, Shuang N, Jie L, et al. Effects of heavy metals and soil physicochemical properties on wetland soil microbial biomass and bacterial community structure[J]. Science of the Total Environment, 2016,557-558:785-790. doi: 10.1016/j.scitotenv.2016.01.170 [18] 国家环境保护局. GB/T 15618-1995土壤环境质量标准[S].北京: 中国标准出版社, 1995. [19] 汪庆华, 董岩翔, 周国华, 等.浙江省土壤地球化学基准值与环境背景值[J].生态与农村环境学报, 2007, 23(2):81-88. doi: 10.3969/j.issn.1673-4831.2007.02.017 [20] Migeon A, Richaud P, Guinet F, et al. Metal accumulation by woody species on contaminated sites in the north of France[J]. Water, Air, and Soil Pollution, 2009,204(1-4):89-101. doi: 10.1007/s11270-009-0029-5 [21] 杨卫东, 陈益泰.不同杞柳品种对镉(Cd)吸收与忍耐的差异[J].林业科学研究, 2008, 21(6):851-867. [22] Van Slycken S, Witters N, Meireesonne L, et al. Field evaluation of willow under short rotation coppice for phytomanagement of metal-polluted agricultural soils[J]. International Journal of Phytoremediation, 2013, 15(7):667-689. [23] Jin H P, Choppala G K, Bolan N S, et al. Biochar reduces the bioavailability and phytotoxicity of heavy metals[J]. Plant and Soil, 2011,348(1):439. -

 点击查看大图
计量
- 文章访问数: 3758
- HTML全文浏览量: 1767
- PDF下载量: 10
- 被引次数: 0
