

-
物种分布模型主要利用物种的分布数据(存在或缺席)和环境数据来估算物种的生态位, 并以概率形式反映物种适生区分布,其结果可解释为物种存在概率、物种丰富度、生境适宜性等[1],已在预测植物病害、物种、群落或生态系统分布,评估气候、土地利用和其他环境变化对物种分布[2]及物种入侵、扩散风险[3]等方面进行了研究;另在寻找未知区域中珍稀濒危物种的高度适生区[4], 自然保护区选址[5], 确定物种保护区范围[6]和引种目标区域[7]中广泛应用。
基于MaxEnt模型对分布数据要求不严,预测结果稳定可靠、直观,可用Jackknifetest来评估各个环境变量对模型的贡献率等优点[5],本研究选用MaxEnt模型,并通过以下途径模拟毛红椿的适生区分布:(1)选择与物种分布密切相关的关键环境变量;(2)量化物种生境和选定的环境变量(包括位置、地形变量和生物气候变量)之间的关系;(3)推算当代(1950—2000年)在云南省的适生区分布情况;(4)预测未来全球气候变暖(2050S、2070S, RCP2.6情景)情况下在云南省的适生区分布情况;(5)预测全国当代及未来全球气候变暖(2050S、2070S, RCP2.6情景)情况下的适生区分布情况。
-
云南省位于中国西南部(21°8′~29°15′N, 97°31′~106°11′ E),总面积大约390 000 km2,北高南低, 南北之间温差显著,气候在区域和海拔高度间差异较大。年温差较小,日温差大,干湿季节分明(冬春干旱,夏秋多雨);云南大部分地区年降水量约1 100 mm,南部降水量可达1 600 mm,有些河谷飞地(如干热河谷)则不到800 mm。特殊的地理位置和复杂的自然环境, 决定了云南省野生动植物物种丰富,生态系统类型复杂多样,有许多特有属、种,以及特别稀有的濒危物种和独特的生态系统类型,其中,分布有超过半数的中国高等植物和67.5%的中国稀有物种。云南生物多样性居国内之首,是中国生物多样性最重要的地区之一, 也是全球生物多样性研究的热点地区,已引起国内外同行的广泛关注[7]。
-
毛红椿(Toona ciliata var. pubescens)是红椿(T. ciliata)的5个变种之一, 与其它变种最明显的区别为小叶背面、叶轴、花密被柔毛, 叶脉甚密, 蒴果先端浑圆型。因材质优良,被国人称为“中国桃花心木”,但由于人为或环境因素的影响,导致野生资源日益枯竭,被我国列入第一批濒危保护植物名录[8]。
-
于2015年7—9月,依据《云南植物志》[9]和《云南树木图志》[10]对毛红椿分类特征的描述进行实际分布情况调查。地势平坦地带每80~100 km调查记录1次(种名和经纬度),而在海拔变化较大的山区, 海拔每变化50~80 m调查记录1次。局部小区域内(面积约1 hm2)自然分布有30~50株,其中有若干胸径大于60 cm个体的认为是毛红椿原生分布区,共获得17个分布点数据,并在Excel中整理成只包含有物种名(拉丁名)、经度、纬度的CRV格式文件。
-
环境变量对于定义一个物种的生态位是非常有生物学意义的[5-7]。云南和全国当代、未来(2050S、2070S,RCP2.6情景)的气候数据从http://www.worldclim.org下载。该模型中应用的环境数据均为30弧秒空间分辨率(为1 km2网格)。从国家基础地理信息系统平台(http://nfgis.nsdi.gov.cn)下载云南省和中国数字地图, 并应用arcgis 10在相应环境图层中提取云南省和中国行政区的环境数据, arcgis 10在后继的分布区面积计算中也有应用。为了消除变量之间多重线性相关, 建立一个具有较少变量、性能更好的预测模型,本研究选用毛红椿17个分布记录地的20个因子中相关系数R大于0.8的变量,用来构建其适生区分布模型[7, 11]。
-
将毛红椿分布点文件(CRV格式)作为样点,云南省行政范围内当代分布点间相关系数大于0.8的环境变量作为样点环境图层导入MaxEnt v 3.3.3,构建毛红椿适生区分布的MaxEnt模型。以全国当代、未来(2050S、2070S)的环境图层作为预测目标图层,结果包含了毛红椿在全国和云南省的适生区分布情况。最大叠代次数设为5 000次及25%分布点作为随机测试集外,其它为系统默认设置,并参照周天华[12]的方法划分毛红椿的非适生区及适生区(低、中、高度适生区)。
-
在17个毛红椿分布点20个环境因子间的相关系数R(表 1)中,alti、bio 11、bio 15、bio 16、bio 17、bio 19、bio 9等7个环境因子间的相关系数大于0.8,用此7个环境变量构建毛红椿适生区分布模型,预测该物种在云南省和全国(当代,未来)气候条件下的适生区分布及面积。
表 1 环境因子间的相关系数
Table 1. Correlation coefficient between environmental variables
alti bio 1 bio 10 bio 11 bio 12 bio 13 bio 14 bio 15 bio 16 bio 17 bio 18 bio 19 bio 2 bio 3 bio 4 bio 5 bio 6 bio 7 bio 8 bio 9 alti 1.00 bio 1 -0.66 1.00 bio 10 -0.59 0.77 1.00 bio 11 -0.95 0.99 0.98 1.00 bio 12 -0.46 0.33 0.28 0.34 1.00 bio 13 -0.10 -0.03 -0.09 -0.01 0.78 1.00 bio 14 -0.54 0.47 0.42 0.49 0.76 0.34 1.00 bio 15 0.62 -0.54 -0.51 -0.54 -0.76 -0.30 -0.96 1.00 bio 16 -0.28 0.16 0.10 0.18 0.57 0.97 0.54 -0.51 1.00 bio 17 -0.55 0.44 0.40 0.45 0.89 0.53 0.95 -0.96 0.70 1.00 bio 18 -0.24 0.12 0.06 0.14 0.57 0.55 0.54 -0.50 0.48 0.70 1.00 bio 19 -0.56 0.45 0.41 0.46 0.91 0.57 0.94 -0.95 0.73 1.00 0.72 1.00 bio 2 0.02 -0.01 0.05 -0.07 -0.64 -0.55 -0.66 0.54 -0.61 -0.64 -0.63 -0.64 1.00 bio 3 0.16 -0.15 -0.20 -0.07 -0.01 -0.05 0.11 -0.06 -0.01 0.05 0.02 0.00 -0.01 1.00 bio 4 0.13 -0.19 -0.09 -0.30 -0.36 -0.29 -0.45 0.29 -0.37 -0.35 -0.39 -0.33 0.62 -0.59 1.00 bio 5 -0.74 0.72 0.71 0.68 0.13 -0.17 0.25 -0.35 -0.01 0.23 -0.05 0.24 0.17 -0.22 -0.06 1.00 bio 6 -0.62 0.64 0.78 0.79 0.30 -0.04 0.45 -0.51 0.15 0.41 0.12 0.42 -0.09 -0.09 -0.31 0.96 1.00 bio 7 -0.08 0.07 0.15 -0.02 -0.57 -0.47 -0.63 0.49 -0.54 -0.58 -0.58 -0.56 0.89 -0.45 0.82 0.26 -0.03 1.00 bio 8 -0.65 0.66 0.76 0.72 0.28 -0.09 0.42 -0.51 0.10 0.40 0.06 0.41 0.05 -0.20 -0.09 0.66 0.73 0.15 1.00 bio 9 -0.69 0.47 0.63 0.30 0.43 0.06 0.56 -0.62 0.26 0.53 0.23 0.55 -0.14 -0.11 -0.28 0.78 0.77 -0.06 0.70 1.00 注:bio 1,年均气温;bio 2,昼夜温差月均值;bio 3,等温性;bio 4,气温季节性变化的标准差;bio 5,最暖月最高气温;bio 6,最冷月最低气温;bio 7,年均气温变化范围;bio 8,最湿季度平均气温;bio 9,最干季度平均气温;bio 10,最暖季度平均气温;bio 11,最冷季度平均气温;bio 12,年均降水量;bio 13,最湿月降水量;bio 14,最干月降水量;bio 15,降水量变异系数;bio 16,最湿季度降水量;bio 17,最干季度降水量;bio 18,最暖季度降水量;bio 19,最冷季度降水量;alti,海拔。
Note: bio 1, annual mean temperature. bio 2, monthly mean diurnal temperature range. bio 3, isothermality. bio 4, standard deviation of temperature seasonal change. bio 5, max temperature of the warmest month. bio 6, min temperature of the coldest month, bio 7, range of annual temperature., bio 8, mean temperature of the wettest quarter. bio 9, mean temperature of the driest quarter. bio 10, mean temperature of the warmest quarter. bio 11, mean temperature of the coldest quarter. bio 12, annual average precipitation. bio 13, precipitation of the wettest month. bio 14, precipitation of the driest month. bio 15, cv of precipitation. bio 16, precipitation of the wettest quarter. bio 17, precipitation of the driest quarter. bio 18, precipitation of the warmest quarter. bio 19, precipitation of the coldest quarter. alti, altitude. -
研究得到毛红椿适生区分布MaxEnt模型的平均训练AUC值和平均测试AUC值分别为0.891、0.885(图 1),说明该模型对其适生区预测精度达良好水平[13]。
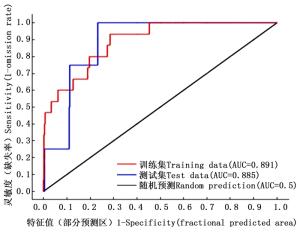
图 1 毛红椿的灵敏度和特征值图
Figure 1. Sensitivity V specificity of T.ciliata var.pubescen
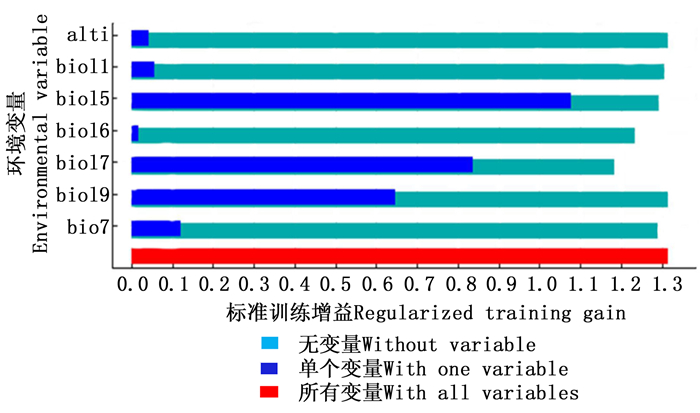
Jackknifetest检验结果(图 2)表明:bio 15提供了非常高的增益, 说明bio 15独立使用时比其他变量包含更多有用信息;bio 17、bio 19有适度增益,而alti、bio 7、bio 11、bio 16在单独使用时增益较低,表明它们包含信息量较少。在此7个环境因子中,bio 15是影响毛红椿适生区分布的最主要环境因子,对MaxEnt模型的贡献率达69.4%;其次是bio 17、bio 16、bio 7、bio 11、bio 19,对模型的贡献率分别为21.9%、4.0%、3.7%、0.6%、0.4%(表 2)。

图 2 标准训练增益
Figure 2. Regularized training gains
表 2 环境因子对最大熵模型的贡献率
Table 2. Contributions of the environmental variables to the Maxent model
环境因子
Environmental
variables贡献率
Contribution/
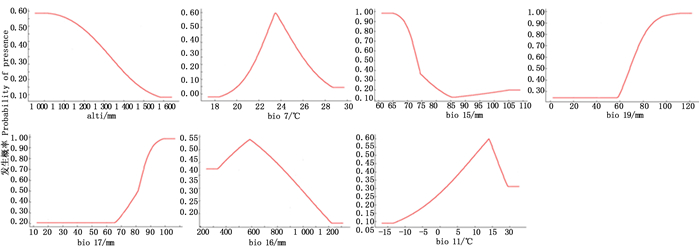
%bio 15 69.4 bio 16 4.0 bio 11 0.6 alti 0 bio 17 21.9 bio 7 3.7 bio 19 0.4 从环境因子对最大熵模型的贡献率(表 2)看出:海拔(alti)对毛红椿适生区分布模型的贡献率为0,表明海拔对毛红椿适生区分布没有直接影响,这与海拔对其它树种适生区分布模型的贡献率较大[14-15]的研究结果不同;但从图 3中海拔(alti)因子响应曲线看,当海拔上升至1 600 m时,分布概率接近于0,所以,可将毛红椿适生区分布海拔限制在1 600 m以下区域,这与实际的毛红椿在云南省的分布范围基本吻合[9-10]。其他环境因子响应曲线(图 3)表明:毛红椿适生区的气候因子条件为年均气温变化范围18.1~28.3℃,最冷季度平均气温大于-10℃,降水量变异系数65%~80%,最湿季度降水量大于350 mm,最干季度降水量大于65 mm,最冷季度降水量大于90 mm;而海拔≤1 000 m、年均气温23.6℃、最冷季度平均气温14.2℃,降水量变异系数≤65%,最湿季度降水量570 mm,最干季度降水量≥100 mm,最冷季度降水量≥120 mm,是毛红椿适生区的气候因子组合。

图 3 7个变量因子响应曲线
Figure 3. Response curves of 7 environmental variables
-
应用毛红椿适生区分布MaxEnt模型模拟结果中10%训练集阈值(0.081),将分布概率低于0.081的区间划为非适生区,而分布概率大于0.081的区间划为适生区,并用自然三等份法将分布区划分低度适生区(0. 081<P≤0.387)、中度适生区(0.387<P≤0.694)和高度适生区(0.694<P≤1)。
-
MaxEnt模型模拟结果(表 3)表明:当代(1995-2000年)毛红椿在云南省的适生区总面积为172 960 km2,占云南省国土面积的40.39%,其中,高度适生区面积3 551 km2,占其适生区总面积的2.05%,集中分布在保山市、怒江州和大理州的怒江和澜沧江流域;中度适生区面积7 651 km2,占其适生区总面积的4.42%,在昆明市(金沙江支流普渡河流域)和玉溪市(元江流域)有一定分布,另在高度适生区周边也分布有一定面积;低度适生区面积161 758 km2,占其适生区总面积的93.52%,广泛分布于云南省各地州(市)的低海拔热区。
表 3 不同时期毛红椿在云南和中国的适生区预测
Table 3. Predicted suitable region for T.ciliata var. pubescens in Yunnan and China under different decade
km2 区域
district年代
Decade总适生区
Total suitable region低度适生区
Lowly suitable region中度适生区
Moderately suitable region高度适生区
Highly suitable region云南Yunnan 1995-2000 172 960 161 758 7 651 3 551 2050S 150 183 146 778 3 328 77 2070S 124 211 121 042 3 080 89 中国China 1995-2000 1 789 119 1 228 113 494 316 66 690 2050S 1 712 146 1 256 661 359 864 95 621 2070S 1 660 252 1 263 923 328 577 67 752 据资料记载,毛红椿在云南省分布于除西双版纳州、大理州、怒江州和楚雄州之外其他12个地州(市)的广大地区,而模型模拟结果则广泛分布于云南全省的16个地州(市)。实际上,本研究组成员在大理州、怒江州进行分布调查和数据收集时也发现这些地区有毛红椿分布,其中,怒江州(泸水县城至让江镇的怒江沿岸)、大理州(西洱河至澜沧江入口)分布较集中。另外,为了验证模型模拟的可靠性和精度,又根据模拟结果,对楚雄州和西双版纳州的毛红椿分布进行了实地调查,结果在金沙江沿岸及支流(龙川江流域)、红河上游的礼社江以及西双版纳州海拔1 600 m以下地区都有分布。
-
21世纪50年代(2050S),毛红椿在云南省的适生区总面积为150 183 km2,是当代的86.83%,其中,高度适生区面积为77 km2,是当代的2.17%,占其适生区总面积的0.05%;中度适生区面积为3 328 km2,是当代的43.50%,占其适生区总面积的2.22%;低度适生区面积为146 778 km2,是当代的90.74%,占其适生区总面积的97.73%。
21世纪70年代(2070S),毛红椿在云南省的适生区总面积为124 211 km2,是当代的71.81%,其中,高度适生区面积仅为89 km2,是当代的2.51%,占其适生区总面积的0.07%;中度适生区面积为3 080 km2,是当代的40.26%,占其适生区总面积的2.48%;低度适生区面积为121 042 km2,是当代的74.83%,占其适生区总面积的97.45%。
-
当代(1995-2000年),毛红椿在中国的适生区总面积为1 789 119 km2,占我国国土面积的18.64%,集中分布于察隅-丽江-西昌-重庆-宜昌-信阳-铜陵-南京-上海市一线以南地区,高度适生区面积66 690 km2,占其适生总面积的3.73%;中度适生区面积494 316 km2, 占其适生总面积的27.63%;低度适生区面积1 228 113 km2,占其适生总面积的68.64%(表 3)。
21世纪50年代(2050S),毛红椿在全国的适生区总面积为1 712 146 km2,是当代的95.70%,其中,高度适区生面积为95 621 km2,是当代的143.38%,占其适生区总面积的5.58%;中度适生区面积为359 864 km2,是当代的72.80%,占其适生区总面积的21.02%;低度适生面积为1 256 661 km2,是当代的102.32%,占其适生区总面积的73.40%。
21世纪70年代(2070S),毛红椿在全国的适生区总面积为1 660 252 km2,是当代的92.80%,其中,高度适生区面积为67 752 km2,是当代的101.59%,占其适生区总面积的4.08%;中度适生区面积为328 577 km2,是当代的66.47%,占其适生区总面积的19.79%;低度适生区面积为1 263 923 km2,是当代的102.92%,占其适生区总面积的76.13%。
-
经计算,毛红椿分布点间降水量变异系数、最干季度降水量、最冷季度降水量、年均气温变化范围、最冷季度平均气温、最湿季度降水量、海拔等7个环境因子的相关系数大于0.8,是该物种适生区分布的限制性因子,其中,海拔对毛红椿适生区分布无直接影响;降水量变异系数和最干季度降水量对MaxEnt模型的贡献率分别为69.4%、21.9%,是影响毛红椿适生区分布的主要因子;最冷季度降水量、年均气温变化范围、最冷季度平均气温、最湿季度降水量对MaxEnt模型的累积贡献率为8.70%,是影响毛红椿适生区分布的次要因子。此外,研究所用毛红椿分布数据来自于云南,而云南地势起伏较大,处于低纬度高原山地,气候条件复杂多样,从全域来说,包含了我国所有气候类型,但海拔高度的变化决定着气候类型更替[16],由此影响着树种分布及植被类型变化。研究结果表明,毛红椿分布于海拔1 600 m以下地区,区域包括绝大部分亚热带气候类型区和一部分热带气候类型区[17],佐证了毛红椿是典型的亚热带树种[9-10]。另外,毛红椿在所分布区域内虽然同时受水分和气温的影响,但它们对毛红椿分布的影响程度是不一样的,降水量变异系数和最干季度降水量的累计贡献率已达91.3%,其他4个环境因子的累计贡献率仅为8.7%。因此,水分因子是影响毛红椿分布的第一因子,这与毛红椿在其分布区内主要生长于水湿条件较好的山脚、沟渠、河滩之地的实际情况比较吻合,也与毛红椿这一速生树种在一定气温条件下对水分条件有较高的要求符合。
-
MaxEnt模型的AUC值(训练和测试)分别为0.891、0.885,其预测精度达良好水平,说明对毛红椿在云南省当代、未来(2050S、2070S)以及全国当代、未来(2050S、2070S)适生区分布预测结果是可靠的。依据MaxEnt模拟的结果,经后续验证性调查,毛红椿在云南省的西双版纳州、大理州、怒江州和楚雄州实有零星分布。在全国区域尺度下,原文献记载西藏自治区、云南省、四川省、湖北省、河南省、安徽省、浙江省等省区以南有毛红椿分布[9-10, 18],而MaxEnt模型模拟的结果反映出在察隅-丽江-西昌-重庆-宜昌-信阳-铜陵-南京-上海市一线以南地区是毛红椿的适生分布区,二者有很好的重合性,其中,江苏省中山植物园于1980年引种毛红椿,至今生长良好[18]。土壤是影响植物分布的另一个重要环境因子[15],由于研究中未考虑该因子对毛红椿适生区分布的影响,单纯考虑水热因子的影响,导致本研究结果反映在未来气候条件下,西北地区的陕西省和宁夏回族自治区具有潜在的毛红椿适生区。
-
毛红椿在云南省多分布在亚热带河谷地区,其中以金沙江、怒江、澜沧江河谷为聚集区域,其模式标本就来自于金沙江河谷上段(大理宾川县)。全球变暖导致热带和亚热带的北界北移明显[19],但热带地区随全球变暖降水量增多而导致空气相对湿度增加[20-21],使河谷型气候区域范围缩小而导致毛红椿在云南的适生区面积减少。同时,亚热带地区因受下沉气流的影响,干旱少雨区域逐步扩大[22],致使区域内毛红椿这一喜湿树种的适生空间进一步萎缩,二者共同作用致使毛红椿适生区域在北移的过程中面积会逐步减少,其中,在云南省未来气候条件下的总适生区面积较当代减少13.17%28.19%,全国范围内在未来气候条件下(2050S、2070S)的适生区总面积较当代减少4.30%7.20%。
-
研究得到的毛红椿适生区分布与其自然分布是相符的,主要分布于察隅-丽江-西昌-重庆-宜昌-信阳-铜陵-南京-上海市一线以南地区;另外,MaxEnt模型平均训练AUC和平均测试AUC分别为0.891、0.885,说明对毛红椿适生区的预测是可靠的。在7个影响毛红椿适生区分布的环境因子中,降水量变异系数和最干季度降水量的累计贡献率已达91.3%,为主要因子;而年均气温变化范围、最冷季度平均气温、最湿季度降水量、最冷季度降水量等4个环境因子的累计贡献率仅为8.7%,为次要因子。当代气候条件下毛红椿在云南和全国的适生区总面积分别为172 960、1 789 119 km2,全球变暖对毛红椿的适生区有一定的负面影响,未来气候条件下毛红椿在云南和全国的适生区总面积较当代减少13.17%28.19%和4.30%7.20%。
基于MaxEnt模型的毛红椿适生区预测
Distributional Change in Suitable Areas for T.ciliata var. pubescens Based on MaxEnt
-
摘要:
目的 了解环境因子对毛红椿适生区分布的影响,为其资源保护、引种及其人工林的发展提供参考。 方法 基于MaxEnt模型能利用现存不完整、小样本、离散型分布数据构建物种适生区预测模型,用受试者工作曲线线下面积(AUC)检验预测模型的精度,面积越大精度越高等优点,本研究应用毛红椿在云南的分布数据及1个地型因子和6个气候因子,来构建其适生区分布模型。 结果 毛红椿适生区分布MaxEnt模型平均训练AUC和平均测试AUC分别为0.891、0.885,说明对毛红椿适生区的预测是可靠的;降水量变异系数和最干季度降水量是决定毛红椿适生区分布的主要因子,年均气温变化范围、最冷季度平均气温、最湿季度降水量、最冷季度降水量是次要因子。在当代和未来(2050S、2070S)气候变暖条件下(RCP2.6情景),云南省和全国适生区面积计算结果直观、定量的反应了全球变暖对毛红椿适生区变迁的影响。 结论 预测云南省及全国的毛红椿适生区随全球变暖而小幅萎缩。 Abstract:Objective To understand the relation between environmental variables and suitable region of T.ciliata var. pubescens, which can provides reference to resource conservation, introduction and plantation for this plant. Method An MaxEnt model, because of the advantages of using presence-only data and performing well with small sample sizes, incomplete data and gaps, was employed to simulate the habitat suitability distribution. And the area under the receive operating characteristic curve(AUC)were used to examine the model's accuracy, the AUC is larger and predictions is more accuracy. So, based on the location in Yunnan province of T.ciliata var. pubescens, the MaxEnt was used to set up it's distributional model of potential habitat, one topographic variable and the six main bioclimatic variables influencing species distribution. Result The results show that the Mean training AUC and Mean test AUC were 0.891, 0.885, respectively, it illustrated that the prediction of T.ciliata var. pubescens's suitable habitats are reliable. CV of precipitation and Precipitation of the coldest quarter are significant factors, Range of annual temperature, Mean temperature of the coldest quarter, Precipitation of the wettest quarter, Precipitation of the driest quarter are secondary factors to determining T.ciliata var. pubescens's suitable habitat. Habitat suitability for current and future climate warming(2050S, 2070S) under scenarios RCP2.6 in Yunnan province and China were calculated. The result predictions the T.ciliata var. pubescens' suitable habitats change under different climate in intuitive and quantitative. Conclusion The habitat suitability of T.ciliata var. pubescensin Yunnan Province and China are predicted to deteriorate in slight with globalwarming. -
Key words:
- Toona ciliate var.pubescens
- / MaxEnt
- / Globalwarming
- / Distributional area change
-
表 1 环境因子间的相关系数
Table 1. Correlation coefficient between environmental variables
alti bio 1 bio 10 bio 11 bio 12 bio 13 bio 14 bio 15 bio 16 bio 17 bio 18 bio 19 bio 2 bio 3 bio 4 bio 5 bio 6 bio 7 bio 8 bio 9 alti 1.00 bio 1 -0.66 1.00 bio 10 -0.59 0.77 1.00 bio 11 -0.95 0.99 0.98 1.00 bio 12 -0.46 0.33 0.28 0.34 1.00 bio 13 -0.10 -0.03 -0.09 -0.01 0.78 1.00 bio 14 -0.54 0.47 0.42 0.49 0.76 0.34 1.00 bio 15 0.62 -0.54 -0.51 -0.54 -0.76 -0.30 -0.96 1.00 bio 16 -0.28 0.16 0.10 0.18 0.57 0.97 0.54 -0.51 1.00 bio 17 -0.55 0.44 0.40 0.45 0.89 0.53 0.95 -0.96 0.70 1.00 bio 18 -0.24 0.12 0.06 0.14 0.57 0.55 0.54 -0.50 0.48 0.70 1.00 bio 19 -0.56 0.45 0.41 0.46 0.91 0.57 0.94 -0.95 0.73 1.00 0.72 1.00 bio 2 0.02 -0.01 0.05 -0.07 -0.64 -0.55 -0.66 0.54 -0.61 -0.64 -0.63 -0.64 1.00 bio 3 0.16 -0.15 -0.20 -0.07 -0.01 -0.05 0.11 -0.06 -0.01 0.05 0.02 0.00 -0.01 1.00 bio 4 0.13 -0.19 -0.09 -0.30 -0.36 -0.29 -0.45 0.29 -0.37 -0.35 -0.39 -0.33 0.62 -0.59 1.00 bio 5 -0.74 0.72 0.71 0.68 0.13 -0.17 0.25 -0.35 -0.01 0.23 -0.05 0.24 0.17 -0.22 -0.06 1.00 bio 6 -0.62 0.64 0.78 0.79 0.30 -0.04 0.45 -0.51 0.15 0.41 0.12 0.42 -0.09 -0.09 -0.31 0.96 1.00 bio 7 -0.08 0.07 0.15 -0.02 -0.57 -0.47 -0.63 0.49 -0.54 -0.58 -0.58 -0.56 0.89 -0.45 0.82 0.26 -0.03 1.00 bio 8 -0.65 0.66 0.76 0.72 0.28 -0.09 0.42 -0.51 0.10 0.40 0.06 0.41 0.05 -0.20 -0.09 0.66 0.73 0.15 1.00 bio 9 -0.69 0.47 0.63 0.30 0.43 0.06 0.56 -0.62 0.26 0.53 0.23 0.55 -0.14 -0.11 -0.28 0.78 0.77 -0.06 0.70 1.00 注:bio 1,年均气温;bio 2,昼夜温差月均值;bio 3,等温性;bio 4,气温季节性变化的标准差;bio 5,最暖月最高气温;bio 6,最冷月最低气温;bio 7,年均气温变化范围;bio 8,最湿季度平均气温;bio 9,最干季度平均气温;bio 10,最暖季度平均气温;bio 11,最冷季度平均气温;bio 12,年均降水量;bio 13,最湿月降水量;bio 14,最干月降水量;bio 15,降水量变异系数;bio 16,最湿季度降水量;bio 17,最干季度降水量;bio 18,最暖季度降水量;bio 19,最冷季度降水量;alti,海拔。
Note: bio 1, annual mean temperature. bio 2, monthly mean diurnal temperature range. bio 3, isothermality. bio 4, standard deviation of temperature seasonal change. bio 5, max temperature of the warmest month. bio 6, min temperature of the coldest month, bio 7, range of annual temperature., bio 8, mean temperature of the wettest quarter. bio 9, mean temperature of the driest quarter. bio 10, mean temperature of the warmest quarter. bio 11, mean temperature of the coldest quarter. bio 12, annual average precipitation. bio 13, precipitation of the wettest month. bio 14, precipitation of the driest month. bio 15, cv of precipitation. bio 16, precipitation of the wettest quarter. bio 17, precipitation of the driest quarter. bio 18, precipitation of the warmest quarter. bio 19, precipitation of the coldest quarter. alti, altitude. 下载: 导出CSV
表 2 环境因子对最大熵模型的贡献率
Table 2. Contributions of the environmental variables to the Maxent model
环境因子
Environmental
variables贡献率
Contribution/
%bio 15 69.4 bio 16 4.0 bio 11 0.6 alti 0 bio 17 21.9 bio 7 3.7 bio 19 0.4
下载: 导出CSV
表 3 不同时期毛红椿在云南和中国的适生区预测
Table 3. Predicted suitable region for T.ciliata var. pubescens in Yunnan and China under different decade
km2 区域
district年代
Decade总适生区
Total suitable region低度适生区
Lowly suitable region中度适生区
Moderately suitable region高度适生区
Highly suitable region云南Yunnan 1995-2000 172 960 161 758 7 651 3 551 2050S 150 183 146 778 3 328 77 2070S 124 211 121 042 3 080 89 中国China 1995-2000 1 789 119 1 228 113 494 316 66 690 2050S 1 712 146 1 256 661 359 864 95 621 2070S 1 660 252 1 263 923 328 577 67 752
下载: 导出CSV
-
[1] Elith J, Leathwick J R. Species Distribution Models:Ecological Explanation and Prediction Across Space and Time[J]. Annual Review of Ecology Evolution & Systematics, 2009, 40(1):677-697. [2] Beerling D J, Huntley B, Bailey J P. Climate and the Distribution of Fallopia japonica:Use of an Introduced Species to Test the Predictive Capacity of Response Surfaces[J]. Journal of Vegetation Science, 1995, 6(2):269-282. doi: 10.2307/3236222 [3] Raxworthy C J, Martinez-Meyer E, Horning N, et al. Predicting distributions of known and unknown reptile species in Madagascar[J]. Nature, 2003, 426(6968):837-841. doi: 10.1038/nature02205 [4] Ferrier S. Mapping Spatial Pattern in Biodiversity for Regional Conservation Planning:Where to from Here?[J]. Systematic Biology, 2002, 51(2):331-363. doi: 10.1080/10635150252899806 [5] Elith J, Graham C H, Aanderson R P, et al. Novel methods improve prediction of species' distributions from occurrence data. Ecography, 2006, 29(2):129-151. doi: 10.1111/j.2006.0906-7590.04596.x [6] Adhikari D, Barik S K, Upadhaya K. Habitat distribution modelling for reintroduction of Ilex khasiana, Purk. a critically endangered tree species of northeastern India[J]. Ecological Engineering, 2012, 40(3):37-43. [7] Yi Y J, Cheng X, Yang Z F, et al. Maxent modeling for predicting the potential distribution of endangered medicinal plant (H. riparia, Lour) in Yunnan, China[J]. Ecological Engineering, 2016, 92:260-269. doi: 10.1016/j.ecoleng.2016.04.010 [8] 傅立国.中国植物红皮书[M].北京:科学出版社, 1991:89. [9] 吴征镒.云南植物志(第一卷)[M].北京:科学出版社, 1977:210-215. [10] 徐永椿.云南树木图志(上册)[M].昆明:云南科技出版社, 1988:748-754. [11] Hill M P, Hoffmam A A, Mccoll S A, et al. Distribution of cryptic blue oat mite species in Australia:current and future climate conditions[J]. Agricultural & Forest Entomology, 2012, 14(2):127-137. [12] 周天华, 钱增强, 王勇.基于最大熵值模型的山白树适生区分布变化研究[J].西北农林科技大学学报:自然科学版, 2015, 43(9):51-56. [13] Swets J A. Measuring the accuracy of diagnostic systems[J]. Science, 1988(240), 1285-1293. [14] Anadón J D, Sala O E, Maestre F T. Climate change will increase savannas at the expense of forests and treeless vegetation in tropical and subtropical Americas[J]. Journal of Ecology. 2014:1363-1373. [15] Adhikari D, Barik S K, Upadhaya K. Habitat distribution modelling for reintroduction of Ilex khasiana, Purk. a critically endangered tree species of northeastern India[J]. Ecological Engineering, 2012, 40(3):37-43. [16] 王宇.云南省农业气候资源及区划[M].昆明:气象出版社, 1990. [17] 段旭, 陶云, 段长春.云南省细网格气候区划及气候代表站选取[J].大气科学学报, 2011, 34(3):336-342. doi: 10.3969/j.issn.1674-7097.2011.03.010 [18] 宗世贤, 陶金川, 杨志斌, 等.毛红椿的生态地理分布及其南京引种的初步观察[J].植物生态学报, 1988, 12(3):222-231. [19] 缪启龙, 丁园圆, 王勇.气候变暖对中国亚热带北界位置的影响[J].地理研究, 2009, 28(3):634-642. doi: 10.3321/j.issn:1000-0585.2009.03.008 [20] Wuebbles D, Meehl G, Hayhoe K, et al. CMIP5 Climate Model Analyses:Climate Extremes in the United States[J]. Bulletin of the American Meteorological Society, 2014, 95(4):571-583. doi: 10.1175/BAMS-D-12-00172.1 [21] Trenberth K E. Changes in precipitation with climate change[J]. Climate Research, 2010, 47(47):123-138. [22] Seager R, Ting M, Held I, et al. Model projections of an imminent transition to a more arid climate in southwestern North America.[J]. Science, 2007, 316(5828):1181. doi: 10.1126/science.1139601 -

 点击查看大图

图(3) / 表(3)
计量
- 文章访问数: 3705
- HTML全文浏览量: 1398
- PDF下载量: 42
- 被引次数: 0
