


-
从全球来看,水分短缺一直是限制农林业发展的主要因素之一。土壤水分不仅决定了植物空间和时间的分布,也在植物种子萌发、形态形成、干物质积累、花芽分化等多种生长发育阶段起到决定性作用[1-2]。干旱条件下,植物的细胞、组织、器官都会受到不同程度的损伤,同时植物也会通过自身的生长策略和生理适应性来抵御干旱环境[3-5]。种子萌发阶段是植物生长发育的重要阶段,是植物成株的基础,同时也是极为脆弱的阶段[6]。种子在萌发的过程中,往往会受到外界环境的影响[7]。有研究发现,在干旱条件下,种子发芽率和发芽势均会降低[7-8]。持续高强度的干旱胁迫还会显著地抑制幼苗的生长[9-10],尤其是在干旱和半干旱地区,干旱已经成为阻碍种子萌发的主要因素[11-12]。因此,开展对种子萌发期及幼苗期抗旱特性的研究显得尤为重要。
毛竹(Phyllostachys edulis (Carrière) J. Houz.)隶属禾本科(Poaceae)刚竹属(Phyllostachys Sieb. et Zucc.),在我国分布广泛,是重要的竹子资源,具有适应性强、生长迅速、易繁殖、材性好等特点,同时毛竹还兼有材用、药用、食用、环保等多种功能,具有较高的经济价值和生态服务价值[13-14]。鉴于毛竹独特的繁殖和生长方式,国内外对毛竹的研究侧重于竹子的生长规律[15-17]以及毛竹的生长对生态环境的影响方面[18],毛竹种子萌发及幼苗对环境适应性方面的研究相对较少,仅限于光照[19-20]、温度[21]、重金属[22]、土壤肥力[23-24]等,而毛竹对水分的利用以及对干旱条件的适应性两个方面的研究相对匮乏。随着全球气候变化加剧,极端干旱事件发生越来越频繁,强度越来越大,对包括竹林在内的森林植物生长和更新带来严重挑战。因此,本试验以聚乙二醇(PEG-6000)作为水分胁迫剂,模拟不同程度的干旱胁迫,研究毛竹在种子萌发时期对不同程度干旱条件的生理响应,分析毛竹发育初期对干旱胁迫的响应机制,以期提高毛竹种子的萌发率、成苗率,为毛竹的水分管理提供科学依据。
-
毛竹种子于2016年9月采自广西壮族自治区桂林市灵川县。选取籽粒饱满,大小基本一致的种子,小心剥去颖壳备用,种子千粒质量为23.019 4±0.047 6 g。
-
随机选取优质的毛竹种子,在质量分数为3‰的KMnO4溶液中消毒10 min,无菌水冲洗8次,保证无消毒液残留,均匀平摊于干燥滤纸上自然风干表面水分。培养皿和滤纸使用前高温消毒20 min,试验设置6个处理,在培养皿加入10 mL浓度(质量分数)分别为5%、10%、15%、20%,25%的PEG-6000溶液,以等量的蒸馏水作为对照,每个培养皿中垫4层滤纸作为发芽床,将供试种子均匀排放于发芽床中,每皿100粒,重复3次。去盖后准确称量培养皿质量,加盖放置于25℃、相对湿度60%的人工气候箱中进行暗培养,每天定时观察统计种子的萌发数以及胚根长度(萌发标准为胚根达到种子长度的1/2)并称量培养皿质量,每日测定完毕加入损失质量的无菌水,每4 d更换一次发芽床。2 d内无种子发芽视为发芽结束,计算各项发芽指标:发芽率(GP)=(发芽种子数/供试种子数)×100%;发芽势(GE)=(发芽过程中日发芽种子数达到高峰时的发芽数/供试种子数)×100%;发芽指数(GI)=∑(Gt/Dt),其中,Gt为第t天的种子发芽数,Dt为发芽天数;活力指数(VI)=GP×(LR + LS),其中,LR为幼苗胚根平均长(cm),LR=(测量当日所有发芽种子胚根长的总和/测量当日发芽种子总数),LS为幼苗胚芽平均长(cm),LS=(测量当日所有发芽种子胚芽长的总和/测量当日发芽种子总数)。
耐旱临界值与极限值:首先对关键指标和PEG胁迫浓度进行相关性分析,若存在相关性,则进行回归分析,根据回归方程利用单变量求解出耐旱临界值与极限值。耐旱临界值与极限值分别为与干旱胁迫强度呈负相关的指标降低到对照的50%、25%时所对应的浓度[25-26]。
-
发芽试验结束后,随机抽取部分幼苗的胚根,对胚根中的保护酶活性、渗透调节物质含量等指标进行测定,试验重复3次。
超氧化物歧化酶(SOD)活性采用氮蓝四唑法(NBT法)测定;超氧化物酶(POD)活性采用愈创木酚法测定;过氧化氢酶(CAT)活性采用紫外吸收法测定;丙二醛(MDA)含量采用硫代巴比妥酸(TBA)法测定;可溶性蛋白含量(SPC)采用考马斯亮蓝染色法测定[27]。
-
发芽率、生长量以及生理等指标用SPSS 17.0进行单因素和双因素方差分析(ANOVA),并对所有指标进行相关性分析。运用Origin 9和Excel 2003程序进行图表绘制。图表中显示数据均为所有重复的平均值和标准差。
-
毛竹种子萌发试验显示:所有处理在试验开始后3 d内均无发芽。在第4天时,对照组(CK)和5%处理组开始发芽,其余各处理组的发芽起始时间随处理浓度的升高逐渐延迟,10%处理组、15%处理组和20%处理组发芽起始时间分别为5、7、11 d,而25%处理组不发芽。由图 1可以看出:最终发芽率在PEG浓度为5%时达到最大(51.33%),且显著大于对照组,随着浓度的不断升高, 发芽率迅速降低,且均显著小于对照组(P<0.05)。另外,对照组和5%处理组的发芽率随时间变化曲线存在唯一交叉点,出现在9~10 d之间,在第9天之前对照组发芽率显著大于5%处理组。单因素方差分析结果显示:浓度间的最终发芽率差异显著(F=89.158;P<0.01)。另外,毛竹种子发芽率与PEG浓度呈显著负相关(P<0.05)。由回归方程得出毛竹种子在PEG胁迫下的萌发临界值和极限值分别为14.49%和19.27%(表 1)。
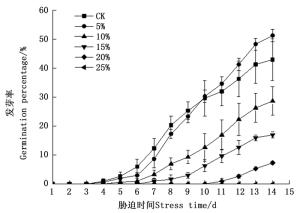
图 1 不同PEG浓度胁迫下毛竹种子发芽率日变化曲线
Figure 1. The daily germination percentage of Ph. edulis seeds under different concentration of PEG stress
表 1 种子萌发及生长指标的回归分析
Table 1. The regression analysis of the indicators of seed germination and growth
指标Indicators 回归方程Regression equation 相关系数R2 临界值Critical value/% 极限值Maximum value/% GP y=-0.000 2x2-0.015 8x+0.486 1 0.909 0 14.49 19.27 Lr y=-0.007 4x2+0.083 7x+2.616 4 0.923 7 20.43 23.01 Ls y=-0.001 8x2+0.019 0x+0.658 8 0.974 1 20.05 22.79 -
由表 2可知:毛竹种子发芽指数随处理浓度的升高呈现先上升后下降的趋势。5%处理组发芽指数最大(24.08),但5%处理组和对照组间差异不显著(P=0.990),5%处理组和对照组的发芽指数显著大于其它处理组,20%处理组和25%处理组间差异不显著(P=0.464),其余各处理组间差异显著(P<0.05)。
表 2 不同PEG浓度胁迫下毛竹种子的发芽指数、发芽势及活力指数
Table 2. The seed germination index, germination energy and vigor index of Ph. edulis under different concentration of PEG stress
PEG浓度
PEG concentration/%发芽率
Germination percentage/%发芽指数
Germination index发芽势
Germination energy/%活力指数
Vigor index0 43.00±7.211b 24.06±4.305a 41.33±6.506b 75.72±24.195b 5 51.33±2.082a 24.08±0.582a 48.33±2.082a 98.89±2.695a 10 28.67±4.933c 11.43±2.073b 26.33±5.033c 33.85±11.71c 15 17.00±1.000d 5.70±1.157c 16.00±1.000d 17.55±5.574cd 20 7.33±0.577e 1.25±0.137e 5.33±0.577e 2.35±0.04d 25 0f 0e 0e 0d 注:同列数据后不同小写字母代表各处理之间在P<0.05水平上差异显著,下同。
Note: Different lowercase letters in each column show significant difference among different PEG concentrations at P<0.05, the same below.各处理组第13天的发芽势随浓度升高呈现先上升后下降的趋势,5%处理组的发芽势(48.33%)显著大于其它处理组(P<0.05),随后发芽势随浓度升高逐渐减小,且显著小于对照组(41.33%)。20%处理组和25%处理组差异不显著(P=0.086),其余处理组间差异显著(P<0.05)。
由表 2可知:各处理组种子的活力指数随浓度的增加呈现先升高后下降的趋势,5%处理组活力指数显著大于其它处理组(P<0.05),对照组显著大于其余4个处理组(P<0.05)。10%处理组之后种子活力指数迅速降低,10%处理组下降幅度最大,达到55.04,在15%处理组以后种子活力虽逐渐下降,但差异不显著。
-
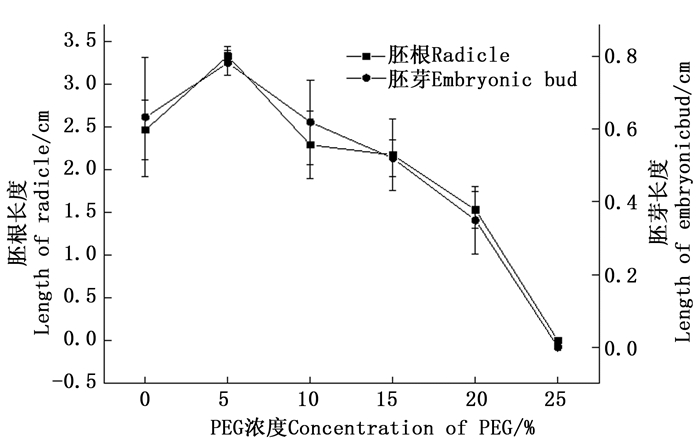
不同干旱条件下毛竹胚根长度日变化见图 2。在不同浓度PEG胁迫下,发芽试验结束时胚根平均长度差异显著(F=12.335;P=0.001),并随浓度的不断升高而呈现先增大后减小的趋势。5%处理组的胚根平均长度最大(3.33 cm),并显著大于其它处理组(P<0.05),20%处理组胚根平均长度(1.53 cm)显著小于其它处理组。对照组(2.46 cm)、10%处理组(2.29 cm)和15%处理组(2.17 cm)的胚根平均长度虽逐渐减小,但彼此间差异不显著。另外,从整个胚根生长过程看,对照组和5%处理组的胚根平均长度日变化曲线存在交叉点,出现在89 d之间,在此之前对照组胚根平均长度始终大于5%处理组。

图 2 不同PEG浓度胁迫下毛竹种子胚根平均长度日变化曲线
Figure 2. The daily radicle lengths of Ph. edulis seeds under different concentration of PEG stress
不同浓度PEG胁迫下毛竹胚根和胚芽平均长度见图 3。由图 3看出:发芽试验结束时胚芽的平均长随浓度的不断升高呈先增大后减小的趋势。5%处理组的胚芽平均长度最大(0.78 cm),对照组的(0.63 cm)次之,随后的10%处理组、15%处理组和20%处理组胚芽平均长逐渐减小。单因素方差分析显示:浓度间差异显著(F=27.779;P<0.05)。相关性分析显示,胚芽和胚根平均长度具显著正相关(表 3)。另外,毛竹种子胚根和胚芽生长与PEG浓度呈显著负相关(P<0.05),由回归方程得出胚根在PEG胁迫下的生长临界值和极限值分别为20.43%和23.01%,胚芽生长的临界值为20.05%和22.79%(表 1)。

图 3 不同PEG浓度胁迫下毛竹种子胚根、胚芽平均长度
Figure 3. The radicle lengths and embryonic bud lengths of Ph. edulis seeds under different concentration of PEG stress
表 3 Pearson相关性分析
Table 3. Analysis of Pearson correlation
项目Item GP VI GI GE LR LS SOD POD CAT MDA SPC GP 1 VI 0.978** 1 GI 0.980** 0.975** 1 GE 0.997** 0.979** 0.983** 1 LR 0.807** 0.824** 0.743** 0.810** 1 LS 0.866** 0.874** 0.831** 0.882** 0.836** 1 SOD 0.852** 0.788** 0.759** 0.842** 0.819** 0.830** 1 POD 0.198 0.102 0.034 0.186 0.367 0.391 0.558* 1 CAT 0.594* 0.446 0.495 0.583** 0.387 0.552** 0.685** 0.681** 1 MDA -0.900** -0.816** -0.873** -0.905** -0.740** -0.812** -0.843** -0.322 -0.708** 1 SPC -0.886** -0.849** -0.933** -0.886** -0.497 -0.638* -0.627* 0.146 -0.491 0.815** 1 注:**表示相关性在P < 0.01水平上显著,*表示相关性在P < 0.05水平上显著。
Note: ** Correlation is significant at the 0.01 level, * correlation is significant at the 0.05 level. -
植物的抗氧化酶系统包括超氧化物歧化酶(SOD)、过氧化物酶(POD)、过氧化氢酶(CAT)等。由表 4可知:3种抗氧化酶活性随PEG浓度的不断升高呈现先上升后下降的趋势,但3种酶活性达到峰值的浓度不同。5%处理组的SOD活性最大,且显著大于其它处理组(P<0.05),另外10%处理组>对照组>15%处理组>20%处理组,但对照组与10%处理组和15%处理间差异不显著。20%处理组SOD活性最低(1 861.64 U·g-1),且显著小于其它处理组(P<0.05)。POD活性随浓度的升高逐渐增大,10%处理组POD活性最大(13 066.67 U·g-1),此后随浓度的升高POD活性逐渐降低,且显著小于5%处理组,但均大于对照组;单因素方差分析显示,除对照组和20%处理组外(P =0.053),其余处理间差异显著(P<0.05)。CAT活性随浓度的升高逐渐增大,10%处理组CAT活性最大(1 511.11 U·g-1);之后随浓度不断升高逐渐降低,20%处理组CAT活性最小(933.33 U·g-1)。单因素方差分析显示,10%处理组和5%处理组间以及5%处理组和对照组间差异不显著,20%处理组与15%处理组差异不显著(P=0.145),但与其它各处理间差异显著。相关性分析显示,3种抗氧化酶活性间具有显著的相关性。
表 4 不同浓度PEG胁迫下毛竹胚根中抗氧化酶活性及MDA、可溶性蛋白的含量
Table 4. Activities of antioxidant enzymes and contents of soluble protein and MDA in Ph. edulis radicle under different concentration of PEG stress
PEG浓度
PEG concentration/%SOD活性
SOD activity/(U·g-1)POD活性
POD activity/(U·g-1)CAT活性
CAT activity/(U·g-1)MDA含量
MDA content/(nmol·g-1)可溶性蛋白含量
Soluble protein content/(mg·g-1)0 3 203.35±161.74b 8 488.89±384.90d 1 244.44±76.98b 38.37±3.51c 1.508±0.077d 5 4 343.62±176.70a 11 822.00±335.55b 1 377.78±203.67ab 42.04±6.13c 1.812±0.091c 10 3 538.78±203.34b 13 066.67±581.19a 1 511.11±76.98a 51.84±8.96c 2.236±0.102b 15 2 884.70±248.20b 10 444.44±468.25c 1 111.11±153.96bc 79.73±4.94b 2.508±0.098a 20 1 861.64±201.26d 9 288.89±428.61d 933.33±133.33c 120.94±7.05a 2.614±0.118a 25 — — — — — 可溶性蛋白是植物组织中重要的渗透调节物质。由表 4可知:可溶性蛋白含量(SPC)随PEG浓度的增加呈现逐渐升高的趋势,10%处理组SPC增幅最大,随后增幅逐渐减小,且15%处理组和20%处理组间差异不显著(P=0.215),其余各处理组间差异显著(P<0.05)。
丙二醛(MDA)是植物细胞膜系统过氧化程度的指示物。由表 4可知:MDA含量随PEG浓度的增加呈现逐渐增大的趋势,20%处理组MDA含量最大(120.94 nmol·g-1)。从对照组至10%处理组3个处理间MDA含量增幅较小,彼此间差异不显著,但随PEG浓度的不断提高,MDA含量显著增大,10%处理组、15%处理组和20%处理组3个处理间差异显著(P<0.05),20%处理组MDA含量增幅最大,达到41.21 nmol·g-1。
-
水分在种子萌发的过程中起到决定性的作用,它直接参与种子的吸水膨胀、胚萌发等一系列生理生化过程。高强度的干旱胁迫会显著降低种子活力、发芽率[28-29]以及发芽势[30]。本研究的结果表明,在低浓度PEG(5%浓度)胁迫下,毛竹种子发芽率显著升高,而随PEG浓度的不断升高,发芽率迅速降低,且浓度间差异显著。这说明低浓度PEG促进了毛竹种子的萌发,而在高浓度PEG胁迫下种子萌发受到抑制。这种现象在其它树种的干旱胁迫试验中大量出现[30-31]; 但与前人的研究结果不同的是,本研究通过观察干旱胁迫下毛竹种子发芽率日变化曲线发现,对照组和5%处理组两条曲线之间存在唯一交叉点,即在交叉点之前对照组中种子的平均发芽率始终大于5%处理组,而在发芽试验第10天时被5%处理组超越。这表明低浓度PEG干旱胁迫延迟毛竹种子发芽,降低发芽前期的发芽率,但有效提高了毛竹种子的最终发芽率; 而高浓度PEG干旱胁迫延迟毛竹种子发芽; 降低整个发芽时期的发芽率。低浓度干旱胁迫激活种子内部抗性机制,以度过干旱环境,而经过逆境锻炼的种子细胞中原生质浓度发生变化,提高了种子吸水能力,这可能最终影响种子的发芽率[32-34]。因此, 生产中可用低浓度PEG干旱处理毛竹种子来提高发芽率。
-
植物根系具有支撑、锚固植物体、吸收生长介质中营养和水分、维持种群繁衍等功能的关键器官。根系的生长发育直接影响植物的生长量,而胚芽的生长则直接反应了植物幼苗时期的生长速度[25]。有研究表明,低浓度PEG胁迫可促进胚根的生长,而高浓度则显著抑制了胚根的生长[25, 31]。在本研究中,胚根平均长度在5%浓度PEG胁迫下达到最大,随PEG浓度的不断升高, 胚根长度逐渐降低。通过观察胚根生长的日变化曲线可以发现,对照组和5%处理组两条曲线同样存在唯一交叉点。这种类似于发芽率曲线的现象说明,低浓度PEG抑制了发芽早期胚根的形成,却促进了后期胚根的生长。这可能是由于轻度干旱胁迫使同化物大量地向根部转运的结果。在本研究中, 5%浓度PEG胁迫下, 胚芽长度显著大于对照组,但随浓度的不断升高胚芽长度迅速减小,说明低浓度干旱胁迫促进了胚芽的生长,而高浓度干旱胁迫抑制胚芽的生长。另外,根据耐旱临界值的比较分析可以发现,相对于胚根胚芽的生长种子萌发对干旱胁迫更敏感,这与前人的研究结果不同[35]。结合胚根生长与保护酶活性的相关性分析结果,这可能是由于经受适当干旱锻炼后萌发的种子,其胚根中的SOD活性显著升高,提升了保护酶系统对羟自由基的清除能力,从而提高了对水分胁迫的适应能力[36]。
-
干旱胁迫下,植物体内产生大量的氧自由基,从而使抗氧化酶系统发生变化。抗氧化酶系统包括超氧化物歧化酶(SOD)、过氧化物酶(POD)、过氧化氢酶(CAT)等[4, 20]。植物通过SOD将组织中的O2-转化为H2O2和O2,再由POD、CAT两种酶将H2O2转化成H2O和O2,从而有效地降低自由基对植物体的伤害[37]。有研究表明, 3种酶的活性与干旱胁迫的程度以及胁迫时间密切相关[38-39]。在本研究中,3种抗氧化酶活性随PEG浓度的不断升高均呈现先上升后下降的趋势。低浓度PEG胁迫下,植物通过提高3种酶的活性来清除组织中大量产生的氧自由基; 但随PEG浓度的不断升高,SOD、POD和CAT 3种酶相继达到自身的忍耐限度,活性迅速降低。SOD活性在5%浓度时达到峰值,而POD和CAT则在10%浓度时达到峰值。这说明相对于POD和CAT,SOD对干旱胁迫更敏感[40]。
渗透调节是植物适应干旱胁迫的重要策略,增加可溶性蛋白的合成是渗透调节的重要途径之一[4, 41]。本研究中,胚根中可溶性蛋白含量随PEG浓度的升高而升高,但15%、20%两个浓度之间差异不显著。这说明低强度干旱胁迫促进了蛋白质的合成,但高浓度PEG也促进了可溶性蛋白的降解。在低强度干旱胁迫下,蛋白质的合成得到促进,降低了细胞渗透势,提高了胚根的水分利用效率,从而也促进了胚根胚芽的生长[42]。但在高浓度时,干旱胁迫达到了胚根生长的极限,蛋白合成酶钝化,代谢受阻,蛋白质分解加剧,致使含量迅速下降,渗透势升高,胚根的生长受到抑制[30]。
丙二醛(MDA)是膜脂过氧化的主要副产物,通常被作为植物细胞膜损伤程度的指示物[4, 40]。有研究表明,植物组织中MDA含量与干旱胁迫程度密切相关,并且随干旱胁迫的加剧而持续上升[43-44]。本研究的结果显示,毛竹胚根中MDA含量随PEG浓度的升高而不断升高,但在对照组、5%处理组和10%处理组间的差异不显著。这说明在PEG浓度小于10%时对胚根膜系统的伤害并不显著;而随浓度的升高MDA含量也迅速升高,差异显著。说明在PEG浓度大于15%后,胚根膜系统受到了严重损伤。相关性分析结果显示,MDA含量与SOD、CAT活性以及胚根胚芽长呈显著负相关,这也进一步印证了抗氧化酶活性的降低打破了植物组织内部O2-的动态平衡,使植物组织的膜系统过氧化产生大量的MDA,从而抑制了植物幼苗的生长发育。
-
本文研究表明,低浓度PEG干旱胁迫抑制发芽前期毛竹种子萌发以及胚根的形成,但显著提高毛竹种子的最终发芽率并促进胚根后期的生长;而高浓度PEG干旱胁迫延迟毛竹发芽,降低整个发芽时期的发芽率以及幼苗的生长。相对于胚根胚芽的生长,种子萌发对干旱胁迫更敏感。PEG浓度高于15%的干旱胁迫使毛竹的抗氧化酶系统发生紊乱,并对组织膜系统造成显著伤害。由于植物在其生活史的不同阶段对干旱环境的适应性存在差异,因此,在后续的试验中将进一步研究毛竹其它生长阶段对干旱环境的适应情况。
PEG模拟干旱对毛竹种子萌发及生长生理特性的影响
Effects of Drought Stress Simulated by PEG on Seed Germination and Growth Physiological Characteristics of Phyllostachys edulis
-
摘要:
目的 通过比较不同程度干旱胁迫对毛竹种子萌发及生长生理的影响,探究毛竹种子萌发期对水分胁迫的耐受机理,为毛竹的水分管理提供科学依据。 方法 以毛竹种子为试验材料,采用培养皿滤纸萌发的方法研究不同浓度(0%、5%、10%、15%、20%、25%)PEG-6000溶液对其种子萌发、生长、渗透调节物质、抗氧化酶活性的影响。并对种子萌发率、胚根和胚芽的生长量与PEG胁迫浓度间进行回归分析。 结果 (1)对照组(CK)和5%处理组在第4天开始发芽,其余各处理组的发芽起始时间随处理浓度的升高逐渐延迟,25%处理组不发芽。(2)最终发芽率、发芽势、发芽指数、活力指数、胚根长度、胚芽长度随PEG浓度的升高呈现先增大后减小的趋势,且均在5%浓度达到最大值。干旱胁迫下毛竹种子发芽率日变化曲线中对照组和5%处理组间存在唯一交叉点。毛竹种子在PEG胁迫下发芽率的临界值和极限值分别为14.49%和19.27%。(3)胚根和胚芽最终长度均在5%浓度时达到最大值,其后随着浓度的升高而减小,处理间差异显著(P < 0.05)。对照组和5%处理组的胚根平均长度日变化曲线存在交叉点。PEG胁迫下胚根生长的临界值和极限值分别为20.43和23.01%。(4)胚根中SOD、POD、CAT的活性均随PEG浓度的升高呈先上升后下降的趋势,且分别在5%、10%、10%浓度时达到最大值。(5)MDA和可溶性蛋白含量随PEG浓度的升高而持续升高,但低浓度(0%~10%)时MDA含量差异不显著。 结论 低浓度干旱胁迫抑制发芽前期毛竹种子萌发以及胚根的形成,但显著提高毛竹种子的最终发芽率并且促进胚根后期的生长;而高浓度PEG干旱胁迫延迟毛竹发芽,抑制整个发芽时期的发芽率以及胚根、胚芽的生长;PEG浓度高于15%的干旱胁迫使毛竹的抗氧化酶系统发生紊乱,并对组织膜系统造成显著伤害。 Abstract:Objective To study the tolerance mechanism of Phyllostachys edulis to drought stress during seed germination by comparing the effects of different drought stress on seed germination, growth physiological characteristics of Ph. edulis so as to provide reference for Ph. edulis water management. Method The effects of different concentrations (0%, 5%, 10%, 15%, 20%, 25%)of PEG stress on seed germination, growth, organic osmoregulation substances were measured with choosing Ph. edulis seeds and using Petri dish and filter paper germination method. The regression analysis were done between growth of radicle and embryo, seed germination and PEG stress. Result (1) The control group (CK) and 5% test group began to germinate on the 4th day. The initiation time of the other test groups was gradually delayed with the increase of treatment concentration, and 25% of the test group did not germinate. (2) The final germination percentage, germination energy, germination index, vigor index, radicle length and embryonic bud length increased at first and then decreased with the increase of PEG-6000 concentration, and reached the maximum value at the concentration of 5%. There was a unique cross between the control group and the 5% test group in the diurnal variation curve of Ph. edulis germination rate under drought stress. The critical and the maximum value of the seed germination of Ph. edulis were 14.49% and 19.27% under the PEG stress. (3) The final length of radicle and embryo reached the maximum at 5% concentration, and then decreased with the increase of concentration, and the difference was significant (P < 0.05). There was a unique cross between the diurnal variation curve of the radicle length of the control group and the 5% test group. The critical and the maximum value of growth of radicle of Ph. edulis were 14.49% and 19.27% under the PEG stress. (4) The activities of SOD, POD and CAT in the radicle increased with the increase of PEG concentration. And reached a maximum at concentrations of 5%, 10%, and 10%, respectively. (5) MDA and soluble protein content increased with the increase of PEG concentration, but the difference of MDA was not significant at low concentration (0%-10%). Conclusion Low concentration drought stress can inhibit the seed germination and radicle formation of Ph. edulis at the early stage of germination, but can significantly improve the final germination rate of Ph. edulis seed and promote the growth of radicle in the late period of germination. The high concentration of PEG drought stress will delay the germination of Ph. edulis and inhibit the germination rate and growth of the whole germination period. Drought stress above 15% could cause the antioxidant enzyme system of Ph. edulis to be disturbed and cause significant damage to cell membrane system. -
Key words:
- Phyllostachys edulis
- / drought stress
- / seed germination
- / polyethylene glycol
-
图 1 不同PEG浓度胁迫下毛竹种子发芽率日变化曲线
Figure 1. The daily germination percentage of Ph. edulis seeds under different concentration of PEG stress
图 2 不同PEG浓度胁迫下毛竹种子胚根平均长度日变化曲线
Figure 2. The daily radicle lengths of Ph. edulis seeds under different concentration of PEG stress
图 3 不同PEG浓度胁迫下毛竹种子胚根、胚芽平均长度
Figure 3. The radicle lengths and embryonic bud lengths of Ph. edulis seeds under different concentration of PEG stress
表 1 种子萌发及生长指标的回归分析
Table 1. The regression analysis of the indicators of seed germination and growth
指标Indicators 回归方程Regression equation 相关系数R2 临界值Critical value/% 极限值Maximum value/% GP y=-0.000 2x2-0.015 8x+0.486 1 0.909 0 14.49 19.27 Lr y=-0.007 4x2+0.083 7x+2.616 4 0.923 7 20.43 23.01 Ls y=-0.001 8x2+0.019 0x+0.658 8 0.974 1 20.05 22.79  下载: 导出CSV
表 2 不同PEG浓度胁迫下毛竹种子的发芽指数、发芽势及活力指数
Table 2. The seed germination index, germination energy and vigor index of Ph. edulis under different concentration of PEG stress
PEG浓度
PEG concentration/%发芽率
Germination percentage/%发芽指数
Germination index发芽势
Germination energy/%活力指数
Vigor index0 43.00±7.211b 24.06±4.305a 41.33±6.506b 75.72±24.195b 5 51.33±2.082a 24.08±0.582a 48.33±2.082a 98.89±2.695a 10 28.67±4.933c 11.43±2.073b 26.33±5.033c 33.85±11.71c 15 17.00±1.000d 5.70±1.157c 16.00±1.000d 17.55±5.574cd 20 7.33±0.577e 1.25±0.137e 5.33±0.577e 2.35±0.04d 25 0f 0e 0e 0d 注:同列数据后不同小写字母代表各处理之间在P<0.05水平上差异显著,下同。
Note: Different lowercase letters in each column show significant difference among different PEG concentrations at P<0.05, the same below.
下载: 导出CSV
表 3 Pearson相关性分析
Table 3. Analysis of Pearson correlation
项目Item GP VI GI GE LR LS SOD POD CAT MDA SPC GP 1 VI 0.978** 1 GI 0.980** 0.975** 1 GE 0.997** 0.979** 0.983** 1 LR 0.807** 0.824** 0.743** 0.810** 1 LS 0.866** 0.874** 0.831** 0.882** 0.836** 1 SOD 0.852** 0.788** 0.759** 0.842** 0.819** 0.830** 1 POD 0.198 0.102 0.034 0.186 0.367 0.391 0.558* 1 CAT 0.594* 0.446 0.495 0.583** 0.387 0.552** 0.685** 0.681** 1 MDA -0.900** -0.816** -0.873** -0.905** -0.740** -0.812** -0.843** -0.322 -0.708** 1 SPC -0.886** -0.849** -0.933** -0.886** -0.497 -0.638* -0.627* 0.146 -0.491 0.815** 1 注:**表示相关性在P < 0.01水平上显著,*表示相关性在P < 0.05水平上显著。
Note: ** Correlation is significant at the 0.01 level, * correlation is significant at the 0.05 level.
下载: 导出CSV
表 4 不同浓度PEG胁迫下毛竹胚根中抗氧化酶活性及MDA、可溶性蛋白的含量
Table 4. Activities of antioxidant enzymes and contents of soluble protein and MDA in Ph. edulis radicle under different concentration of PEG stress
PEG浓度
PEG concentration/%SOD活性
SOD activity/(U·g-1)POD活性
POD activity/(U·g-1)CAT活性
CAT activity/(U·g-1)MDA含量
MDA content/(nmol·g-1)可溶性蛋白含量
Soluble protein content/(mg·g-1)0 3 203.35±161.74b 8 488.89±384.90d 1 244.44±76.98b 38.37±3.51c 1.508±0.077d 5 4 343.62±176.70a 11 822.00±335.55b 1 377.78±203.67ab 42.04±6.13c 1.812±0.091c 10 3 538.78±203.34b 13 066.67±581.19a 1 511.11±76.98a 51.84±8.96c 2.236±0.102b 15 2 884.70±248.20b 10 444.44±468.25c 1 111.11±153.96bc 79.73±4.94b 2.508±0.098a 20 1 861.64±201.26d 9 288.89±428.61d 933.33±133.33c 120.94±7.05a 2.614±0.118a 25 — — — — —
下载: 导出CSV
-
[1] Gorai M, Tlig T, Neffati M. Influence of water stress on seed germination characteristics in invasive Diplotaxis harra (Forssk.) Boiss (Brassicaceae) in arid zone of Tunisia[J]. Journal of Phytology, 2009, 1(4):249-254. [2] 万春雁, 糜林, 李金凤, 等.苗期不同水分处理对草莓花芽分化及果实熟化的影响[J].果树学报, 2016, 33(12):1523-1531. [3] Chaves M M, Pereira J S, Maroco J. Understanding plant response to drought from genes to the whole plant[J]. Functional Plant Biology, 2003, 30(3):239-264. doi: 10.1071/FP02076 [4] 杨帆, 苗灵凤, 胥晓, 等.植物对干旱胁迫的响应研究进展[J].应用与环境生物学报, 2007, 13(4):586-591. doi: 10.3321/j.issn:1006-687x.2007.04.031 [5] Kudoyarova G R, Dodd I C, Veselov D S, et al. Common and specific responses to availability of mineral nutrients and water[J]. Journal of Experimental Botany, 2015, 66(8):21-33. [6] Gorai M, Aloui W E, Yang X J, et al. Toward understanding the ecological role of mucilage in seed germination of a desert shrub Henophyton deserti:interactive effects of temperature, salinity and osmotic stress[J]. Plant and Soil, 2014, 374(1):727-738. [7] Tobe K, Zhang L P, Omasa K. Seed germination and seedling emergence of three Artemisia species (Asteraceae) inhabiting desert sand dunes in China[J]. Seed Science Research, 2006, 16(1):61-69. doi: 10.1079/SSR2005230 [8] Maraghni M, Gorai M, Neffati M. Seed germination at different temperatures and water stress levels, and seedling emergence from different depths of Ziziphus lotus[J]. South African Journal of Botany, 2010, 76(3):453-459. doi: 10.1016/j.sajb.2010.02.092 [9] 杨景宁, 王彦荣.PEG模拟干旱胁迫对四种荒漠植物种子萌发的影响[J].草业学报, 2012, 21(6):23-29. [10] 李畅, 苏家乐, 刘晓青, 等.干旱胁迫对鹿角杜鹃种子萌发和幼苗生理特性的影响[J].西北植物学报, 2015, 35(7):1421-1427. [11] Hubbard M, James G, Vladimir V. Fungal endophytes improve wheat seed germination under heat and drought stress[J]. Botany-botanique, 2012, 90(2):137-149. doi: 10.1139/b11-091 [12] Yu S, Yi Z, Yao H, et al. Silicon improves seed germination and alleviates oxidative stress of bud seedlings in tomato under water deficit stress[J]. Plant Physiology and Biochemistry, 2014, 78(3):27-36. [13] 江泽慧.世界竹藤[M].沈阳:辽宁科学技术出版社, 2002. [14] 杨校生, 吴良如, 李正才, 等.毛竹经济和生态公益价值综合评价——以浙江湖州市为例[J].竹子研究汇刊, 2007, 26(1):1-5. doi: 10.3969/j.issn.1000-6567.2007.01.001 [15] Wen G S, Zhang L Y, Zhang R M, et al. Temporal and spatial dynamics of carbon fixation by moso bamboo (Phyllostachys pubescens) in subtropical China[J]. Botanical Review, 2011, 77(3):271-277. doi: 10.1007/s12229-011-9068-x [16] 施拥军, 刘恩斌, 周国模, 等.基于随机过程的毛竹笋期生长模式构建及应用[J].林业科学, 2013, 49(9):89-93. [17] 杨春菊, 陈永刚, 汤孟平, 等.不同管理模式下毛竹幼竹的生长规律[J].植物学报, 2016, 51(6):774-781. [18] Masaaki C, Yuka O, Kyoichi O. Hydrochemical characteristics of throughfall and stemflow in a moso-bamboo (Phyllostachys pubescens) forest[J]. Hydrological Processes, 2010, 24(20):2924-2933. doi: 10.1002/hyp.v24:20 [19] 李洪吉, 蔡先锋, 袁佳丽, 等.毛竹快速生长期光合固碳特征及其与影响因素的关系[J].浙江农林大学学报, 2016, 33(1):11-16. [20] Wang Y X, Bai S B, Binkley D, et al. The independence of clonal shoot's growth from light availability supports moso bamboo invasion of closed-canopy forest[J]. Forest Ecology and Management, 2016, 368:105-110. doi: 10.1016/j.foreco.2016.02.037 [21] 蔡春菊, 彭振华, 高健, 等.毛竹种子萌发特性研究[J].中国农学通报, 2008, 24(12):163-167. [22] 陈俊任, 柳丹, 吴家森, 等.重金属胁迫对毛竹种子萌发及其富集效应的影响[J].生态学报, 2014, 34(22):6501-6509. [23] 王意锟, 金爱武, 朱强根, 等.施肥对毛竹种群不同年龄分株间胸径大小关系的影响[J].植物生态学报, 2014, 38(3):289-297. [24] Li R, Werger M T A, During H J, et al. Carbon and nutrient dynamics in relation to growth rhythm in the giant bamboo Phyllostachys pubescens[J]. Plant and Soil, 1998, 201(1):113-126. doi: 10.1023/A:1004322812651 [25] 凌敏, 杨秀莲, 王良桂, 等. PEG模拟干旱胁迫对巨紫荆种子萌发及生长生理的影响[J].南京林业大学学报:自然科学版, 2015, 39(4):168-172. [26] 李宏, 程平, 郑朝晖, 等.盐胁迫对3种新疆造林树木种子萌发的影响[J].西北植物学报, 2011, 31(7):1466-1473. [27] 李合生.植物生理生化原理和实验技术[M].北京:高等教育出版社, 2000. [28] 朱慧, 马瑞君, 吴双桃, 等.干旱胁迫对五爪金龙种子萌发与幼苗生长的影响[J].西北植物学报, 2009, 29(2):344-349. doi: 10.3321/j.issn:1000-4025.2009.02.022 [29] 郭晋梅, 刘娟, 董宽虎.PEG胁迫对白羊草种子萌发的影响[J].中国草地学报, 2015, 37(2):58-62. [30] 徐振朋, 宛涛, 蔡萍, 等.PEG模拟干旱胁迫对罗布麻种子萌发及生理特性的影响[J].中国草地学报, 2015, 37(5):75-80. doi: 10.3969/j.issn.1673-5021.2015.05.013 [31] 李志萍, 张文辉, 催豫川.PEG模拟干旱胁迫对栓皮栎种子萌发及生长生理的影响[J].西北植物学报, 2013, 33(10):2043-2049. doi: 10.7606/j.issn.1000-4025.2013.10.2043 [32] 徐恒平.播前干旱锻炼对植物抗旱性的影响及其生理基础[J].干旱地区农业研究, 1989(2):87-94. [33] 郑淮兵, 董丽, 郑彩霞.低温和PEG"渗控"预处理促进石楠种子萌发的研究[J].林业科学, 2005, 41(3):54-57. doi: 10.3321/j.issn:1001-7488.2005.03.009 [34] Maraghni M, Gorai M, Neffati M. Seed germination at different temperatures and water stress levels, and seedling emergence from different depths of Ziziphus lotus[J]. South African Journal of Botany, 2010, 76(3):453-459. doi: 10.1016/j.sajb.2010.02.092 [35] 朱教君, 李智辉, 康宏樟, 等.聚乙二醇模拟水分胁迫对沙地樟子松种子萌发影响的研究[J].应用生态学报, 2005, 16(5):801-804. doi: 10.3321/j.issn:1001-9332.2005.05.005 [36] 谭晓荣, 伏毅, 戴媛.干旱锻炼提高小麦幼苗抗旱性的抗氧化机理研究[J].作物学报, 2009, (5):19-23. [37] Apel K, Hirt H. Reactive oxygen species:metabolism, oxidative stress, and signal transduction[J]. Annual Review of Plant Biology, 2004, 55(1):373-399. doi: 10.1146/annurev.arplant.55.031903.141701 [38] 催豫川, 张文辉, 李志萍.干旱和复水对栓皮栎幼苗生长和生理特性的影响[J].林业科学, 2014, 50(7):66-73. [39] Mohammadi M H S, Etemadi N, Arab M M, et al. Molecular and physiological responses of Iranian Perennial ryegrass as affected by Trinexapac ethyl, Paclobutrazol and Abscisic acid under drought stress[J]. Plant Physioligy and Biochemistry, 2017, 111:129-143. doi: 10.1016/j.plaphy.2016.11.014 [40] 李畅, 苏家乐, 刘晓青, 等.干旱胁迫对鹿角杜鹃种子萌发和幼苗生理特性的影响[J].西北植物学报, 2015, 35(7):1421-1427. [41] 莫言玲, 郑俊鶱, 杨瑞平, 等.不同西瓜基因型对干旱胁迫的生理响应及其抗旱性评价[J].应用生态学报, 2016, 27(6):1942-1952. [42] 夏方山, 闫慧芳, 毛培胜, 等 PEG引发对燕麦老化种子萌发与幼苗生长的影响[J].草业科学, 20105, 32(5):731-737. [43] 王宇超, 王得祥, 彭少兵, 等.干旱胁迫对木本滨藜生理特性的影响[J].林业科学, 2010, 46(1):61-67. [44] 单长卷, 韩蕊莲, 梁宗锁.干旱胁迫下黄土高原4种乡土禾草抗氧化特性[J].生态学报, 2012, 32(4):1174-1184. -

 点击查看大图

计量
- 文章访问数: 4360
- HTML全文浏览量: 1626
- PDF下载量: 346
- 被引次数: 0
