

-
厄尔尼诺/拉尼娜事件通过海气相互作用改变全球大气环流和水循环,厄尔尼诺事件会影响全球的季节性天气,印度尼西亚、澳大利亚、印度、非洲的东南部以及巴西的东北部易发生干旱,北美洲和南美洲西海岸降雨增多[1]。在中、高纬度地区,如日本东部、朝鲜,冬季容易出现暖冬。厄尔尼诺的发生导致林火发生频率、林火发生强度和过火面积随气候的变化不断增加[2]。Chen等[3]研究表明厄尔尼诺事件减少热带森林中的降雨和蓄水,利于火灾的发生和蔓延,导致森林火灾平均增加133%。1983年,中等强度厄尔尼诺导致气候异常,印度尼西亚东加里曼丹发生特大森林火灾,过火面积360万hm2。1994年,中等强度等级的厄尔尼诺事件导致澳大利亚新南威尔士州发生干旱并发生特大森林火灾,过火面积100万hm2。1997—1998年的厄尔尼诺事件是二十世纪遭遇的最极端的天气事件,使印度尼西亚经历了严重的干旱,导致了大规模的森林火灾,过火面积超过456万hm2[4],澳大利亚也发生特大森林火灾,过火面积150万hm2。美国西南部的森林火灾异常也常与ENSO(厄尔尼诺与南方涛动的总称)事件有关[5]。2003年,厄尔尼诺事件期间,美国加利福尼亚州南部发生特大森林火灾,过火面积30万hm2。墨西哥大多数森林火灾是由ENSO事件引起的天气条件异常而引起的[6]。
一些研究采用指数计算、模型模拟和相关性统计等数学方法分析了ENSO与森林火灾发生的内在联系。如Guadalupe等[7]通过采用多元ENSO指数(MEI),研究2000—2001年平均MEI值与火灾发生的关系,发现安第斯山脉地区ENSO的强度与燃烧面积呈正相关。Kitzberge等[8]研究了北美洲西部地区林火和SST数据重建的气候模型和火灾之间的同步性,发现ENSO和PDO(太平洋十年振荡)是高频火灾变化的主要驱动因素,而AMO(大西洋多年振荡)改变了ENSO和PDO对野火强度和分布的影响。Harrison等[9]对佛罗里达州ENSO事件(厄尔尼诺年、拉尼娜年和正常年)和野火年发生率进行统计分析,发现林火与ENSO事件显著相关。Moy等[10]研究表明ENSO事件频率的增加会导致夏季干旱增加和频繁的火险天气,导致厄瓜多尔南部地区火行为的增加。
与正常年份相比,厄尔尼诺年,中国大部分地区冬春季气温偏高,夏秋季气温偏低;拉尼娜年,则情况相反[11]。厄尔尼诺事件与森林火灾相关性显著,拉尼娜对森林火灾的影响较厄尔尼诺的影响要小[12]。厄尔尼诺年,火灾面积和火灾次数会异常增高;拉尼娜年,SOI(南方涛动指数)与火灾次数和火灾面积呈正相关,即SOI指数升高(降低),火灾面积和火灾次数随之增加(减少)[12]。厄尔尼诺当年及次年,黑龙江省森林火灾面积常常增加[13]。华北地区夏季降水较少[14], 强厄尔尼诺事件对该地区夏季的干旱起重要作用[15]。厄尔尼诺引起的高温和干旱天气导致华北林区春季的火灾严重[16]。张艳平发现厄尔尼诺现象对森林火灾年际活动的影响是显著的,厄尔尼诺年及次年森林火灾过火面积有显著增加趋势[17]。
火天气指数(fire weather index,FWI)系统是以时滞-平衡含水率理论为基础,通过天气因子预测各类可燃物的含水率和火险情况。Flannigan等[18]利用FWI系统对加拿大未来的森林火险进行模拟。Stocks等[19]通过FWI系统研究气候变化对俄罗斯和加拿大北方林火的影响,发现出现极端火险的区域将大大增加。田晓瑞等[20]对加拿大火险天气系统在我国的适用性方面做了相关研究,认为该系统可以在大兴安岭地区应用。本研究通过研究1951—2016年厄尔尼诺/拉尼娜事件对大兴安岭天气和火天气指数的影响,定量描述厄尔尼诺/拉尼娜事件在火天气指数变化中的作用,将有助于提高森林火险预报的准确性。
-
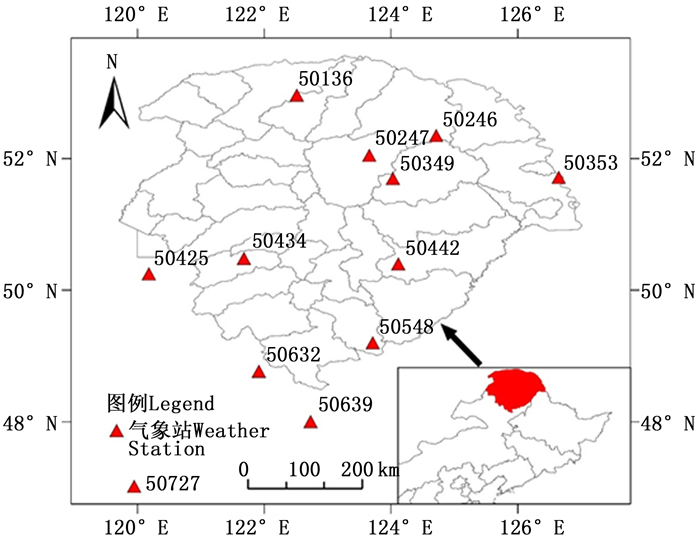
大兴安岭林区是我国重要的天然林区,位于黑龙江省、内蒙古自治区东北部(47°10′~53°33′ N,119°12′~127°00′ E),面积835万hm2(图 1)。大兴安岭有林地面积653.2万hm2,森林覆盖率为78.4%。地势起伏不大,中西部高,东部、北部以及南部偏低,平均海拔573 m,境内最高海拔1 528.7 m[21]。大兴安岭林区属于寒温带针叶林区,主要的树种类型有落叶松(Larix gmelini (Rupr, ) Rupr.)、樟子松(Pinus sylvestris var. mongolica Litvin.)和偃松(Pinus pumila (Pall.) Regel)等针叶树和白桦(Betula platyphylla Suk.)、山杨(Populus davidiana Dode)和蒙古栎(Quercus mongolica Fisch.)等阔叶林[21]。气候属于寒温带大陆性季风气候,冬季寒冷而漫长,夏季炎热而短暂,年温差较大,全年平均温度-2℃~4℃,春季升温快,风速大,干燥少雨。年降水量为450~500 mm,年蒸发量为900~1 000 mm[22]。

图 1 研究区位置和气象站分布
Figure 1. Study area and distribution of weather stations
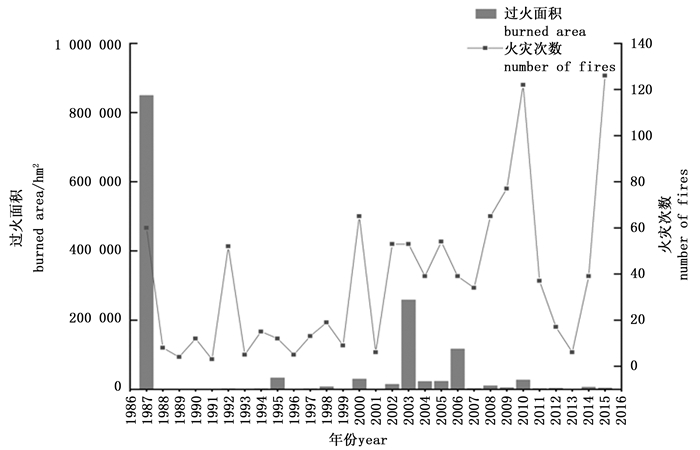
大兴安岭是我国的重点火险区,而且该区森林对气候变化非常敏感,每年都有森林火灾发生。大兴安岭林火发生波动较大(图 2),1987—2015年平均每年发生森林火灾36次,年均过火面积4.86万hm2。1987、2003和2006年森林过火面积较高,分别占总过火面积的60.24%,18.31%和8.23%。2010和2015年火灾发生次数分别为122次和126次,占总次数11.63%和12.01%。春秋季为该区森林火灾高发期,其中5月份和6月份火灾次数分别占全部火灾发生次数的16.01%和15.16%,5月份森林过火面积占总过火面积的83.48%。1987—2015年大兴安岭地区人为火和雷击火分别占58.56%和41.44%,雷击火主要发生在夏季。

图 2 1987—2015年森林火灾次数和森林过火面积
Figure 2. Number of forest fires and forest burned area in 1987—2015
-
气象数据采用1951—2016年中国地面国际交换站气候资料日值数据集(V3.0)(中国气象数据网),包括大兴安岭及其周边气象站(漠河、塔河、呼中、新林、呼玛、加格达奇、图里河、博克图、小二沟、额尔古纳市、扎兰屯)的日最高气温、日最小相对湿度、平均风速和24 h降水量。
-
气象数据缺失数据超过7天,则利用临近气象站的数据进行补缺。如果最高气温缺失,则采用临近气象站数据补缺。微量降水设定为0.1 mm(不是有效降水,对于森林火险天气指数的计算没有影响)。风速的缺失值采用对应月份的平均值。最小相对湿度值缺失,根据各年代每日有效观测值分月构建最小相对湿度的关系模型,利用构建的关系模型计算最小相对湿度。
-
根据INIÑO3.4(NIÑO3.4区海面温度距平的平均值)3个月滑动平均的绝对值达到最大的时间和数值分别定义事件的峰值时间和峰值强度,峰值强度绝对值达到0.5℃小于1.3℃定义为弱事件,达到或超过1.3℃小于2.0℃定义为中等事件,达到或超过2.0℃定义为强事件,达到或超过2.5℃定义为超强事件[23]。1950—2016年共发生厄尔尼诺事件19次,其中弱、中等、强和超强事件分别为8、7、1和3次;拉尼娜14次,其中弱、中等和强事件分别为5、8和1次。由于强拉尼娜和强厄尔尼诺事件都只有1次,所以不对其进行单独分类。将1950—2016年发生的厄尔尼诺/拉尼娜事件分为超强和强厄尔尼诺事件、中等和弱厄尔尼诺事件和拉尼娜事件3种情景分别与正常年进行对比分析。如果厄尔尼诺/拉尼娜事件结束后的3个月与某火险期有重合期,认为该事件对火险期的气候和火险天气有影响,按照对应的分类情景进行统计分析;如果一个火险期位于厄尔尼诺/拉尼娜事件发生前或者事件结束3个月后,则认为对该火险期没有影响,该火险期作为正常年份统计。
-
FWI系统基于每天14:00时连续观测记录的4个气象因子,输出多个林火天气指标[24],该指数系统包括6个组分指数,3个可燃物湿度码:FFMC(细小可燃物湿度码)、DMC(腐殖质湿度码)、DC(干旱码)和3个火行为指数:ISI(初始蔓延速度)、BUI(累积指数)、FWI(火天气指数)[25]。由于缺乏定时数据,所以采用平均风速、日最高气温、日最小相对湿度、平均风速和24 h降水量分别计算每日代表不同含水率和火行为指标的火天气指数,可燃物湿度码FFMC、DMC和DC的初始值赋值分别为85、6和15。
-
利用方差分析,比较林火天气和6个组分指数在超强和强以及中等和弱厄尔尼诺年、拉尼娜年和正常年总体均值的显著性。对于不满足方差齐性的指数,进行对数变换,以校正非正态性和方差不齐性。满足方差齐性后,对春秋两季火险期的火天气指数采用Welch近似F检验,多重比较采用Dunnett’s T3法分析,以检验各组分指数均值在不同气候情景下的显著差异水平。
-
春季火险期,超强和强厄尔尼诺年日均最高气温为16.60℃,较正常年份偏低0.21℃,降水量较正常年份(136.36 mm)增加了6.78%,其中6月份日均最高气温偏低0.94℃;中等和弱厄尔尼诺年日均最高气温与正常年份差异不显著,降水量较正常年份降低了1.85%;拉尼娜年日均最高气温为17.25℃,较正常年份升高0.44℃,降水量增加2.77 mm(表 1)。
表 1 厄尔尼诺/拉尼娜事件对大兴安岭火险期日均最高气温和降水的影响
Table 1. Influence of El Niño/ La Niña on average maximum temperature and precipitation in Daxing'anling during fire season
项目
Items时段
Period正常年份
Normal years与正常年份的差值
Difference between the scenarios and the normal years超强和强厄尔尼诺年
Super strong and strong intensity El Niño years中等和弱厄尔尼诺年
Moderate and weak intensity El Niño years拉尼娜年
La Niña years日均最高气温A
verage maximum temperature/℃春季火险期Spring fire season
秋季火险期Autumn fire season16.81
12.44-0.21
-1.53-0.15
-0.140.44
-0.16降水量
Precipitation/mm春季火险期Spring fire season
秋季火险期Autumn fire season136.36
67.739.24
9.69-2.52
2.162.77
2.50秋季火险期,超强和强厄尔尼诺年、中等和弱厄尔尼诺年以及拉尼娜年日均最高气温分别为10.91℃、12.30℃和12.28℃,均低于正常年份(12.44℃),其中10月份超强和强厄尔尼诺年日均最高气温偏低1.8℃。超强和强厄尔尼诺年、中等和弱厄尔尼诺年和拉尼娜年的降水量均大于正常年份(67.73 mm),其中超强和强厄尔尼诺年增加了14.31%。中等和弱厄尔尼诺年和拉尼娜年分别增加2.16 mm和2.50 mm,差异不显著。
-
春季火险期各火天气指数在不同天气情形之间无显著差别(P>0.05)(表 2)。与正常年份相比,超强和强厄尔尼诺年春季火险期的FFMC、DMC、DC、BUI和FWI降低;中等和弱厄尔尼诺年FFMC、DMC、DC、BUI、ISI和FWI小于正常年份;拉尼娜年FFMC、ISI和FWI小于正常年份,DMC、DC和BUI大于正常年份,但差异都不显著。
表 2 4类天气情形下的大兴安岭春季火险期火天气指数的比较
Table 2. Compares of the fire weather indices in spring fire season in Daxing'anling under four weather scenarios
指数
Indices正常年份
Normalyears与正常年份的差值 Difference between the scenarios and the normal years 超强和强厄尔尼诺年
Super strong and strong intensity El Niño years中等和弱厄尔尼诺年
Moderate and weak intensity El Niño years拉尼娜年
La Niña yearsFFMC 84.21 -0.18 -0.17 -0.17 DMC 45.35 -3.76 -2.09 0.20 DC 259.51 -23.09 -1.49 13.18 BUI 58.90 -4.25 -2.03 0.83 ISI 8.02 0.19 -0.30 -0.23 FWI 19.01 -0.48 -1.00 -0.25 秋季火险期的各火天气指数在超强和强厄尔尼诺年均低于正常年份(表 3)。超强和强厄尔尼诺年6个火天气指数均与正常年份之间存在显著区别(P < 0.05),其中DC和ISI分别降低了21.92%和21.47%;中等和弱厄尔尼诺年6个火天气指数与正常年份之间无显著差别,除FFMC外均低于正常年份;拉尼娜年FFMC、DMC、BUI、ISI和FWI低于正常年,DC比正常年份稍高。
表 3 4类天气情形下的大兴安岭秋季火险期火天气指数的比较
Table 3. Compares of the fire weather indices in autumn fire seasons in Daxing'anling under four weather scenarios
指数
Indices正常年份
Normalyears与正常年份的差值 Difference between the scenarios and the normal years 超强和强厄尔尼诺年
Super strong and strong intensity El Niño years中等和弱厄尔尼诺年
Moderate and weak intensity El Niño years拉尼娜年
La Niña yearsFFMC 81.92 -4.30* 0.33 -1.12 DMC 29.97 -10.59* -0.27 -5.05* DC 239.10 -52.40* -2.00 17.83 BUI 42.98 -14.18* -0.38 -5.53* ISI 5.17 -1.11* -0.10 -0.42* FWI 11.89 -3.90* -0.25 -1.47* 注:*代表均值差值在α=0.05显著
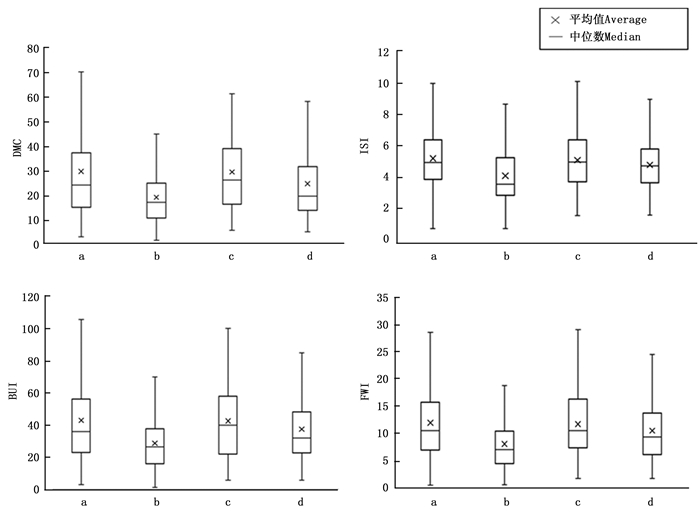
Note: * mean value difference is significant in α=0.05对秋季火险期存在显著区别的DMC、BUI、ISI和FWI进行箱线图分析(图 3)。DMC在超强和强厄尔尼诺年、中等和弱厄尔尼诺年和拉尼娜年平均值分别为19.39、29.70和24.92,均小于正常年的29.97,超强和强、中等和弱厄尔尼诺年数据分布较对称。BUI在超强和强厄尔尼诺年、中等和弱厄尔尼诺年和拉尼娜年平均值分别为28.80、42.60和37.46,均小于正常年的42.98,其中超强和强厄尔尼诺年数据分布较集中。ISI在超强和强厄尔尼诺年、中等和弱厄尔尼诺年、拉尼娜年都低于正常年,其中超强和强厄尔尼诺年数据分布不平衡。FWI在4种情景下数据分布对称,在超强和强厄尔尼诺年、中等和弱厄尔尼诺年和拉尼娜年平均值分别为7.99、11.64和10.41,小于正常年(11.89),超强和强厄尔尼诺年FWI波动范围较小。

图 3 大兴安岭地区秋季火险期火天气指数箱线图
Figure 3. The boxplot of indices of Daxing'anling in May
-
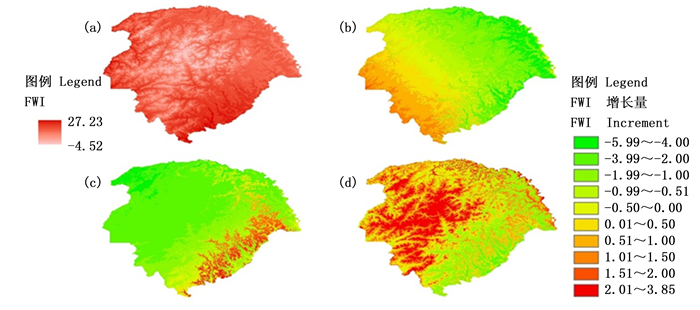
大兴安岭地区春季火险期,正常年FWI平均值为13.31(变动范围-4.52~27.23),中部火天气指数比正常年偏低4.52,东南部地区火天气指数较高。超强和强厄尔尼诺年FWI较正常年份偏低,平均值为12.28,变化幅度为-5.99~-0.50,FWI从西南到东北逐渐降低,表明超强和强厄尔尼诺年西南地区的火险更高。中等和弱厄尔尼诺年,FWI东部和南部区域增加(范围0.50~4.66)。拉尼娜年FWI平均值为13.83(变动范围-2.78~3.84),东部低于正常年份,而中西部偏高(图 4)。
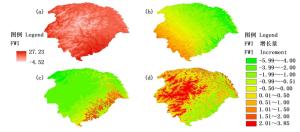
图 4 厄尔尼诺/拉尼娜对大兴安岭地区春季火险期FWI指数的影响
Figure 4. Influence of El Niño / La Niña on FWI in spring fire season in Daxing'anling
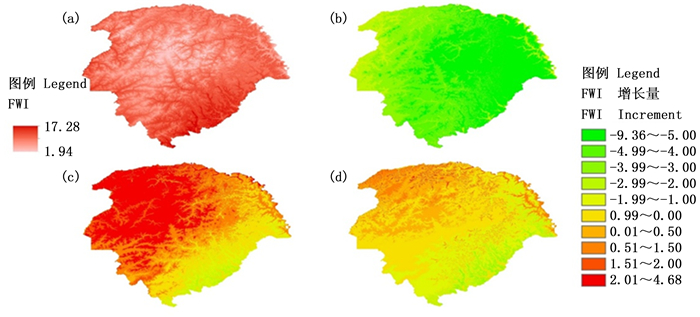
大兴安岭地区秋季火险期正常年的平均FWI为9.01(变动范围1.94~17.28),中部火天气指数较低。超强和强厄尔尼诺年大兴安岭地区FWI低于正常年份(范围-9.36~-0.42)。中等和弱厄尔尼诺年平均值为10.07,东南部FWI较正常年份低(范围-3.83~-0.03),西北部和中部较正常年高(范围0.01~2.58)。拉尼娜年FWI低于正常年,西北部地区火天气指数高于东南部地区(图 5)。
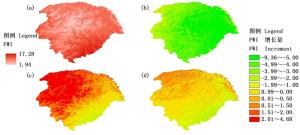
图 5 厄尔尼诺/拉尼娜对大兴安岭地区秋季火险期FWI指数的影响
Figure 5. Influence of El Niño / La Niña on FWI index in autumn fire season in Daxing'anling
-
当前我国对于厄尔尼诺/拉尼娜事件与森林火灾的研究主要是对厄尔尼诺/拉尼娜事件影响的定性描述和概括性分析,如田晓瑞等定性分析厄尔尼诺引起的暖冬和干早会导致我国春季火灾严重[25],万里鹏等[26]简单描述了大兴安岭地区拉尼娜出现后,春季(4—6月)的火险趋势偏低的机率大,偏高的机率很小,且研究周期较短。本研究对1951—2016年厄尔尼诺/拉尼娜事件对火天气指数进行定量分析,且研究周期较长。
王明玉等[12]通过对黑龙江省1980—1999年森林火灾数据、NIñO3.4指数和SOI指数进行谱分析,发现厄尔尼诺年火灾面积、次数会异常增高。但火灾面积与火灾次数不仅与气候有关,还受可燃物、地形和火源等影响,简单分析SOI与火灾面积和次数的关系,结果不确定性大。本研究根据厄尔尼诺/拉尼娜事件判别标准按照不同峰值强度分为超强和强厄尔尼诺年、中等和弱厄尔尼诺年、拉尼娜年和正常年四种情景,按春季和秋季火险期分别研究天气因子和火天气指数的差异。相比把厄尔尼诺年笼统地分析,可以更准确地了解不同强度的厄尔尼诺/拉尼娜事件对森林火险天气的影响。
虽然1951—2016年大兴安岭地区的厄尔尼诺年火天气指数平均值低于正常年份,但个别年份会高于正常年份。如1986年秋季火险期的火天气指数均高于正常年份,DMC、DC和FWI分别比正常年份高59.53%、18.45%和41.80%,1987年春季火险期DMC、DC和FWI仍高于正常年份7.08%,0.38%和86.46%。1986年8月—1988年2月发生强厄尔尼诺事件,受该事件影响,1986年冬季中国北方气温偏高2℃以上[27],大兴安岭平均气温比往年高0.7℃,降水量均比历史平均值减少8%。1987年春季降水也少于常年,高火险天气有利于森林火灾的发生和蔓延,1987年5月发生了特大森林火灾,过火面积133万hm2。极端气候事件对该区域一些时段的林火天气有显著影响,未来需要在不同空间尺度上研究气候-可燃物-林火动态的关系,研究极端气候事件对林火动态的影响机制。
-
春季和秋季火险期,不同强度厄尔尼诺事件影响大兴安岭地区火险期的日均最高气温和降水量。拉尼娜年春季火险期,日均最高气温高于正常年份,降水量较正常年份减少,秋季火险期反之。
春季火险期,超强和强厄尔尼诺年、中等和弱厄尔尼诺年以及拉尼娜年各火天气指数较正常年份偏低。秋季火险期超强厄尔尼诺年均存在显著差别且较正常年份偏低;中等和弱厄尔尼诺年除FFMC外均低于正常年份。
厄尔尼诺/拉尼娜事件对大兴安岭地区FWI空间差异性的影响不同。大兴安岭春季火险期,超强和强厄尔尼诺年FWI从西南到东北逐渐降低;中等和弱厄尔尼诺年东部和南部地区FWI值较正常年份偏高;拉尼娜年东部偏低,中西部偏高。秋季火险期,超强和强厄尔尼诺年FWI值西部地区高于东部地区;中等和弱厄尔尼诺年东南部FWI偏低,西北部和中部偏高。
厄尔尼诺/拉尼娜对大兴安岭森林火险天气的影响
Impacts of El Niño/La Niña on Fire Weather of Daxing'anling
-
摘要:
目的 通过研究厄尔尼诺/拉尼娜事件对大兴安岭天气和火天气指数的影响,定量描述厄尔尼诺/拉尼娜事件在火天气指数变化中的作用。 方法 根据研究区及周边气象站日最高气温、日最小相对湿度、平均风速和24 h降水量计算1951-2016年大兴安岭森林火险天气指数,分析超强和强厄尔尼诺年、中等和弱厄尔尼诺年、拉尼娜年和正常年等4种情景下的主要天气因子和火天气指数的差异。 结果 春季火险期,超强和强厄尔尼诺年日均最高气温较正常年偏低0.21℃,降水量增加6.78%,拉尼娜年日均最高气温增加0.44℃,降水量增加2.77 mm;厄尔尼诺/拉尼娜年的秋季火险期日均最高气温低于正常年。超强和强厄尔尼诺年春季和秋季火险期的细小可燃物湿度码(FFMC)、腐殖质湿度码(DMC)、干旱码(DC)、累积指数(BUI)和火天气指数(FWI)平均值低于正常年份,FWI从西南到东北逐渐降低;中等和弱厄尔尼诺年春季火险期6个指数均低于正常年份,秋季火险期除FFMC外其他火天气指数均低于正常年份;拉尼娜年春季火险期的FFMC、初始蔓延速度(ISI)和FWI低于正常年份,秋季火险期除DC外其他指数均低于正常年份。 结论 大兴安岭地区在超强和强厄尔尼诺年春秋季火险期火天气指数较正常年份低,西部地区火天气指数高于东部地区。拉尼娜年春季火险期东部地区FWI低于正常年份,中西部偏高,秋季火险期西北部地区高于正常年份,东南部偏低。 Abstract:Objective To Study the impacts of the El Niño/La Niña events on the fire weather of Daxing'anling so as to improve the accuracy of fire danger forecasting. Method The values of fire weather index during 1951-2016 were calculated including the daily maximum temperature, the minimum relative humidity, the average wind speed, and the 24-hour precipitation collected by weather stations in the study area, and the differences of the weather and fire weather indices under four scenarios of the super strong and strong El Niño, moderate and weak El Niño, La Niña and normal years were analyzed respectively. Result Compared with the normal year, the average daily maximum temperature in the spring fire season in super strong and strong El Niño years decreased by 0.21℃, and precipitation increased by 6.78%. In spring fire season of La Niña years, the average daily maximum temperature was 0.44℃ higher, and the precipitation increased by 2.77mm. The daily maximum temperature of autumn fire season in El Niño/La Niña years was lower than that of the normal years. The average of fine fuel moisture code (FFMC), duff moisture code (DMC), drought code (DC), build up index (BUI) and fire weather index (FWI) in spring and autumn fire season under the situations of super strong and strong El Niño event were lower than those in normal years, and the FWI gradually decreased from southwest to Northeast. All six component fire weather indices of spring fire season in moderate and weak El Niño years were lower than those in normal years and also lower in autumn fire season except FFMC. In La Niña years, the FFMC, the initial spread index (ISI) and the FWI of spring fire season were lower than those of normal years, and all the indexes were lower than those in normal years as well, except for DC. Conclusion The forest fire weather index of super strong and strong El Nino in spring and autumn fire season was lower than that of the normal years in Daxing'anling, and the index of the western region was higher than that in the eastern region. In La Niña year, The FWI in spring fire season in the eastern region was lower than normal years and higher in the midwest. The FWI was higher than the normal years in northwest region and lower in southeastern in autumn fire season. -
Key words:
- El Niño
- / La Niña
- / fire weather index
- / Daxing'anling
-
图 2 1987—2015年森林火灾次数和森林过火面积
Figure 2. Number of forest fires and forest burned area in 1987—2015
图 4 厄尔尼诺/拉尼娜对大兴安岭地区春季火险期FWI指数的影响
Figure 4. Influence of El Niño / La Niña on FWI in spring fire season in Daxing'anling
图 5 厄尔尼诺/拉尼娜对大兴安岭地区秋季火险期FWI指数的影响
Figure 5. Influence of El Niño / La Niña on FWI index in autumn fire season in Daxing'anling
表 1 厄尔尼诺/拉尼娜事件对大兴安岭火险期日均最高气温和降水的影响
Table 1. Influence of El Niño/ La Niña on average maximum temperature and precipitation in Daxing'anling during fire season
项目
Items时段
Period正常年份
Normal years与正常年份的差值
Difference between the scenarios and the normal years超强和强厄尔尼诺年
Super strong and strong intensity El Niño years中等和弱厄尔尼诺年
Moderate and weak intensity El Niño years拉尼娜年
La Niña years日均最高气温A
verage maximum temperature/℃春季火险期Spring fire season
秋季火险期Autumn fire season16.81
12.44-0.21
-1.53-0.15
-0.140.44
-0.16降水量
Precipitation/mm春季火险期Spring fire season
秋季火险期Autumn fire season136.36
67.739.24
9.69-2.52
2.162.77
2.50 下载: 导出CSV
表 2 4类天气情形下的大兴安岭春季火险期火天气指数的比较
Table 2. Compares of the fire weather indices in spring fire season in Daxing'anling under four weather scenarios
指数
Indices正常年份
Normalyears与正常年份的差值 Difference between the scenarios and the normal years 超强和强厄尔尼诺年
Super strong and strong intensity El Niño years中等和弱厄尔尼诺年
Moderate and weak intensity El Niño years拉尼娜年
La Niña yearsFFMC 84.21 -0.18 -0.17 -0.17 DMC 45.35 -3.76 -2.09 0.20 DC 259.51 -23.09 -1.49 13.18 BUI 58.90 -4.25 -2.03 0.83 ISI 8.02 0.19 -0.30 -0.23 FWI 19.01 -0.48 -1.00 -0.25
下载: 导出CSV
表 3 4类天气情形下的大兴安岭秋季火险期火天气指数的比较
Table 3. Compares of the fire weather indices in autumn fire seasons in Daxing'anling under four weather scenarios
指数
Indices正常年份
Normalyears与正常年份的差值 Difference between the scenarios and the normal years 超强和强厄尔尼诺年
Super strong and strong intensity El Niño years中等和弱厄尔尼诺年
Moderate and weak intensity El Niño years拉尼娜年
La Niña yearsFFMC 81.92 -4.30* 0.33 -1.12 DMC 29.97 -10.59* -0.27 -5.05* DC 239.10 -52.40* -2.00 17.83 BUI 42.98 -14.18* -0.38 -5.53* ISI 5.17 -1.11* -0.10 -0.42* FWI 11.89 -3.90* -0.25 -1.47* 注:*代表均值差值在α=0.05显著
Note: * mean value difference is significant in α=0.05
下载: 导出CSV
-
[1] Iizumi T, Luo J J, Challinor A J, et al. Impacts of El Niño Southern Oscillation on the global yields of major crops[J]. Nature Communications, 2014, (5):3712-3719. [2] Bellen S V, Garneau M, Bergeron Y. Impact of climate change on forest fire severity and consequences for carbon stocks in boreal forest stands of Quebec, Canada:a synthesis.[J]. Fire Ecology, 2010, 6(6):16-44. [3] Chen Y, Morton D C, Andela N, et al. A pan-tropical cascade of fire driven by El Niño/Southern Oscillation[J]. Nature Climate Change, 2017, 7(12):906-911. doi: 10.1038/s41558-017-0014-8 [4] 许武成, 王文, 马劲松, 等. 1997-1998年厄尔尼诺事件的特征、成因及对气候的影响[J].东海海洋, 2004, 22(3):1-8. doi: 10.3969/j.issn.1001-909X.2004.03.001 [5] McDonald A K, Doan-Crider D. Wildfire Impacts on Surface Waters[EB/OL]. http://liberty.agrilife.org/files/2015/11/Wildfire-Impacts-on-Surface-Waters.pdf, 2014. [6] Herrera G V. Mexican Forest Fires and their Decadal Variations[J]. Advances in Space Research, 2016, 58(10):2104-2115. doi: 10.1016/j.asr.2016.08.030 [7] Guadalupe L E, Gómezrodríguez G, Islas A, et al. Análisis del efecto de El Niño y La Niña en el Lago de Tecocomulco, cuenca central de México[J]. Hidrobioloógica, 2011, 21(3):249-259. [8] Kitzberger T, Brown P M, Heyerdahl E K et al. Contingent Pacific-Atlantic Ocean influence on multicentury wildfire synchrony over western North America[J]. Proceedings of the National Academy of Sciences, 2007, 104(2):543-548. doi: 10.1073/pnas.0606078104 [9] Harrison M, Christopher F M. A Statistical Relationship Between El Niño-Southern Oscillation And Florida Wildfire Occurrence[J]. Physical Geography, 2001, 22(3):187-203. doi: 10.1080/02723646.2001.10642737 [10] Moy C M, Seltzer G O, Rodbell D T, et al. Variability of El Niño/Southern Oscillation activity at millennial timescales during the Holocene epoch[J]. Nature, 2002, 420(6912):162-165. doi: 10.1038/nature01194 [11] 郑冬晓, 杨晓光. ENSO对全球及中国农业气象灾害和粮食产量影响研究进展[J].气象与环境科学, 2014, 37(4):90-101. doi: 10.3969/j.issn.1673-7148.2014.04.013 [12] 王明玉, 舒立福, 田晓瑞, 等. ENSO对黑龙江省森林火灾的影响[J].林业科学研究, 2010, 23(5):644-648. [13] 王述洋.厄尔尼诺——南方涛动异常对森林火灾年际活动规律的影响[J].世界林业研究, 1993, 6(1):31-38. [14] 赵思文, 李俊乐, 刘多文, 等. PDO和ENSO与我国华北地区夏季降水的关系分析[J].江西农业学报, 2016, 28(7):121-125. [15] 高辉, 王永光. ENSO对中国夏季降水可预测性变化的研究[J].气象学报, 2007, 65(1):131-137. doi: 10.3321/j.issn:0577-6619.2007.01.013 [16] 田晓瑞, 王明玉, 舒立福.全球变化背景下的我国林火发生趋势及预防对策[J].森林防火, 2003(3):32-34. doi: 10.3969/j.issn.1002-2511.2003.03.012 [17] 张艳平.黑龙江大兴安岭地区气候变化对森林火灾影响的研究[D].哈尔滨: 东北林业大学, 2008. [18] Flannigan M D, Amiro B D, Logan K A, et al. Forest Fires and Climate Change in the 21 ST, Century[J]. Mitigation & Adaptation Strategies for Global Change, 2006, 11(4):847-859. [19] Stocks B J, Fosberg M A, Lynham T J, et al. Climate Change and Forest Fire Potential in Russian and Canadian Boreal Forests[J]. Climatic Change, 1998, 38(1):1-13. [20] 田晓瑞, McRae D J, Jin J, 等.大兴安岭地区森林火险变化及FWI适用性评估[J].林业科学, 2010, 46(5):127-132. [21] 徐化成.中国大兴安岭森林[M].北京:科学出版社, 1998, 5-6. [22] 刘庚正.大兴安岭概况[M].北京:中华书局出版社, 2002. [23] 中国气象局.QX/T 370-2017.厄尔尼诺/拉尼娜事件判别方法[S].北京: 中国质检出版社, 2017. [24] Turner J A, Lawson B D. Weather in the Canadian forest fire danger rating system. A user guide to national standards and practices[R]. Report. Pacific Forest Research Centre (Canada). no. BC-X-177. 1978. [25] 田晓瑞, 舒立福, 王明玉, 等.林火与气候变化研究进展[J].世界林业研究, 2006, 19(5):38-42. doi: 10.3969/j.issn.1001-4241.2006.05.007 [26] 万里鹏, 关兴民, 万正奎, 等.大兴安岭森林火灾的气候背景[J].森林防火, 1996(2):18-20. [27] 舒立福, 田晓瑞, 吴鹏超.厄尔尼诺现象对森林火灾的影响研究[J].森林防火, 1999(4):27-28. -

 点击查看大图
计量
- 文章访问数: 4198
- HTML全文浏览量: 1516
- PDF下载量: 281
- 被引次数: 0
