


-
取样策略是指对一定区域分布范围内的植物个体取样时,使取样样本具有代表性和包含尽可能多的遗传变异的最佳取样方法,包括取样群体数量和群体内的个体数以及取样方式等[1]。由于人力和物力等条件的限制,一般不可能对每个物种的所有群体和个体都进行收集或保护,只能收集或保护其中的一部分。在种质资源收集和遗传多样性保护过程中,希望在可操作的前提下,抽取的样本能包含尽可能多的遗传变异,能够反映该物种在进化过程中形成的特定时空遗传结构。如果没有一个合理的取样策略,收集和保护的种质资源很难客观反映研究对象的遗传多样性;同时,植物取样策略很大程度上受到植物自身的生物学和生态学特性、环境条件和取样目的等方面的影响[2-4]。因此,应根据植物自身特性,制定适宜的取样策略。目前,在植物取样策略研究中,草本植物取样策略研究较多[5-7],而木本植物取样策略鲜见报道。
合理的取样策略制定主要包括以下4个方面内容:群体的数量、目标群体的选择、群体内单株的数量和单株之间的距离。为获得这些信息,应首先了解所研究物种遗传多样性及其空间遗传结构。遗传多样性的研究可以揭示群体的遗传多样性水平以及群体间遗传分化程度等;空间遗传结构对天然群体的取样策略有重要指导作用[8],对遗传变异空间结构的研究有助于提高取样的效率,从而达到最大限度地保护和利用遗传多样性的目的[9]。空间自相关分析是研究遗传变异空间结构的一种有效方法,尤其是在小尺度空间范围内,用来检测与量化多个观测数据之间潜在的相互空间依赖性[10-11]。
毛红椿(Toona ciliata var. pubescens (Franch.) Hand.-Mazz.)为楝科(Meliaceae)香椿属(Toona Roem.)落叶大乔木,雌雄同株,花较小,花粉和种子分别主要靠昆虫和风力传播;其生长迅速,树干通直,材质曙红,木纹美丽,素有“中国桃花心木”之称,是热带和亚热带地区珍贵用材树种,具有很高的经济价值和开发前景[12-13]。毛红椿在我国主要分布于江西、浙江、安徽、贵州和云南等省份,由于人为砍伐、环境变化以及其天然更新较缓慢等原因,天然群体数量不断减少。目前,浙江仙居和遂昌、安徽泾县、江西官山以及云南元谋、宾川、师宗、武定和贵州册亨等群体保存较好,群体内单株数量较多[14]。毛红椿被列为国家二级保护濒危种,同时也被各分布省列为珍稀濒危树种[15-17]。
目前,已开展了毛红椿天然群体遗传结构、空间遗传结构以及群落结构等[11, 18-19]方面的研究,但未涉及毛红椿遗传多样性保护中天然群体的取样策略问题。毛红椿野生资源分布较广,其天然群体表型变异和分子变异丰富[18],适宜的取样策略是群体遗传学研究的基础, 制定毛红椿天然群体遗传多样性取样策略,对该树种资源保护和合理开发利用具有重要意义。因此,本文利用所收集的毛红椿9个天然群体材料,在获取群体遗传多样性和空间遗传结构的基础上,系统探讨毛红椿天然群体合理取样策略,包括取样群体数量、目标群体的选择、群体内取样单株数量以及取样单株间距离,为毛红椿和类似生物学特性树种的遗传多样性保护、种质资源收集和保存提供参考。
-
对分布于浙江、江西、安徽、贵州和云南5省9个毛红椿天然群体进行实地调查,所调查天然群体情况和取样数量见表 1。为避免重复取样,毛红椿单株间相距50 m以上。分单株采集树冠中上部叶片,并迅速用变色硅胶干燥,硅胶与叶片质量比为10:1,共收集384个单株材料。利用手持GPS(eXporist 600,美国Magellan公司)对每个取样单株进行定位,定位精度为7 m。
表 1 毛红椿9个天然群体地理位置和采样数量
Table 1. Geographic places and individual numbers of nine natural populations of T. ciliata var. pubescens
群体Population 东经E 北纬N 海拔高度Altitude/m 面积Area/ hm2 采样数量Number 江西宜丰YF 114°29′~114°45′ 28°30′~28°40′ 220~475 68 65 浙江遂昌SC 119°12′~119°23′ 28°30′~28°36′ 5101 220 30 25 浙江仙居XJ 120°32′~120°56′ 28°48′~28°56′ 600820 32 27 云南元谋YM 101°49′~101°52′ 25°17′~25°40′ 1 112~1 230 18 30 安徽泾县JX 118°35′~118°36′ 30°31′~30°34′ 270~497 28 48 贵州册亨CH 105°40′~105°52′ 24°36′~24°55′ 620810 25 24 云南宾川BC 100°16′~101°23′ 25°02′~25°22′ 1 404~1 820 20 60 云南武定WD 102°08′~102°12′ 25°47′~25°51′ 1 405~1 802 60 29 云南师宗SZ 103°42′~104°34′ 24°21′~25°00′ 812~912 55 84 -
利用改良的CTAB法提取毛红椿叶片基因组DNA[13]。试验中PCR扩增反应采用15 μL体系,包括0.3 μL Taq酶(2 U·μL-1),dNTP(2.5 mmol·L-1),引物(10 mmol·L-1),1.5 μL 10×buffer和30 ng DNA模板。用基因扩增仪(TP600,日本TaKaRa公司)进行PCR扩增,PCR扩增程序是94℃预变性4 min,然后进行35个扩增循环(94℃变性1 min,T℃退火0.5 min,72℃延伸1 min),最后72℃延伸10 min。微卫星引物为本实验室筛选并设计的8对扩增谱带清晰、重复性好且稳定的引物[13]。PCR扩增产物加入5 μL的Loading buffer,聚丙烯酰胺凝胶(浓度为8%)进行电泳,电压120 V。电泳所采用的缓冲液为1×TBE,电泳3 h以后,银染检测并用数码相机照相。
-
微卫星是共显性标记,同一引物扩增产物中电泳迁移率一致的条带被认为具有同源性,用A、B、C、D、E……按条带大小从大到小进行编号。采用PowerMarker V3.25软件[22]计算各天然群体的等位基因数(Na)、基因型数(Ng)和多态性信息指数(PIC)等。采用POPGENE32软件计算毛红椿天然群体间基因分化系数(GST)、期望杂合度(He)以及聚类分析。利用PowerMarker V3.25软件Coreset功能模块,采用模拟退火算法和随机搜索2种取样方法,设置1、2、3、4、5、6、7、8、9、10、15、20、25、30、35、40、45、50、55、60等不同数量单株的取样样本,每个取样数量重复1 000次,构建群体内取样单株数量与基因多样性、等位基因捕获量间的关系图。空间自相关分析方法参考陈小勇等[20]和刘军等[11]的方法。利用STRUCTURE软件[21]对群体结构进行分析。
-
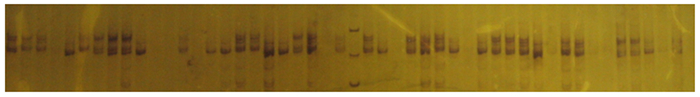
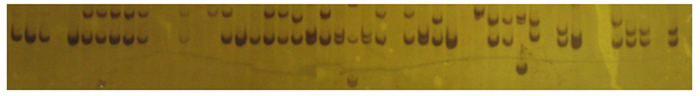
位点Tc06、Tc03全部样品的扩增产物银染结果见图 1、2。从表 2可以看出:在种水平上,8个位点的等位基因数为6~9个,其均值为7.5个,其中, 位点Tc05、Tc06和Tc07等位基因数最多,位点Tc01、Tc02和Tc03的等位基因数最少; 不同位点基因型数为9~22个,平均基因型数为14.4;毛红椿天然群体期望杂合度(He)的均值为0.643 7,变化范围为0.376 2~0.742 6;多态性信息指数(PIC)为0.351 3~0.766 6,其均值为0.636 0;毛红椿天然群体间基因分化系数(GST)为0.290 7,说明毛红椿天然群体29.07%的遗传变异存在于毛红椿天然群体间,70.93%的遗传变异存在于毛红椿天然群体内。

图 1 位点Tc06扩增产物银染结果
Figure 1. The result about silver dyeing of amplification with locus Tc06
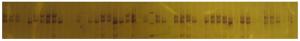
图 2 位点Tc03扩增产物银染结果
Figure 2. The result about silver dyeing of amplification with locus Tc03
表 2 毛红椿天然群体遗传多样性统计表
Table 2. Genetic diversity statistics for natural populations of T. ciliata var. pubescens
位点
Locus等位基
因数Na基因型数
Ng期望杂
合度He多态性信息
指数PIC基因分化
系数GSTTc01 6 9 0.704 4 0.661 0 0.406 6 Tc02 6 9 0.376 2 0.351 3 0.288 6 Tc03 6 15 0.611 3 0.566 8 0.188 3 Tc04 8 14 0.709 0 0.663 2 0.250 8 Tc05 9 15 0.703 1 0.706 4 0.560 1 Tc06 9 22 0.742 6 0.766 6 0.194 7 Tc07 9 18 0.710 1 0.730 4 0.067 8 Tc08 7 13 0.592 6 0.642 3 0.375 3 平均Mean 7.5 14.4 0.643 7 0.636 0 0.290 7 标准差SD 1.506 2.548 0.137 4 0.195 5 0.086 5 -
根据Hamrick等[22]提出的用基因分化系数(GST)来估算一个物种内应取样的群体数。如果取样的群体数为n,则所包含的遗传变异的比例为1-(GST)n。本研究中,群体间基因分化系数GST平均值为0.29~0 7(表 2),所以,3个群体基本上能包括该物种总体变异的97.5%。但经模拟取样证明,取样3个群体所包含的变异仅占该物种总体变异的86.8%~96.1%,未能达到97.5%;而取样4个群体时,所包含的变异占物种总变异的92.2%~98.3%(表 3)。因此,当取样群体数量为n时,取样群体所包含的遗传变异占总变异的比例为1-(GST)n-1。在毛红椿天然群体取样以及对其遗传多样性保护时,可以选择其中4个天然群体进行取样和遗传多样性保护。
表 3 不同群体取样方法捕获遗传多样性的比例
Table 3. Ratio of genetic diversity captured by different population sampling methods
群体取样方法
Sampling methods取样群体期望杂合度
Sampled He总的期望杂合度
Total He取样群体所包含该物种
遗传变异比例/%选取与其它群体间基因分化系数均值较大的4个群体
Four populations with higher GST0.633 0 0.643 7 98.3 选取与其它群体间基因分化系数均值较小的4个群体
Four populations with lower GST0.593 5 0.643 7 92.2 选取与其它群体间基因分化系数均值较大的3个群体
Three populations with higher GST0.618 0 0.643 7 96.1 选取与其它群体间基因分化系数均值较小的3个群体
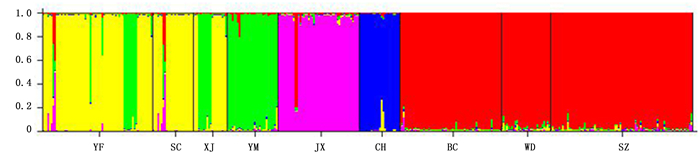
Three populations with lower GST0.558 7 0.643 7 86.8 从表 3可以看出:在群体取样的过程中,当选取与其它群体间遗传分化系数均值较大的4个群体时,取样群体所包含的遗传变异占总体变异的98.3%。通过计算群体间遗传分化系数,贵州册亨(CH)、浙江遂昌(SC)、安徽泾县(JX)和云南师宗(SZ)这4个群体分别与其它群体间遗传分化程度较大(表 4),其中, CH群体与其它群体间遗传分化系数均值达到0.377 8。浙江遂昌(SC)、安徽泾县(JX)和云南师宗(SZ)这3个群体与其它群体遗传分化系数均值分别为0.163、0.184和0.175(表 4)。选择这4个群体进行取样,取样群体所包含的遗传变异更丰富。基于邻接分析构建了毛红椿天然群体系统发育树,从图 3可以看出:所选择的4个群体均匀分布于系统发育树的四周,贵州册亨(CH)、浙江遂昌(SC)、安徽泾县(JX)和云南师宗(SZ)分别代表了毛红椿天然分布区的南部、东部、北部和西南部群体。同时利用STRUCTURE软件对其群体进行分析,结果得出最佳K值为5,聚类结果与基于邻接分析方法一致(图 4)。
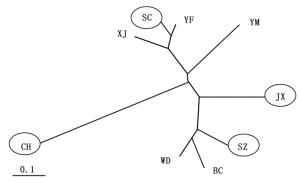
图 3 基于邻接分析的毛红椿天然群体聚类分析
Figure 3. Clustering analysis of natural populations based on neighbor-joining analysis
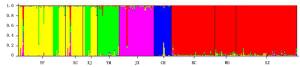
图 4 毛红椿天然群体STRUCTURE分析(K=5)
Figure 4. STRUCTURE analysis of T.ciliata var. pubescens natural populations(K=5)S
表 4 毛红椿天然群体间遗传分化系数
Table 4. Genetic differentiation coefficient between populations of T.ciliata var. pubescens
群体Population 江西宜丰YF 安徽泾县JX 云南元谋YM 云南宾川BC 云南武定WD 云南师宗SZ 浙江遂昌SC 浙江仙居XJ 安徽泾县JX 0.175 云南元谋YM 0.088 0.168 云南宾川BC 0.168 0.147 0.129 云南武定WD 0.159 0.119 0.126 0.053 云南师宗SZ 0.194 0.128 0.135 0.068 0.039 浙江遂昌SC 0.007 0.179 0.114 0.187 0.179 0.213 浙江仙居XJ 0.020 0.188 0.074 0.160 0.151 0.192 0.043 贵州册亨CH 0.360 0.371 0.340 0.394 0.401 0.431 0.379 0.346 -
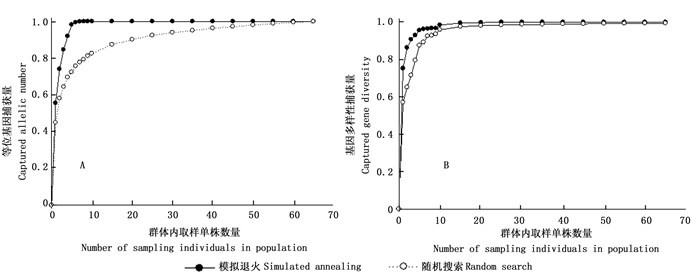
金燕等[1]研究发现,群体内单株数量的对数与取样样本等位基因数量成正比。因此,本文选择群体内单株数量较多的群体云南师宗(SZ)、云南宾川(BC)和江西宜丰(YF)作为研究对象,分析其群体内单株样本的取样策略。利用PowerMarker V3.25软件[23]进行群体遗传多样性分析(表 5)得出:云南师宗(SZ)、云南宾川(BC)和江西宜丰(YF)群体等位基因总数分别为34、29和27个,基因多样性分别为0.450、0.519和0.488。
表 5 云南师宗、江西宜丰和云南宾川群体遗传多样性分析
Table 5. Genetic diversity statistics of SZ, YF and BC populations
群体Population 等位基因数Na 基因多样性Gene diversity 云南师宗SZ 34 0.450 云南宾川BC 29 0.519 江西宜丰YF 27 0.488 图 5~7揭示了群体内取样单株数量与基因多样性捕获量、等位基因捕获量间的关系。可以看出,随着群体内取样个体数量的增加,捕获的基因多样性和等位基因数量也逐步增加。当云南师宗(SZ)、江西宜丰(YF)、云南宾川(BC)群体内取样个体数量分别达到15、7、15时,模拟退火取样方法所捕获的基因多样性占群体基因多样性的99.5%以上,同时几乎捕获了该群体的全部等位基因;而随机搜索取样方法所捕获基因多样性占江西宜丰(YF)、云南师宗(SZ)、云南宾川(BC)群体基因多样性的97.9%、97.6%和97.5%,捕获的等位基因占江西宜丰(YF)、云南师宗(SZ)、云南宾川(BC)群体全部等位基因的77.7%、73.6%和73.2%。综上分析,利用模拟退火取样方法,群体内取样单株数量达到15个时,基本捕获了该群体99.5%以上的基因多样性,同时捕获了群体全部等位基因。所以,在毛红椿核心种质构建中,建议群体内取样单株数量≥15个。
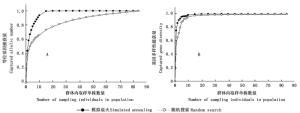
图 5 云南师宗群体内取样单株数量与等位基因捕获量、基因多样性捕获量的关系
Figure 5. Relationship between number of sampling individuals in SZ population and captured allelic number and gene diversity
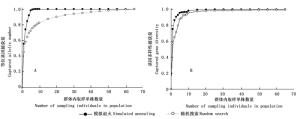
图 6 江西宜丰群体内取样单株数量与等位基因捕获量、基因多样性捕获量的关系
Figure 6. Relationship between number of sampling individuals in YF population and captured allelic number and gene diversity
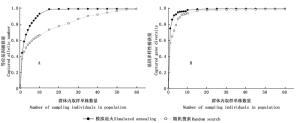
图 7 云南宾川群体内取样单株数量与等位基因捕获量、基因多样性捕获量的关系
Figure 7. Relationship between number of sampling individuals in BC population and captured allelic number and gene diversity
-
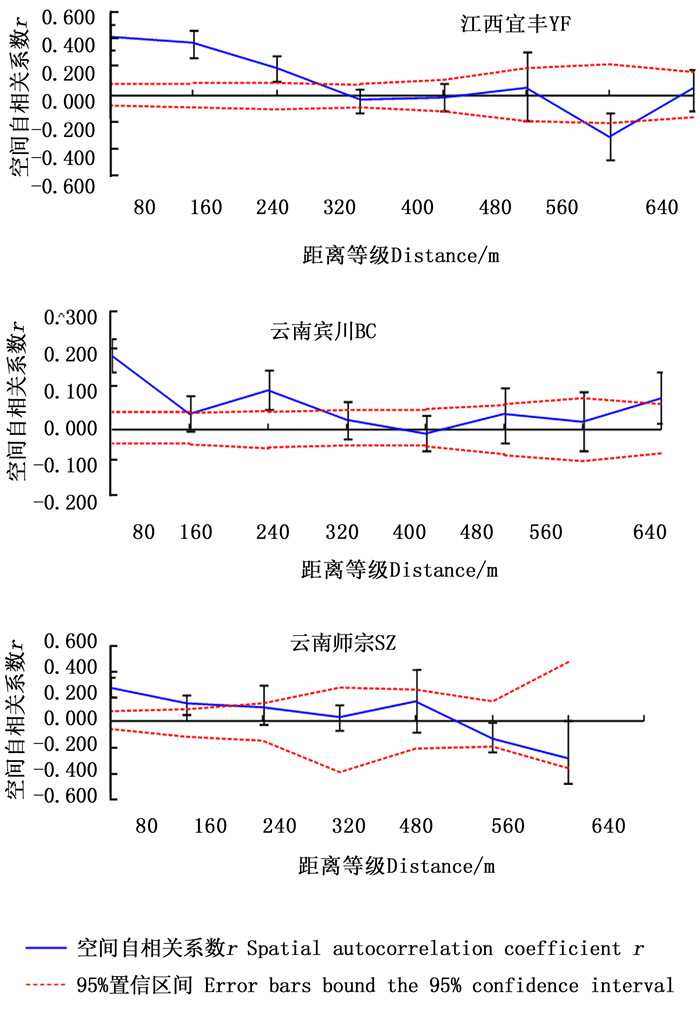
由于微环境的差异,以及植物的繁育系统、种子和花粉传播机制的影响,使植物群体内的遗传变异在空间上并不完全呈随机分布,而是呈斑块状分布。本研究通过计算江西宜丰(YF)、云南宾川(BC)和云南师宗(SZ)群体内单株之间的空间自相关系数,将单株之间距离分为8个距离等级,每个距离等级为80 m,空间自相关分析结果(图 8)表明:江西宜丰(YF)、云南宾川(BC)和云南师宗(SZ)群体内单株间距分别为300、380和520 m以内,空间自相关系数显著正相关,说明在3个群体此距离等级范围内的个体间存在相似关系,在此距离等级范围外,随着距离增大,正值减少而负值增加,说明3个群体内此距离等级以外,个体间差别较大。因此,在进行群体内单株取样时,为避免重复取样,单株间距应该在520 m范围以外。

图 8 群体空间自相关分析结果
Figure 8. The results of spatial autocorrelation analysis of three population
-
毛红椿天然群体遗传多样性水平与所报道的具有相同生物学和生态学习性物种遗传多样性水平相似[24],如大叶桃花心木(Swietenia macrophylla King)[25]和圭亚那苦油楝(Carapa guianensis Aubl.)[26]期望杂合度(He)分别为0.657和0.667。毛红椿天然群体的等位基因的平均数为7.5,群体间基因分化系数平均值为0.290 7,说明有29.07%的遗传变异存在群体之间,而有70.93%的遗传变异存在于群体之内。毛红椿群体基因分化系数明显高于相同生物学习性物种的基因分化系数的平均值(GST= 0.22)[24],说明毛红椿天然群体间遗传分化较大,可能是由于毛红椿天然群体片段化严重所致。
-
Schoen等[27]提出,在进行种质资源收集时,应先制定有效的取样策略,对于近交种或群体间基因分化系数较大的物种,首先应作遗传多样性分析,以确定哪些群体具有较高的遗传多样性。许多珍稀濒危树种天然群体数量有限,很多树种天然群体数量已减少至5个或者更少,对于这些树种的种质资源收集保护,宜对所有的天然群体进行取样[28]。Hamrick等[22]提出,在制定群体取样策略时,应充分考虑群体遗传多样性分布和群体间分化情况,阐明如何利用基因分化系数来设计取样策略。本文从包括群体取样数量、目标群体的选择、群体内取样单株数量以及取样单株间距离4个不同层次研究了毛红椿天然群体取样策略。在群体取样数量方面,本研究对Hamrick等[22]确定取样群体遗传多样性比例的一般公式进行了改进,如果群体取样数量为n,取样群体所包含的遗传多样性占该物种总变异的比例为1-(GST)n-1。因为树种间生物学特性和群体分布情况存在差异,导致不同树种群体间遗传分化程度也存在差异。毛红椿为长寿命多年生、虫媒花和种子靠风力传播植物,对于类似毛红椿生物学特性的树种而言,群体间基因交流较少,遗传分化较大[14],为捕获群体更多的遗传多样性,需要增加取样群体的数量。根据Hamrick等[22]的方法,只需要3个天然群体就能捕获总变异的97.5%,但实际上应用于本研究中,只能捕获总变异的86.8%~96.1%。当取样群体数量达到4个时,就能捕获总变异的92.2%~98.3%。所以,在毛红椿天然群体取样以及遗传多样性保护时,应该选取至少4个群体进行取样和遗传多样性保护。
在确定了群体取样数量后,以往对天然群体取样策略的研究很少涉及关于目标群体的选择,即选择哪4个群体进行取样。虽然根据Schoen等[27]的方法,可以选择4个遗传多样性水平较高的群体进行取样,但由于毛红椿天然群体间遗传分化较大,群体间基因交流较少,可能部分群体长时间与其它群体地理隔离,致使其部分群体特别是边缘群体含有较多的稀有等位基因[14]。为了捕获一定水平的等位基因和遗传多样性,需充分考虑由于地理隔离导致的群体间遗传分化。本文对比了不同取样方法对取样群体遗传多样性捕获量的影响,提出了选择与其它群体间遗传分化系数平均值较大的4个群体进行取样,基本可以捕获毛红椿总变异的98.3%。
在群体内取样单株数量方面,Sjögren等[29]提出了一个针对有限群体的假设模型,认为要检测到频率为5%的稀有等位基因,群体内取样数至少要达到30个单株。本文利用2种分析方法,构建了群体取样数量与等位基因捕获量、基因多样性捕获量关系图。根据分析结果得出,运用模拟退火温度的方法,群体内取样单株数量达到15个时,基本捕获了该群体基因多样性的99.5%,同时捕获了群体全部等位基因。所以,在毛红椿核心种质构建中,建议群体内取样单株数量≥15个。
由于受群体内地形影响以及繁殖系统、种子和花粉传播方式等影响,群体内遗传变异非随机分布,导致群体内存在空间遗传结构[30]。欧洲山毛榉(Fagus sylvatica L.)研究结果揭示了地理距离隔离导致其群体内空间遗传结构的产生[31]。Berens等[32]对非洲李(Prunus africana L.)研究表明,限制的种子传播和微生境是形成其群体空间遗传结构的主要原因,利用微卫星分子标记发现,非洲李基因流传播距离为236~558 m。空间自相关分析可以用于群体内单株间遗传相似性与地理距离之间相关性检验[9]。本文利用空间自相关分析对江西宜丰、云南师宗和云南宾川取样群体空间遗传结构情况进行分析表明,3个群体分别在300、380、520 m范围内单株间存在相似关系,此距离范围以外个体间差异较大。该研究结果与非洲李[32]和纺锤树(Cavanillesia arborea K. Schum.)[33]等结果类似,但与草本植物大豆(Glycine max (L.) Merr.)[4]和青冈(Quercus glauca Thunb.)[20]等差异较大,其原因为不同物种生物学特性差异较大。毛红椿雌雄同株,花较小,花粉主要靠昆虫传播,果实为蒴果,成熟后自然开裂;种子两侧具翅,翅为膜质,质量较轻,主要依靠风力传播,传播距离较远。而大豆和青冈果实较重,成熟后靠重力和动物传播,传播距离相对较近。因此,在进行群体内单株取样时,单株间距应大于520 m,有利于在同样多的样本下获取更多毛红椿种质资源遗传多样性。
-
为最大限度地收集和保存毛红椿天然群体遗传变异,利用8对微卫星分子标记进行毛红椿天然群体遗传多样性和空间自相关分析,综合制定了其天然群体合理取样策略。首先根据毛红椿群体基因分化系数(GST)来确定取样群体遗传变异所占总变异比例的运算公式为1-(GST)n-1,其中,n为取样群体的数量。毛红椿天然群体间遗传分化系数为0.290 7,当取样群体达到4个时,基本上能包括该树种97.5%的遗传变异。其次在目标群体选择方面,通过不同方法对比,确定了应选择与其它群体间基因分化系数平均值较大的4个群体。第三通过构建群体内取样单株数量与基因多样性和等位基因之间的捕获曲线,确定了群体内取样单株数量应达到15个以上,基本可以捕获群体99.5%以上的基因多样性,同时捕获了群体全部等位基因。最后根据毛红椿天然群体空间遗传结构,揭示了毛红椿天然群体内300~520 m范围内的单株间存在相似关系,超出此范围个体间差别较大,说明在进行群体内单株取样时,单株间距应大于520 m。
毛红椿天然群体遗传多样性及取样策略探讨
Discussion on Genetic Diversity and Sampling Strategy of Natural Toona ciliata var. pubescens Populations
-
摘要:
目的 研究毛红椿天然群体遗传多样性取样策略,为其种质资源收集、保存和遗传多样性保护等提供参考依据。 方法 利用8对微卫星分子标记进行毛红椿天然群体遗传多样性和空间自相关分析,综合制定其天然群体合理取样策略。 结果 毛红椿天然群体等位基因数平均为7.5个,期望杂合度(He)和多态性信息指数(PIC)均值分别为0.6437和0.6360,基因分化系数(GST)均值为0.2907。在遗传多样性取样策略方面,提出了根据毛红椿群体基因分化系数来确定取样群体遗传变异所占总变异比例的运算公式为1-(GST)n-1,其中,n为取样群体的数量。当取样群体达到4个时,基本上能包括该树种97. 5%的遗传变异;同时确定了目标群体的选择方法,应选择与其它群体间基因分化系数均值较大的4个群体,即贵州册亨(CH)、浙江遂昌(SC)、浙江仙居(XJ)和云南师宗(SZ)。通过构建云南宾川(BC)、云南师宗(SZ)和江西宜丰(YF)群体内取样单株数量与基因多样性和等位基因之间的捕获曲线,确定了群体内取样单株数量应达到15个以上;毛红椿天然群体内300~520 m范围内的单株间存在相似关系,超出此范围个体间差别较大,说明在进行群体内单株取样时,单株间距应大于520 m。 结论 取样群体数量、群体间遗传分化系数、群体内单株数量以及单株间距离等影响了毛红椿取样群体的遗传多样性。毛红椿天然群体遗传多样性取样策略为取样群体4个、每个群体最少取样15个单株,单株间距大于520 m Abstract:Objective To study the genetic diversity and sampling strategy of natural Toona ciliata var. pubescens populations and provide references for protecting their genetic diversity as well as collecting and preserving germplasm resources. Method Nine natural populations of T. ciliata var. pubescens were collected in its distribution zone. The population genetic diversity, spatial autocorrelation analysis were conducted with 8 microsatellite markers. Simulated sampling methods were used to develop sampling strategy of natural T. ciliata var. pubescens populations. Result The results showed that the average number of alleles were 7.5. The mean expected heterozygosity and polymorphism information index (PIC) was 0.6437 and 0.6360, respectively. The average coefficient of genetic differentiation (GST) among populations was 0.2907. For genetic diversity sampling strategy of T. ciliata var. pubescens, a formula for determining the proportion of genetic diversity was found using GST and number of populations:1-(GST)n-1, where n means the number of populations. Therefore, when four natural populations, which from Ceheng of Guizhou Province, Suichang of Zhejiang Province, Xianju of Zhejiang Province, and Shizong of Yunnan Province, were selected for conservation and sampling, 97.5% of genetic variation was captured. The population with higher average coefficient of GST among other populations was chosen. The mean allele number and genetic diversity increased with the increase of sampling individual in Shizong population from Yunnan Province, Binchuan population from Yunnan Province, and Yifeng population from Jiangxi Province by using captured curve. When sampling individual in a population reached 15, total alleles and 99.5% genetic diversity were captured. So more than 15 individuals should be sampled when germplasm of T. ciliata var. pubescens were conserved and sampled. Similarity relation existed among individuals within a distance of 300-520 m. There were great differences among individuals over this distance range. The distance among individuals was beyond 520 m when sampling in natural populations. The number of sampling populations, coefficient of genetic differentiation among populations, sampling individual number in population, and the distance among individuals could affect the genetic diversity of sampling populations. Conclusion The number of sampling populations, coefficient of genetic differentiation among populations, sampling individual number in population and the distance among individuals could affect the genetic diversity of sampling populations. It is suggested that the sampling strategy for of natural Toona ciliata var. pubescens populations is 4 sampling populations, at least 15 individuals in each population and more than 520 m intervals among individuals in a population. -
图 1 位点Tc06扩增产物银染结果
Figure 1. The result about silver dyeing of amplification with locus Tc06
图 2 位点Tc03扩增产物银染结果
Figure 2. The result about silver dyeing of amplification with locus Tc03
图 3 基于邻接分析的毛红椿天然群体聚类分析
Figure 3. Clustering analysis of natural populations based on neighbor-joining analysis
图 4 毛红椿天然群体STRUCTURE分析(K=5)
Figure 4. STRUCTURE analysis of T.ciliata var. pubescens natural populations(K=5)S
图 5 云南师宗群体内取样单株数量与等位基因捕获量、基因多样性捕获量的关系
Figure 5. Relationship between number of sampling individuals in SZ population and captured allelic number and gene diversity
图 6 江西宜丰群体内取样单株数量与等位基因捕获量、基因多样性捕获量的关系
Figure 6. Relationship between number of sampling individuals in YF population and captured allelic number and gene diversity
图 7 云南宾川群体内取样单株数量与等位基因捕获量、基因多样性捕获量的关系
Figure 7. Relationship between number of sampling individuals in BC population and captured allelic number and gene diversity
图 8 群体空间自相关分析结果
Figure 8. The results of spatial autocorrelation analysis of three population
表 1 毛红椿9个天然群体地理位置和采样数量
Table 1. Geographic places and individual numbers of nine natural populations of T. ciliata var. pubescens
群体Population 东经E 北纬N 海拔高度Altitude/m 面积Area/ hm2 采样数量Number 江西宜丰YF 114°29′~114°45′ 28°30′~28°40′ 220~475 68 65 浙江遂昌SC 119°12′~119°23′ 28°30′~28°36′ 5101 220 30 25 浙江仙居XJ 120°32′~120°56′ 28°48′~28°56′ 600820 32 27 云南元谋YM 101°49′~101°52′ 25°17′~25°40′ 1 112~1 230 18 30 安徽泾县JX 118°35′~118°36′ 30°31′~30°34′ 270~497 28 48 贵州册亨CH 105°40′~105°52′ 24°36′~24°55′ 620810 25 24 云南宾川BC 100°16′~101°23′ 25°02′~25°22′ 1 404~1 820 20 60 云南武定WD 102°08′~102°12′ 25°47′~25°51′ 1 405~1 802 60 29 云南师宗SZ 103°42′~104°34′ 24°21′~25°00′ 812~912 55 84  下载: 导出CSV
表 2 毛红椿天然群体遗传多样性统计表
Table 2. Genetic diversity statistics for natural populations of T. ciliata var. pubescens
位点
Locus等位基
因数Na基因型数
Ng期望杂
合度He多态性信息
指数PIC基因分化
系数GSTTc01 6 9 0.704 4 0.661 0 0.406 6 Tc02 6 9 0.376 2 0.351 3 0.288 6 Tc03 6 15 0.611 3 0.566 8 0.188 3 Tc04 8 14 0.709 0 0.663 2 0.250 8 Tc05 9 15 0.703 1 0.706 4 0.560 1 Tc06 9 22 0.742 6 0.766 6 0.194 7 Tc07 9 18 0.710 1 0.730 4 0.067 8 Tc08 7 13 0.592 6 0.642 3 0.375 3 平均Mean 7.5 14.4 0.643 7 0.636 0 0.290 7 标准差SD 1.506 2.548 0.137 4 0.195 5 0.086 5
下载: 导出CSV
表 3 不同群体取样方法捕获遗传多样性的比例
Table 3. Ratio of genetic diversity captured by different population sampling methods
群体取样方法
Sampling methods取样群体期望杂合度
Sampled He总的期望杂合度
Total He取样群体所包含该物种
遗传变异比例/%选取与其它群体间基因分化系数均值较大的4个群体
Four populations with higher GST0.633 0 0.643 7 98.3 选取与其它群体间基因分化系数均值较小的4个群体
Four populations with lower GST0.593 5 0.643 7 92.2 选取与其它群体间基因分化系数均值较大的3个群体
Three populations with higher GST0.618 0 0.643 7 96.1 选取与其它群体间基因分化系数均值较小的3个群体
Three populations with lower GST0.558 7 0.643 7 86.8
下载: 导出CSV
表 4 毛红椿天然群体间遗传分化系数
Table 4. Genetic differentiation coefficient between populations of T.ciliata var. pubescens
群体Population 江西宜丰YF 安徽泾县JX 云南元谋YM 云南宾川BC 云南武定WD 云南师宗SZ 浙江遂昌SC 浙江仙居XJ 安徽泾县JX 0.175 云南元谋YM 0.088 0.168 云南宾川BC 0.168 0.147 0.129 云南武定WD 0.159 0.119 0.126 0.053 云南师宗SZ 0.194 0.128 0.135 0.068 0.039 浙江遂昌SC 0.007 0.179 0.114 0.187 0.179 0.213 浙江仙居XJ 0.020 0.188 0.074 0.160 0.151 0.192 0.043 贵州册亨CH 0.360 0.371 0.340 0.394 0.401 0.431 0.379 0.346
下载: 导出CSV
表 5 云南师宗、江西宜丰和云南宾川群体遗传多样性分析
Table 5. Genetic diversity statistics of SZ, YF and BC populations
群体Population 等位基因数Na 基因多样性Gene diversity 云南师宗SZ 34 0.450 云南宾川BC 29 0.519 江西宜丰YF 27 0.488
下载: 导出CSV
-
[1] 金燕, 卢宝荣.遗传多样性的取样策略[J].生物多样性, 2003, 11(2):155-161. doi: 10.3321/j.issn:1005-0094.2003.02.009 [2] Gilbert J E, Lewis R V, Wilkinson M J, et al. Developing an appropriate strategy to assess genetic variability in plant germplasm collections[J]. Theoretical and applied genetics, 1999, 98(6-7): 1125-1131. doi: 10.1007/s001220051176 [3] 李自超, 曾亚文.云南地方稻种资源核心种质取样方案研究[J].中国农业科学, 2000, 33(5): 1-7. doi: 10.3321/j.issn:0578-1752.2000.05.001 [4] 朱维岳, 周桃英, 钟明, 等.基于遗传多样性和空间遗传结构的野生大豆居群采样策略[J].复旦学报:自然科学版, 2006, 45(3): 321-327. [5] Jennifer F C, Affoher M J, Hamrick J L. Developing a sampling strategy for Baptisia aracbnra based on allozyme diversity[J]. Conservation Biology, 1997, 11(5): 1133-1139. doi: 10.1046/j.1523-1739.1997.95527.x [6] Malosetti M, Abadie T. Sampling strategy to develop a core collection of Uruguayan maize landraces based on morphological traits[J]. Genetic Resources and Crop Evolution, 2001, 48(4): 381-390. doi: 10.1023/A:1012003611371 [7] 黎裕, 王天宇, 田松杰, 等.利用分子标记分析遗传多样性时的玉米群体取样策略研究[J].植物遗传资源学报, 2003, 4(4):314-317. doi: 10.3969/j.issn.1672-1810.2003.04.007 [8] Mashall D R, Brown A D H. Crop genetic recourses for today and tomorrow[M]. Cambridge: Cambridge University Press, 1975. [9] 何田华, 杨继, 饶广远.植物居群遗传变异的空间自相关[J].植物学通报, 1999, 16(6):636-641. doi: 10.3969/j.issn.1674-3466.1999.06.003 [10] Sokal R R, Oden N L. Spatial autocorrelation in biology: 1. Methodology[J]. Biological Journal of the Linnean Society, 1978, 10(2):199-228. doi: 10.1111/bij.1978.10.issue-2 [11] 刘军, 陈益泰, 孙宗修, 等.基于空间自相关分析研究毛红椿天然居群的空间遗传结构[J].林业科学, 2008, 44(6): 45-52. doi: 10.3321/j.issn:1001-7488.2008.06.009 [12] 张露, 郭联华, 杜天真, 等.遮荫和土壤水分对毛红椿幼苗光合特性的影响[J].南京林业大学学报:自然科学版, 2006, 30(5): 63-66. [13] 刘军, 孙宗修, 陈益泰, 等.珍稀濒危树种毛红椿微卫星DNA分离及SSR反应体系优化[J].中国生物工程杂志, 2006, 26(12):50-55. [14] 刘军, 姜景民, 邹军, 等.中国特有濒危树种毛红椿核心和边缘居群的遗传多样性[J].植物生态学报, 2013, 37 (1):52-60. [15] 楼炉焕, 金水虎.浙江古田山自然保护区珍稀濒危植物区系的研究[J].北京林业大学学报, 2000, 22(5):33-39. doi: 10.3321/j.issn:1000-1522.2000.05.007 [16] 张光富.安徽珍稀濒危植物及其保护[J].安徽师范大学学报, 2000, 23(1):36-39. doi: 10.3969/j.issn.1001-2443.2000.01.012 [17] 刘信中, 吴和平.江西官山自然保护区科学考察与研究[M].北京:中国林业出版社, 2005:118-120. [18] 刘军, 陈益泰, 姜景民, 等.毛红椿群体遗传结构的SSR分析[J].林业科学研究, 2009, 22(1): 37-41. doi: 10.3321/j.issn:1001-1498.2009.01.007 [19] 刘军, 陈益泰, 姜景民, 等.毛红椿天然林群落结构特征研究[J].林业科学研究, 2010, 23(1): 93-97. [20] 陈小勇.安徽黄山青冈种群遗传结构的空间自相关分析[J].植物生态学报, 2001, 25 (1): 29-34. doi: 10.3321/j.issn:1005-264X.2001.01.007 [21] Evanno G, Regnaut S, Goudet J. Detecting the number of clusters of individuals using the software STRUCTURE: a simulation study[J]. Molecular Ecology, 2005, 14(8):2611-2620. doi: 10.1111/mec.2005.14.issue-8 [22] Hamrick J L, Godt M J W, Murawski D A, et al. Correlation between species traits and allozyme diversity: implication for conservation biology[M]// Falk D A, Holsinger K E. Genetics and conservation of rare plants. New York: Oxford University Presss, 1991. [23] Liu K, Muse S V. PowerMarker: an integrated analysis environment for genetic marker analysis[J]. Bioinformatics, 2005, 21(9): 2128-2129. doi: 10.1093/bioinformatics/bti282 [24] Nybom H. Comparison of different nuclear DNA markers for estimating intraspecific genetic diversity in plants[J]. Molecular Ecology, 2004, 13(5):1143-1155. doi: 10.1111/mec.2004.13.issue-5 [25] Novick R R, Dick C W, Lemes M R, et al. Genetic structure of Mesoamerican populations of big-leaf mahogany (Swietenia macrophylla) inferred from microsatellite analysis[J]. Molecular Ecology, 2003, 12(11): 2885-2893. doi: 10.1046/j.1365-294X.2003.01951.x [26] Dayanandan S, Dole J, Bawa K, et al. Population structure delineated with microsatellite markers in fragmented populations of a tropical tree, Carapa guianensis (Meliaceae)[J]. Molecular Ecology, 1999. 8(10):1585-1592. [27] Schoen D J, Brown A H. Intraspecific variation in population gene diversity and effective population size correlates with the mating system in plants[J]. Proceedings of the National Academy of Sciences, USA, 1991, 88(10): 4494-4497. doi: 10.1073/pnas.88.10.4494 [28] Ceska J F, Affolter J M, Hamrik J L. Developing a sampling strategy for Baptisia arachnifera based on allozyme diversity[J]. Conservation Biology, 1997, 11(5): 1133-1139. doi: 10.1046/j.1523-1739.1997.95527.x [29] Sjögren P, Wyöni P I. Conservation genetics and detection of rare alleles in finite populations[J]. Conservation Biology, 1994, 8(1): 267-270. doi: 10.1046/j.1523-1739.1994.08010267.x [30] Jin Y, He T H, Lu B R. Fine scale genetic structure in a wild soybean (Glycine soja) population and the implications for conservation[J]. New Phytologist, 2003, 159(2): 513-519. doi: 10.1046/j.1469-8137.2003.00824.x [31] Lafontaine G D, Ducousso A, Lefèvre S, et al. Stronger spatial genetic structure in recolonized areas than in refugia in the European beech[J]. Molecular Ecology, 2013, 22(17): 4397-4412. doi: 10.1111/mec.12403 [32] Berens D G, Braun C, Griebeler E M, et al. Fine-scale spatial genetic dynamics over the life cycle of the tropical tree Prunus africana[J]. Heredity, 2014, 113(5): 401-407. doi: 10.1038/hdy.2014.40 [33] Júnior A F M, Carvalho D, Brandão M M, et al. Spatial genetic structure of Cavanillesia arborea K. Schum.(Malvaceae) in seasonally dry tropical forest: Implications for conservation[J]. Biochemical Systematics and Ecology, 2015, 58:114-119. doi: 10.1016/j.bse.2014.11.004 -

 点击查看大图
计量
- 文章访问数: 4116
- HTML全文浏览量: 1870
- PDF下载量: 156
- 被引次数: 0
