

-
实时荧光定量PCR(Quantitative Real-time PCR)是一种高精度、高通量地检测目的基因表达水平的稳定方法,在现代分子生物学研究中的应用十分广泛。但是,实时荧光定量PCR实验很容易受RNA质量、上样量、逆转录效率等的试验误差干扰,这就需要内参基因(Internal reference gene)作为参照物来校正样品间的试验误差[1-4]。内参基因的表达量越稳定,越能更好地检测目的基因的特异性表达水平[5-8]。针对不同的植物种类和组织部位,前人对内参基因的选择进行了较多研究[9-13]。大量研究表明,内参基因的表达稳定性是相对的,在植物的不同品种、组织部位和试验条件下表达的稳定性差异较大[14-16]。因此,筛选和评估内参基因表达的稳定性,建立多内参基因的评价体系,是提高实时荧光定量PCR试验准确性的重要保证。
杉木(Cunninghamia lanceolata(Lamb.)Hook.)是我国重要的针叶速生用材树种之一,具有速生、丰产、材质优良等特点,在我国南方地区有广泛的栽培和利用。随着分子生物学的发展,目前针对杉木的转录组测序、基因克隆和microRNA功能研究越来越多,这些研究涉及到使用荧光定量PCR技术检测目的基因的表达情况[17-18]。在荧光定量PCR实验中,前人在对杉木内参基因的选择上各不相同,EF1α、Actin、28S rRNA等被选用,但是对杉木在不同组织中内参基因的筛选和表达稳定性研究极少[19-20]。筛选和评估内参基因表达的稳定性,是保证杉木荧光定量PCR准确性的重要前提。本文通过对比分析杉木中甘油醛三磷酸脱氢酶基因(GAPDH)、转录延伸因子(EF1α)、18S核糖体RNA基因(18S rRNA)、28 S核糖体RNA基因(28S rRNA)、泛素基因(UBQ)、泛素结合酶基因(UBC)以及肌动蛋白基因(Actin)这7个传统的内参基因的稳定性,挑选出可作为杉木在不同组织中基因表达分析所用的内参基因,并通过杉木纤维素合酶基因ClCesA1和ClCesA2的表达分析验证内参基因的表达稳定性,筛选出适合杉木的多内参基因的评价体系,为提高杉木实时荧光定量PCR试验准确性提供基础背景校正的参照值。
-
试验材料采自国家林业和草原局杉木工程技术研究中心。选取1年生沙培30 d的杉木无性系幼苗的根、茎和叶为试验材料,采集幼嫩的根、茎和叶组织样品,用液氮冷冻后放-80℃冰箱保存。
-
选取目前常用的内参基因为本试验的候选内参基因,分别是甘油醛三磷酸脱氢酶GAPDH、转录延伸因子EF1α、18S rRNA、28S rRNA、泛素UBQ、泛素结合酶UBC以及肌动蛋白Actin。在现有杉木转录组数据中筛选获得杉木候选内参基因的核心序列,杉木纤维素合酶基因ClCesA1序列来自文献[21],ClCesA2基因由课题组自行克隆获得核心序列。根据各基因核心序列,使用MEGA6.0设计各个基因荧光定量PCR引物,引物序列由生工生物工程(上海)股份有限公司合成(表 1)。
表 1 候选内参基因与ClCesA1、ClCesA2的引物序列
Table 1. Primer sequences of the candidate reference genes and ClCesA1, ClCesA2
基因名称
gene name引物序列Primer sequence(5' to 3') 退火温度
TM/℃GC含量
GC content/%GAPDH F:GCACCTATGTTTGTGGTTGGAGTA 57.9 45.8 R:ACCGTCTTCTGTGTAGCTGTTGTT 57.9 45.8 UBQ F:AATAAATGCTTCAAATGTCAGGCTA 53.0 32.0 R:TGAGATGGTCTGGTGATGTCGTGG 61.3 54.2 18S rRNA F:GGGAACATTATCACGGACAGCATCAAC 61.1 48.1 R:TGCGACTAATGGTCCAGATAGACTCCT 61.1 48.1 28S rRNA F:AGTTTGTAGAAGCGTCCTCAG 55.6 47.6 R:GGCGCCCCCTTCCA 50.0 78.6 EF1α F:TGGCAAGGAGCTTGAGAAAGAACCCA 61.2 50.0 R:ACCCCAACAGCAACAGTCTGACGCAT 62.7 53.8 UBC F:CTCCTGATGATAGAGGTCTAACG 60.2 47.8 R:ATGACATGGAGGTCGGTACATAG 60.2 47.8 Actin1 F:CTCTCTCAGCACCTTCGAGCAG 63.8 59.1 R:TCCACATACAACCGCTCCACTG 61.9 54.5 ClCesA1 F:CCATCCACAGCTAAATTATCTGC 58.4 43.5 R:CATCATAGCTCTCAATTTCATGTAGA 57.3 34.6 ClCesA2 F:GTCGCAGGATCTCATAACAGG 60.0 52.4 R:CACATTCATTGCAGGCTACA 55.8 45.0 -
采用TIANGEN公司的RNAprep Pure Plant Kit试剂盒提取根、茎、叶样品的总RNA,利用1.0%的琼脂糖凝胶电泳和Eppendorf超微量分光光度计测定总RNA的质量与浓度。采用Promega公司的GoScriptTM Reverse Transcription System试剂盒进行反转录试验,合成杉木RNA样品的cDNA第1条链,统一稀释至30 ng·μL-1后用于荧光定量PCR试验。实时荧光定量PCR反应在Thermo Fisher公司StepOnePlusTM实时荧光定量PCR仪上进行,使用Promega公司的GoTag qPCR Master Mix试剂盒进行PCR反应。反应体系为20 μL,包括:2× qPCR Master Mix 10 μL (10 μmol·L-1)上、下游引物各0.4 μL,cDNA 2 μL,ROX参比染料(含SYBR)0.2 μL,ddH2O 7 μL。PCR反应程序为:95℃预变性3 min;95℃变性20 s,60℃退火30 s,72℃延伸30 s,共40个循环;95℃ 30 s,60℃ 30 s,逐渐升温到95℃,速度0.11℃·s-1,设置3次生物学重复。
-
选用内参基因稳定性评价软件geNorm (https://genorm.cmgg.be/)和软件Normfinder(https://moma.dk/normfinder-software),根据公式Q=E(Minimum Ct-SampleCt)(式中:Minimum Gt为Ct最小值,Samplect为各个样本Ct值)计算相对表达量,在软件中导入相对表达量Q值,对候选内参基因进行稳定性评价,实际操作中引物扩增率接近100%,E默认为2。使用BestKeeper软件(http://www.gene-quantification.de/bestkeeper.html#descr),根据7个候选内参基因的Ct值对候选内参基因的稳定性进行统计分析,分析选择杉木不同组织中合适的内参基因。采用Q=2-(SampleCt-referenceCt)(式中:referenceCt为内参考基因Ct值)计算杉木纤维素合酶基因的相对表达量,并利用SPSS 16.0进行数据统计和处理。
-
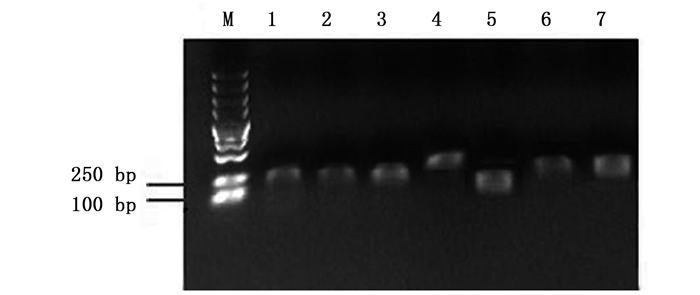
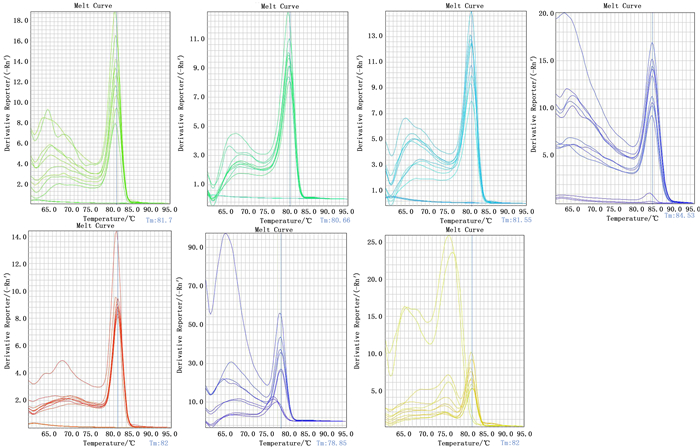
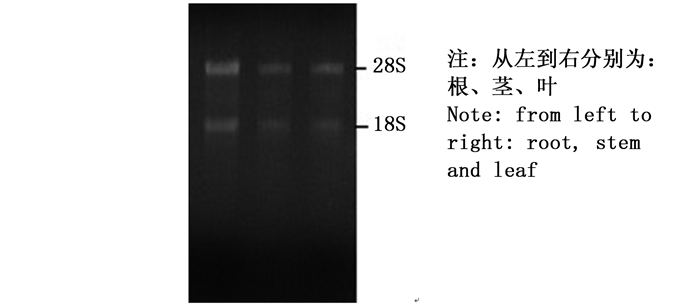
杉木各样品1%琼脂糖凝胶电泳显示:总RNA条带清晰,无明显降解,28S rRNA条带比18S rRNA条带亮度高,总RNA完整性良好(图 1)。以cDNA为模板进行PCR扩增,PCR产物经1%琼脂糖凝胶电泳检测表明:7个候选内参基因条带单一,无非特异性扩增,目的片段大小符合预期,说明扩增产物为杉木内参基因的目的片段(图 2)。分析荧光定量PCR的溶解曲线,7个候选内参基因均有明显的单一溶解峰(图 3),重复样品间扩增曲线重复性高,且阴性对照则无信号显示,7个候选内参基因引物均具有较好的特异性。
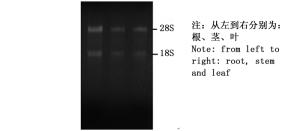
图 1 总RNA琼脂糖凝胶电泳
Figure 1. Total RNA agarose gel electrophoresis

图 2 杉木根中7个内参基因PCR产物琼脂糖凝胶电泳图
Figure 2. Agarose gel electrophoresis of the PCR products of the seven reference genes in Chinese fir root

图 3 候选内参基因溶解曲线
Figure 3. Melting curves of the candidate reference genes
-
荧光定量PCR获得的各内参基因Ct值与其表达丰度成反比,Ct值越大,基因表达量越低。结果表明:所选择的7个候选内参基因中,28S rRNA的平均Ct值最低(6.55),其余6个候选内参基因的Ct值为19.70~27.84,平均Ct值均高于20(表 2)。28S rRNA在杉木各组织中表达量明显高于其他6个内参基因,不适合作为内参基因来检测高丰度基因的表达情况。
表 2 候选内参基因与ClCesA1、ClCesA2的平均Ct值
Table 2. The average Ct values of the candidate reference genes and ClCesA1, ClCesA2
组织Tissues 平均Gt值 GAPDH UBQ 18S rRNA 28S rRNA EF1α UBC Actin ClCesA1 ClCesA2 根Root 24.79 23.51 27.84 7.68 23.91 22.76 24.90 27.80 26.99 茎Stem 21.39 22.37 26.48 5.51 19.70 21.54 25.53 24.71 22.95 叶Leaf 24.78 22.10 25.78 6.45 20.73 21.94 26.80 28.74 27.50 -
分别采用geNorm与Normfinder软件对各内参基因的表达稳定性进行统计学分析。geNorm软件是通过计算候选内参基因的平均稳定指数M值来对比候选内参基因的稳定性,M=1.5为稳定性分界线,当M值低于1.5时,可判定该候选内参基因较稳定,且M值越低,该内参基因的稳定性越高。geNorm软件分析表明:在杉木不同的组织中,7个候选内参基因的M值均低于临界值1.5,说明候选内参基因的表达均较稳定。表 3表明:在根与茎中,UBQ的M值最大,分别为0.185和0.731,且根中Actin的M值最低,EF1α次之,茎中EF1α的M值最低,Actin居次;叶中28S rRNA的M值最大,为0.252,而UBQ的M值最小,为0.164。7个候选内参基因的稳定性排序依次为EF1α>Actin>GAPDH>18S rRNA>UBC>UBQ>28S rRNA。
表 3 geNorm软件候选内参基因稳定性评价
Table 3. The evaluation of candidate reference genes stability from geNorm and Normfinder
稳定性排序
Stabilit-y bank根Root 茎Stem 叶Leaf 最终排序
Final bank基因名称
Gene name稳定性M值
Stability value基因名称
Gene name稳定性M值
Stability value基因名称
Gene name稳定性M值
Stability value1 Actin 0.11 EF1α 0.336 UBQ 0.164 EF1α 2 EF1α 0.114 Actin 0.339 EF1α 0.184 Actin 3 GAPDH 0.116 18S rRNA 0.350 GAPDH 0.196 GAPDH 4 18S rRNA 0.124 UBC 0.438 Actin 0.202 18S rRNA 5 28S rRNA 0.164 GAPDH 0.464 UBC 0.208 UBC 6 UBC 0.178 28S rRNA 0.697 18S rRNA 0.221 UBQ 7 UBQ 0.185 UBQ 0.731 28S rRNA 0.252 28S rRNA Normfinder软件是通过计算稳定性指数M值,对候选内参基因进行稳定性比较。M值越小,说明内参基因的表达稳定性越高,反之则越低。Normfinder软件分析表明:7个候选内参基因的稳定性排序在不同的杉木组织中均有所不同,根茎叶中最稳定的内参基因分别为GAPDH、EF1α与UBQ;根与茎中最不稳定的内参基因是UBQ,叶中最不稳定的内参基因是28S rRNA。Normfinder软件结果中7个候选内参基因的稳定性排序依次为EF1α>GAPDH>Actin>18S rRNA>UBC>UBQ>28S rRNA(表 4)。
表 4 Normfinder软件候选内参基因稳定性评价
Table 4. The evaluation of candidate reference genes stability from geNorm and Normfinder
稳定性排序
Stabilit-y bank根Root 茎Stem 叶Leaf 最终排序
Final bank基因名称
Gene name稳定性M值
Stability value基因名称
Gene name稳定性M值
Stability value基因名称
Gene name稳定性M值
Stability value1 GAPDH 0.033 EF1α 0.017 UBQ 0.042 EF1α 2 18S rRNA 0.034 Actin 0.017 EF1α 0.087 GAPDH 3 Actin 0.036 18S rRNA 0.057 GAPDH 0.096 Actin 4 EF1α 0.046 UBC 0.174 Actin 0.099 18S rRNA 5 28S rRNA 0.094 GAPDH 0.220 UBC 0.120 UBC 6 UBC 0.112 28S rRNA 0.464 18S rRNA 0.130 UBQ 7 UBQ 0.115 UBQ 0.484 28S rRNA 0.162 28S rRNA -
BestKeeper软件是通过对比各个候选内参基因Ct值的标准差(SD)、变异系数(CV)对候选内参基因的稳定性进行综合分析,稳定性较好的基因一般具有较低的SD值与CV值。结果(表 5)表明:在杉木根与叶中,EF1α的SD值和CV值是7个候选内参基因中最低的;茎中18S rRNA的SD值和CV值在7个候选内参基因中均为最低,相对比其他6个内参基因更稳定;根茎叶中最不稳定的候选内参基因均是28S rRNA。候选内参基因的表达稳定性由高到低排序为EF1α> Actin >GAPDH >18S rRNA >UBC >UBQ > 28S rRNA(表 5)。
表 5 BestKeeper软件分析候选内参基因的稳定性
Table 5. Stability analysis of candidate reference genes by BestKeeper
组织Tissues EF1α GAPDH UBQ 18S rRNA 28S rRNA UBC Actin 根Root SD[± Ct] 0.009 0.047 0.159 0.089 0.125 0.076 0.013 CV[% Ct] 0.036 0.191 0.676 0.321 1.623 0.336 0.050 排序Bank 1 3 6 4 7 5 2 茎Stem SD[± Ct] 0.142 0.105 0.495 0.086 0.501 0.289 0.112 CV[% Ct] 0.720 0.491 2.212 0.323 9.090 1.343 0.440 排序Bank 4 3 6 1 7 5 2 叶Leaf SD[± Ct] 0.036 0.076 0.123 0.215 0.237 0.049 0.087 CV[% Ct] 0.173 0.309 0.555 0.835 3.680 0.222 0.325 排序Bank 1 3 5 6 7 2 4 最终排序Final bank 1 3 6 4 7 5 2 SD:标准差Standard Deviation;CV:变异系数Coefficient of Variation。 -
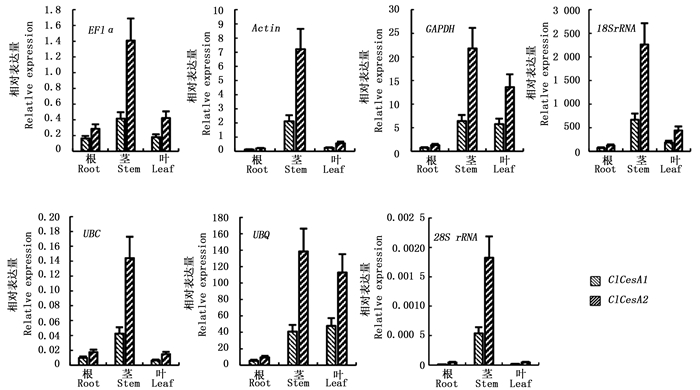
为验证候选内参基因的表达稳定性,试验采用实时荧光定量PCR分别检测在7个候选内参基因下,杉木根、茎、叶中2个纤维素合酶基因ClCesA1和ClCesA2的表达情况。结果(图 4)表明:7个内参基因在杉木各个组织中的表达趋势均有不同,其中,以Actin、EF1α、UBC、18S rRNA与28S rRNA作为内参基因时,2个目的基因在杉木根、茎与叶中表达趋势相近,且均为茎中的相对表达量最高。GAPDH和UBQ作为内参基因时,ClCesA2的相对表达趋势基本相同,均为茎中目的基因相对表达量最高,叶中次之,根中最低;而ClCesA1则是在茎与叶中相对表达量相近,且均高于根中的相对表达量。同时,结果表明,以不同内参基因为参照时,杉木这2个基因的相对表达量有很大差异(纵坐标的相对表达量值),EF1α的相对表达量介于0.15~1.4,而18S rRNA的相对表达量则介于28~2 263(图 4)。ClCesA2的表达量在杉木根、茎与叶中均高于ClCesA1;Actin、UBC、18S rRNA与28S rRNA显示的2个基因在不同杉木组织的表达趋势与相对表达量较为一致,均为茎中远高于根和叶。结果说明,在进行荧光定量试验过程中,采用不同的内参基因对目的基因的表达进行校正,会出现不同的试验结果,如果试验时选用的内参基因不恰当,可能导致相对表达量的错误估计。
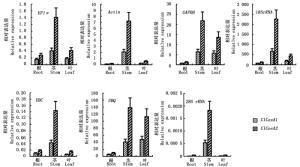
图 4 候选内参基因作为试验内参基因分析目标基因的表达
Figure 4. The candidate reference genes as test reference gene in the analysis of target gene expression
-
实时荧光定量PCR凭借其特异性好、灵敏度高等特点,被广泛应用于基因的表达分析研究中,其分析的结果则与内参基因的选择密切相关,不恰当的内参基因将使分析结果产生偏差,甚至得出错误的结论[22-24]。因此,在用实时荧光量PCR分析目标基因的表达情况之前,需要对内参基因进行筛选,以确保分析结果的有效性。
传统的内参基因多数是细胞骨架的基本组成或参与生物体基本代谢调控过程的基因,如Actin编码细胞骨架结构蛋白,TUB(β微管蛋白,β-tubulin)主要参与细胞生长和光刺激反应,GAPDH编码糖酵解、糖异生及光合作用碳固定循环过程中的关键酶,EF1α参与转录延伸等等。由于内参基因的重要意义,研究人员对不同植物中稳定表达的内参基因筛选做了较多研究,筛选出了一些针对植物不同组织部位的稳定内参基因。拟南芥(Arabidopsis thaliana (L.) Heynh.)种子中稳定的内参基因为UBC[25],拟南芥在不同组织中的稳定内参基因为UBQ5、APT1以及EF1α[26];水稻(Oryza sativa L.)在不同组织中稳定的内参基因为CYC[27],干旱胁迫下水稻不同类型样本中的稳定内参基因则是UBQ与GAPDH[16];烟草(Nicotiana tabacum L.)在不同组织中稳定的内参基因为L25与EF1α[28],在非生物胁迫下的稳定内参基因则是PP2A与Actin[29];番茄(Lycopersicon esculentum Mill.)在不同组织器官中的稳定内参基因为CYC和TIP41[30]。同时,针对植物在不同试验条件下的内参基因筛选,也逐渐成为研究趋势。胡杨(Populus euphratica Oliv.)较为稳定的内参基因,在干旱胁迫下为Glla和Actin,在短期盐处理下为Glla和RPL17,在长期盐处理条件下则是TUB和RP[31]。茶树(Camellia sinensis (L.) O. Ktze.)在不同成熟叶片与愈伤组织中GAPDH为较为合适的内参基因,在不同组织器官中则是β-actin最为稳定[32];而在不同逆境条件下对比筛选茶树幼叶中的内参基因时发现,在冷害、干旱与盐胁迫等条件下,GAPDH的表达稳定性优于其他内参基因[33]。同时也有研究表明,不同氮处理下茶树幼叶中的稳定内参基因是GAPDH或者GAPDH+β-actin组合[34]。这些研究均表明,内参基因要根据植物类型、组织部位和试验条件进行准确的筛选评估和验证,因此,建立多内参基因的评价体系,是提高实时荧光定量PCR试验准确性的重要保证。
Wang Z等通过软件geNorm、Normfinder和BestKeeper筛选对比了UBQ、eIF-3、eIF-4A、Actin、GAPDH、EF1α、α-TUB、β-TUB及40S这9个常用内参基因在杉木形成层中的稳定性,得出在杉木形成层过程中eIF-3、eIF-4A、UBQ和Actin的稳定性较优,并选择3个软件稳定性均居优的基因eIF-3作为分析杉木形成层发展情况的表达分析中的内参基因[20]。本试验通过软件geNorm、Normfinder和BestKeeper对杉木中的7个候选内参基因进行稳定性评价分析,综合3个软件的分析结果,筛选杉木基因表达分析中可用的相对最稳定的内参基因,并通过纤维素合酶基因ClCesA1和ClCesA2的表达分析验证综合筛选结果。软件geNorm显示,根中最稳定的内参基因为Actin,茎中为EF1α、叶中为UBQ;软件Normfinder分析表明,根中GAPDH最稳定,茎中是EF1α,叶中则是UBQ;软件BestKeeper分析得到根与叶中稳定内参基因是EF1α,茎中是18S rRNA。在杉木根、茎叶中ClCesA2的相对表达量均高于ClCesA1,且不同内参基因作为校正参比时,ClCesA1和ClCesA2的表达量均有所不同。以Actin、EF1α、UBC、18S rRNA与28S rRNA作为内参基因时,ClCesA1和ClCesA2基因在根、茎和叶中的表达趋势相近,均为茎中相对表达量最高,叶次之。以GAPDH和UBQ作为内参基因时,ClCesA1在杉木茎与叶中的相对表达量相近,且高于根中表达量,ClCesA2则是表现为茎中最高,叶次之。3个软件综合评价结果显示,在杉木根与茎中,合适的稳定内参基因均以Actin、EF1α与GAPDH为主;而在杉木叶中,软件geNorm、Normfinder评价得到的最佳内参基因是UBQ与EF1α,软件BestKeeper得出的合适内参基因为Actin与EF1α,同杉木根和茎的稳定内参基因相接近;同时,3个组织器官中最不稳定的内参基因均为28S rRNA。结果表明,7个候选内参基因中,Actin与EF1α在杉木不同组织中较为稳定,推荐作为荧光定量PCR试验的内参基因;28S rRNA评价为较不稳定,不适合作为杉木基因表达分析的内参基因。
-
本研究通过对比分析GAPDH、EF1α、18S rRNA、28S rRNA、UBQ、UBC与Actin共7个候选内参基因在杉木实时荧光定量PCR分析中的表达稳定性,筛选获得了在杉木不同组织中稳定表达的合适内参基因Actin与EF1α;28S rRNA的表达稳定性低,不适合作为杉木实时荧光定量PCR分析的理想内参基因。以Actin与EF1α作为内参基因,对纤维素合酶基因ClCesA1和ClCesA2在杉木不同组织中的相对表达量进行分析,结果表明:ClCesA1和ClCesA2在杉木中的相对表达量排序为茎>叶>根,且ClCesA2在各个组织中的相对表达量均高于ClCesA1。本研究筛选获得了适合杉木实时荧光定量PCR分析的内参基因,为提高杉木实时荧光定量PCR试验准确性提供了基础背景校正的稳定参照值。
杉木实时荧光定量PCR分析中内参基因的选择
Quantitative Real-time PCR Analysis of Cunninghamia lanceolata in the Selection of the Reference Genes
-
摘要:
目的 筛选适用于杉木不同组织荧光定量PCR分析的稳定内参基因,提高杉木实时荧光定量PCR试验准确性,为杉木体内各个基因表达分析提供合适内参基因。 方法 通过实时荧光定量PCR获取GAPDH、EF1α、18S rRNA、28S rRNA、UBQ、UBC与Actin 7个候选内参基因在杉木无性系的根、茎和叶中的溶解曲线与Ct值;利用软件geNorm、Normfinder和BestKeeper对候选内参基因的表达稳定性进行评价;通过分析2个纤维素合酶基因ClCesA1和ClCesA2在杉木不同组织部位的相对表达情况,对候选内参基因的稳定性进行验证。 结果 geNorm、Normfinder和BestKeeper分析结果均表明:在杉木根和茎中最稳定的内参基因是EF1α和Actin;geNorm、Normfinder结果显示杉木叶中稳定的内参基因是UBQ和EF1α,BestKeeper显示杉木叶中最稳定合适内参基因是EF1α和Actin。以Actin与EF1α作为内参基因,荧光定量PCR分析表明,ClCesA1和ClCesA2基因的相对表达量在杉木不同组织中均有所不同,ClCesA2的相对表达量在各个组织中均高于ClCesA1。以不同内参基因作为试验内参基因分析ClCesA1和ClCesA2的表达情况得到,ClCesA1和ClCesA2在各个组织中的相对表达量排序主要为茎>叶>根。 结论 7个候选内参基因中,杉木不同组织中稳定表达的为Actin与EF1α,适合作为表达分析的内参基因;28S rRNA的表达稳定性低,不适合作为杉木定量PCR分析的理想内参基因。 -
关键词:
- 杉木
- / 荧光定量
- / 内参基因
- / BestKeeper
Abstract:Objective To improve the accuracy of real-time fluorescence quantitative PCR test and provide a suitable background reference for expression analysis of Chinese fir (Cunninghamia lanceolata), so as to select the stable internal control genes. Method The soluble curve and Ct value of seven candidate internal reference genes including GAPDH, EF1α, 18S rRNA, 28S rRNA, UBQ, UBC and Actin in roots, stems and leaves of Chinese fir clones were obtained by real-time fluorescence quantitative PCR. The expression stability of candidate reference genes was assessed by geNorm, Normfinder and BestKeeper. The expression stability of candidate reference genes was estimated by analyzing the relative expression of two cellulose synthase genes ClCesA1 and ClCesA2 in different tissues of Chinese fir. Result Three softwares, geNorm, Normfinder and BestKeeper, showed that the most stable internal reference genes expressed in Chinese fir roots and stems were EF1α and Actin. The software geNorm and Normfinder showed that the stable internal reference genes expressed in Chinese fir leaves were UBQ and EF1α. The software BestKeeper showed that the most stable and suitable internal reference genes for expression analysis are EF1α and Actin. Actin and EF1α as internal reference genes showed that the relative expression levels of ClCesA1 and ClCesA2 were different among the tissues of Chinese fir, and the relative expression level of ClCesA2 was higher than that of ClCesA1 in all tissues. According to expression analysis of different reference genes as test reference gene expression of ClCesA1 and ClCesA2, the relative expression levels of ClCesA1 and ClCesA2 were mainly stem > leaf > root. Conclusion Of the 7 candidate reference genes, Actin and EF1α are suitable as internal control genes for expression analysis due to stably expressed in different tissues of Chinese fir. 28S rRNA is not suitable as an ideal internal control gene for quantitative PCR analysis of Chinese fir as a result of the lower expression stability. -
图 2 杉木根中7个内参基因PCR产物琼脂糖凝胶电泳图
Figure 2. Agarose gel electrophoresis of the PCR products of the seven reference genes in Chinese fir root
图 4 候选内参基因作为试验内参基因分析目标基因的表达
Figure 4. The candidate reference genes as test reference gene in the analysis of target gene expression
表 1 候选内参基因与ClCesA1、ClCesA2的引物序列
Table 1. Primer sequences of the candidate reference genes and ClCesA1, ClCesA2
基因名称
gene name引物序列Primer sequence(5' to 3') 退火温度
TM/℃GC含量
GC content/%GAPDH F:GCACCTATGTTTGTGGTTGGAGTA 57.9 45.8 R:ACCGTCTTCTGTGTAGCTGTTGTT 57.9 45.8 UBQ F:AATAAATGCTTCAAATGTCAGGCTA 53.0 32.0 R:TGAGATGGTCTGGTGATGTCGTGG 61.3 54.2 18S rRNA F:GGGAACATTATCACGGACAGCATCAAC 61.1 48.1 R:TGCGACTAATGGTCCAGATAGACTCCT 61.1 48.1 28S rRNA F:AGTTTGTAGAAGCGTCCTCAG 55.6 47.6 R:GGCGCCCCCTTCCA 50.0 78.6 EF1α F:TGGCAAGGAGCTTGAGAAAGAACCCA 61.2 50.0 R:ACCCCAACAGCAACAGTCTGACGCAT 62.7 53.8 UBC F:CTCCTGATGATAGAGGTCTAACG 60.2 47.8 R:ATGACATGGAGGTCGGTACATAG 60.2 47.8 Actin1 F:CTCTCTCAGCACCTTCGAGCAG 63.8 59.1 R:TCCACATACAACCGCTCCACTG 61.9 54.5 ClCesA1 F:CCATCCACAGCTAAATTATCTGC 58.4 43.5 R:CATCATAGCTCTCAATTTCATGTAGA 57.3 34.6 ClCesA2 F:GTCGCAGGATCTCATAACAGG 60.0 52.4 R:CACATTCATTGCAGGCTACA 55.8 45.0  下载: 导出CSV
表 2 候选内参基因与ClCesA1、ClCesA2的平均Ct值
Table 2. The average Ct values of the candidate reference genes and ClCesA1, ClCesA2
组织Tissues 平均Gt值 GAPDH UBQ 18S rRNA 28S rRNA EF1α UBC Actin ClCesA1 ClCesA2 根Root 24.79 23.51 27.84 7.68 23.91 22.76 24.90 27.80 26.99 茎Stem 21.39 22.37 26.48 5.51 19.70 21.54 25.53 24.71 22.95 叶Leaf 24.78 22.10 25.78 6.45 20.73 21.94 26.80 28.74 27.50
下载: 导出CSV
表 3 geNorm软件候选内参基因稳定性评价
Table 3. The evaluation of candidate reference genes stability from geNorm and Normfinder
稳定性排序
Stabilit-y bank根Root 茎Stem 叶Leaf 最终排序
Final bank基因名称
Gene name稳定性M值
Stability value基因名称
Gene name稳定性M值
Stability value基因名称
Gene name稳定性M值
Stability value1 Actin 0.11 EF1α 0.336 UBQ 0.164 EF1α 2 EF1α 0.114 Actin 0.339 EF1α 0.184 Actin 3 GAPDH 0.116 18S rRNA 0.350 GAPDH 0.196 GAPDH 4 18S rRNA 0.124 UBC 0.438 Actin 0.202 18S rRNA 5 28S rRNA 0.164 GAPDH 0.464 UBC 0.208 UBC 6 UBC 0.178 28S rRNA 0.697 18S rRNA 0.221 UBQ 7 UBQ 0.185 UBQ 0.731 28S rRNA 0.252 28S rRNA
下载: 导出CSV
表 4 Normfinder软件候选内参基因稳定性评价
Table 4. The evaluation of candidate reference genes stability from geNorm and Normfinder
稳定性排序
Stabilit-y bank根Root 茎Stem 叶Leaf 最终排序
Final bank基因名称
Gene name稳定性M值
Stability value基因名称
Gene name稳定性M值
Stability value基因名称
Gene name稳定性M值
Stability value1 GAPDH 0.033 EF1α 0.017 UBQ 0.042 EF1α 2 18S rRNA 0.034 Actin 0.017 EF1α 0.087 GAPDH 3 Actin 0.036 18S rRNA 0.057 GAPDH 0.096 Actin 4 EF1α 0.046 UBC 0.174 Actin 0.099 18S rRNA 5 28S rRNA 0.094 GAPDH 0.220 UBC 0.120 UBC 6 UBC 0.112 28S rRNA 0.464 18S rRNA 0.130 UBQ 7 UBQ 0.115 UBQ 0.484 28S rRNA 0.162 28S rRNA
下载: 导出CSV
表 5 BestKeeper软件分析候选内参基因的稳定性
Table 5. Stability analysis of candidate reference genes by BestKeeper
组织Tissues EF1α GAPDH UBQ 18S rRNA 28S rRNA UBC Actin 根Root SD[± Ct] 0.009 0.047 0.159 0.089 0.125 0.076 0.013 CV[% Ct] 0.036 0.191 0.676 0.321 1.623 0.336 0.050 排序Bank 1 3 6 4 7 5 2 茎Stem SD[± Ct] 0.142 0.105 0.495 0.086 0.501 0.289 0.112 CV[% Ct] 0.720 0.491 2.212 0.323 9.090 1.343 0.440 排序Bank 4 3 6 1 7 5 2 叶Leaf SD[± Ct] 0.036 0.076 0.123 0.215 0.237 0.049 0.087 CV[% Ct] 0.173 0.309 0.555 0.835 3.680 0.222 0.325 排序Bank 1 3 5 6 7 2 4 最终排序Final bank 1 3 6 4 7 5 2 SD:标准差Standard Deviation;CV:变异系数Coefficient of Variation。
下载: 导出CSV
-
[1] Suzuki T, Higgins P J, Crawford D R. Control selection for RNA quantitation[J].Biotechniques, 2000, 29(2):332-337. doi: 10.2144/00292rv02 [2] Bustin S A.Quantification of mRNA using real-time reverse transcription PCR (RT-PCR):trends and problems[J].Journal of Molecular Endocrinology, 2002, 29(1):23-39. [3] VanGuilder H D, Vrana K E, Freeman W M. Twenty-five years of quantitative PCR for gene expression analysis[J].Biotechniques, 2008, 44(5):619-626. doi: 10.2144/000112776 [4] Derveaux S, Vandesompele J, Hellemans J. How to do successful gene expression analysis using real-time PCR[J].Methods, 2010, 50(4):227-230. doi: 10.1016/j.ymeth.2009.11.001 [5] 袁伟, 万红建, 杨悦俭.植物实时荧光定量PCR内参基因的特点及选择[J].植物学报, 2012, 47(4):427-436. [6] 胡瑞波, 范成明, 傅永福.植物实时荧光定量PCR内参基因的选择[J].中国农业科技导报, 2009, 11(6):30-36. doi: 10.3969/j.issn.1008-0864.2009.06.006 [7] 张艳君, 朱志峰, 陆融, 等.基因表达转录分析中内参基因的选择[J].生物化学与生物物理进展, 2007, 34(5):546-550. doi: 10.3321/j.issn:1000-3282.2007.05.015 [8] 张玉芳, 赵丽娟, 曾幼玲.基因表达研究中内参基因的选择与应用[J].植物生理学报, 2014, 50(8):1119-1125. [9] 苏晓娟, 樊保国, 袁丽钗, 等.实时荧光定量PCR分析中毛果杨内参基因的筛选和验证[J].植物学报, 2013, 48(5):507-518. [10] 任锐, 戴鹏辉, 李萌, 等.珙桐实时定量PCR内参基因的筛选及稳定性评价[J].植物生理学报, 2016, 52(10):1565-1575. [11] 庞强强, 李植良, 罗少波, 等.高温胁迫下茄子qRT-PCR内参基因筛选及稳定性分析[J].园艺学报, 2017, 44(3):475-486. [12] 孙亚丽, 张德辉, 赵亮, 等.铜胁迫下天蓝苜蓿根组织实时定量PCR内参基因的选择[J].农业生物技术学报, 2014, 22(10):1223-1231. doi: 10.3969/j.issn.1674-7968.2014.10.005 [13] 魏毅东, 陈玉, 郭海萍, 等.水稻缺素胁迫下实时荧光定量RT-PCR的内参基因的选择[J].农业生物技术学报, 2013, 21(11):1302-1312. doi: 10.3969/j.issn.1674-7968.2013.11.006 [14] Chi X, Hu R, Yang Q, et al. Validation of reference genes for gene expression studies in peanut by quantitative real-time RT-PCR[J].Molecular Genetics & Genomics, 2012, 287(2):167-176. [15] Thellin O, Zorzi W, Lakaye B, et al. Housekeeping genes as internal standards:use and limits[J].Journal of Biotechnology, 1999, 75(2-3):291-295. doi: 10.1016/S0168-1656(99)00163-7 [16] Bevitori R, Oliveira M B, Grossidesá M F, et al.Selection of optimized candidate reference genes for qRT-PCR normalization in rice (Oryza sativa L.) during Magnaporthe oryzae infection and drought[J].Genetics & Molecular Research Gmr, 2014, 13(4):9795-9805. [17] 彭沙沙.杉木材性相关基因的克隆、表达及单核苷多态性分析[D].杭州: 浙江农林大学, 2011. [18] 祝艾静.杉木microRNA399a的功能研究[D].新乡: 河南师范大学, 2015. [19] Bao W, Qu Y, Shan X, et al. Screening and validation of housekeeping genes of the root and cotyledon of Cunninghamia lanceolata under abiotic stresses by using quantitative Real-Time PCR[J].International Journal of Molecular Sciences, 2016, 17(8):1198-1215. doi: 10.3390/ijms17081198 [20] Wang Z, Chen J, Liu W, et al. Transcriptome characteristics and six alternative expressed genes positively correlated with the phase transition of annual cambial activities in chinese fir (Cunninghamia lanceolata, (Lamb.) Hook)[J].Plos One, 2013, 8(8):e71562. doi: 10.1371/journal.pone.0071562 [21] 魏晓骁, 王士亚, 陈潇潇, 等.一个新杉木纤维素合酶ClCesA基因的克隆与植物表达载体构建[J].福建农林大学学报:自然版, 2017, 46(1):66-72. [22] Albershardt T C, Iritani B M, Ruddell A. Evaluation of reference genes for quantitative PCR analysis of mouse lymphocytes.[J]. Journal of Immunological Methods, 2012, 384(1-2):196-199. doi: 10.1016/j.jim.2012.07.020 [23] Luo H, Luo K, Luo L, et al. Evaluation of candidate reference genes for gene expression studies in Cymbidium kanran[J]. Scientia Horticulturae, 2014, 167(3):43-48. [24] Mohelnikovaduchonova B, Oliverius M, Honsova E, et al. Evaluation of reference genes and normalization strategy for quantitative Real-Time PCR in human pancreatic carcinoma[J]. Disease Markers, 2012, 32(3):203-20. doi: 10.1155/2012/582107 [25] Czechowski T, Stitt M, Altmann T, et al. Genome-wide identification and testing of superior reference genes for transcript normalization in Arabidopsis[J]. Plant Physiology, 2005, 139(1):5-17. doi: 10.1104/pp.105.063743 [26] Gutierrez L, Mauriat M, Guénin S, et al. The lack of a systematic validation of reference genes:a serious pitfall undervalued in reverse transcription-polymerase chain reaction (RT-PCR) analysis in plants[J]. Plant Biotechnology Journal, 2008, 6(6):609-618. doi: 10.1111/pbi.2008.6.issue-6 [27] Pabuayon I M, Yamamoto N, Trinidad J L, et al. Reference genes for accurate gene expression analyses across different tissues, developmental stages and genotypes in rice for drought tolerance[J]. Rice, 2016, 9(1):32-39. doi: 10.1186/s12284-016-0104-7 [28] Schmidt G W, Delaney S K. Stable internal reference genes for normalization of real-time RT-PCR in tobacco (Nicotiana tabacum) during development and abiotic stress[J]. Molecular Genetics & Genomics, 2010, 283(3):214-233. [29] Liu D, Shi L, Han C, et al. Validation of Reference Genes for Gene Expression Studies in Virus-Infected, Nicotiana benthamiana, Using Quantitative Real-Time PCR[J]. Plos One, 2012, 7(9):e46451-e46451. doi: 10.1371/journal.pone.0046451 [30] Expósitorodríguez M, Borges A A, Borgespérez A, et al. Selection of internal control genes for quantitative real-time RT-PCR studies during tomato development process[J]. Bmc Plant Biology, 2008, 8(1):131. [31] Wang H L, Chen J, Tian Q, et al. Identification and validation of reference genes for Populus euphratica gene expression analysis during abiotic stresses by quantitative real-time PCR[J]. Physiologia Plantarum, 2014, 152(3):529-545. doi: 10.1111/ppl.2014.152.issue-3 [32] 孙美莲, 王云生, 杨冬青, 等.茶树实时荧光定量PCR分析中内参基因的选择[J].植物学报, 2010, 45(5):579-587. doi: 10.3969/j.issn.1674-3466.2010.05.007 [33] 郝姗.茶树不同逆境条件下qRT-PCR适宜内参基因的筛选[D].南京: 南京农业大学, 2012: 47-55. [34] 刘圆, 王丽鸳, 韦康, 等.不同氮处理茶树实时定量PCR内参基因筛选和验证[J].茶叶科学, 2016(1):92-101. doi: 10.3969/j.issn.1000-369X.2016.01.012 -

 点击查看大图
计量
- 文章访问数: 4046
- HTML全文浏览量: 1845
- PDF下载量: 113
- 被引次数: 0
