

-
水青树(Tetracentron sinense Oliv.)隶属水青树科(Tetracentraceae)水青树属(Tetracentron),是水青树科仅有的一种高大落叶乔木[1];主要分布在我国西南及华中地区的900~3 500 m的深山、峡谷、陡坡悬崖等处;其树形伸展大气,叶形美观,颜色翠绿,可作为供观赏的行道树;其茎干中含有HIV和有关白细胞活性的化学成分[2-3],在医学研究方面有着重要的价值;其化石发现于中生代中期的始新世地层,是现存的较古老被子植物,其对于研究古代植物区系以及被子植物的系统演化和起源等方面具有重要的科学价值[4]。由于受自然条件的变化和人为因素干扰等的影响,水青树的种群和数量日益缩减,目前野外分布零散且稀少,已是国家Ⅱ级重点保护濒危植物[5]。国内外科学家已开始密切关注水青树的种质资源怎样才能得到有效保护和利用。
对于濒危植物的保护关键之处在于如何较好的保护其遗传多样性, 而人类保护珍稀濒危植物重要的措施之一就是对其进行迁地保护[6]。虽然水青树分布范围比较广泛,且种质资源数量丰富,但是如何对其进行有效的评价、研究和利用是水青树种质资源保护急需解决的难题[7]。同时,在对水青树进行迁地保护时,选择怎样的取样策略才能保证用尽可能少的种质保存尽可能多的现有遗传资源,这是在具体保护措施制定时面临的又一难题。“核心种质”的出现成为解决这一问题的新思路[8-10]。Frankel提出, 运用一定方法建立植物的核心种质,把最小的资源数量以及最大程度的遗传重复从原种质中筛选出来从而代表整个遗传资源的多样性[8]。因此,核心种质资源库在植物遗传资源的利用以及管理方面起了很大的作用[11];而在构建其核心种质资源库时,不同的取样策略对于不同种类植物的效果是不一样的,选择有效的取样策略就得尤为重要[12]。目前,刘娟等运用位点优先取样策略构建了野杏的种质资源库[13];赵宁等对山茱萸的种质资源库构建时提出采用位点优先取样策略是构建该物种的最适方法[14];胡建斌等运用比例法构建甜瓜的核心库[15]。我国陆续对一些其它木本植物进行了核心种质资源库的构建,如新疆野核桃[16]、新疆野苹果[17]等, 为它们的种质资源保护奠定了基础。然而,有关濒危木本植物种质库构建方面的研究还很少[18]。
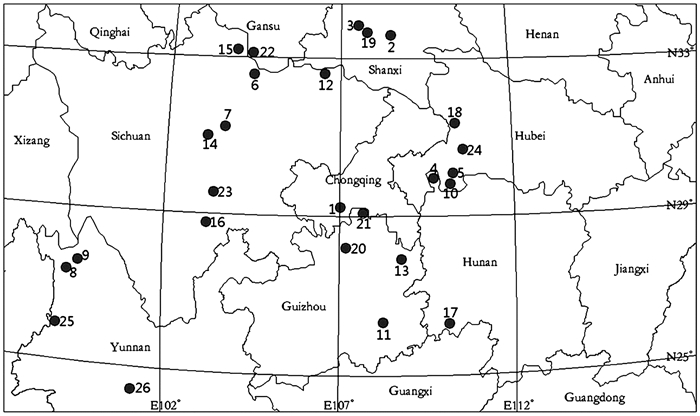
经全面考察水青树的分布现状发现,水青树多呈零星散生,通常在400 m2的范围内仅有2~3棵成年植株。结合水青树实际分布情况,笔者于2015—2016年在四川、重庆、贵州、云南、陕西、甘肃、湖南、湖北这8个省市挑选出26个水青树居群共161个株系(图 1),构建了水青树的种质资源库。但是构建的种质资源库的多样性如何,且应该运用什么方法、什么材料来进一步构建水青树的核心种质,迄今为止,还没有相关研究。由于濒危植物水青树种子千粒质量很轻,它的平均值低于很多木本植物[4],野外收集有一定难度。相较于植物其它器官而言,叶对环境变化的响应比较明显,即环境一旦发生变化,叶的性状会有较大几率发生变化。换句话说,叶形态的变异也能在一定程度上反映其与环境之间的相互作用[19-20]。目前,通过叶表型变异来探讨植物种群的遗传变异已有较多研究[21-25]。因此,本文对161个水青树种质的叶表型变异情况进行评价,并利用多种方法比较分析了其核心种质资源库构建的策略,为水青树种质资源的进一步保护提供科学依据。

图 1 26个水青树居群的地理分布
Figure 1. Geographical distribution of 26 T. sinense populations
-
于2016年7月,对每个株系长势健康且没有明显病虫危害、分布在其中下层树冠的多年生带叶枝条,分别采集3~4份带回实验室待测。标本存放于西华师范大学植物学标本室。
-
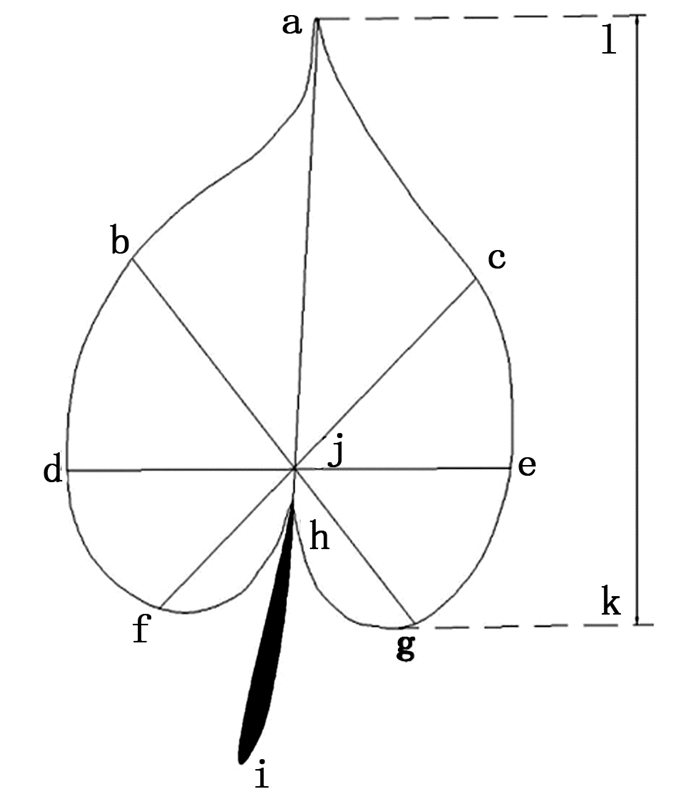
借鉴韦艳梅等[25]、戚继忠的[26]方法,将水青树叶性状先进行分解(图 2),结合实际情况,选取10个性状。从每个样本中选取15片成熟且完整的叶片进行测量。首先用直尺测量以下指标:叶长、叶宽、叶柄长等,精确到0.01 cm;再借鉴田青等[27]测量叶面积的方法,用EPSON PERFECTION V350 PHOTO扫描仪1︰1扫描叶片,接着利用AUTO CAD 2006软件计算其面积及周长,进一步计算其叶全长、叶形指数、叶基尖削指数以及叶先端尖削指数等各个参数值[27]。
相关指标的测量标准和和计算方法如下:
叶长=ah;叶最长=kl;叶全长=ah+hi;叶柄长=hi;叶宽=de;叶形指数=ah/de;叶基尖削指数=(fj+gj)/2/hj;叶先端尖削指数=(bj+cj)/2/aj。
-
从每样株中筛选出3片叶片,要求每片叶子均是成熟完整的,找到叶片中脉的中间位置,在其两边分别剪取1个1 cm×1 cm的小方块,运用KOH解离法[20]解离小方块,直到能分离上下表皮,用镊子撕离上下表皮,表皮上的叶肉细胞用毛笔除去,制作叶表皮临时装片,然后用番红染液染色便于之后的观察。
-
研究气孔器长度、气孔器宽度、上表皮细胞周长、上表皮细胞面积大小、上表皮细胞弯曲度指数、上表皮细胞密度、气孔器密度这7个叶表皮微形态性状[13, 24]。
用Moticam Pro 285A数码显微成像系统观察表皮装片,对每张装片的3个不同的视野进行拍照,并记录下表皮的气孔器数目和上表皮的细胞数目,从而计算出表皮细胞密度和气孔器密度的值。从每张装片中的每个视野上选择3个气孔器,运用Motic Images Plus2. 0软件测量上表皮细胞的周长和面积、气孔器的长和宽,并计算出上表皮细胞弯曲度指数。
-
根据测量的数据,算出各个表型性状的均值、方差、标准差,变异系数,极差等;最后得出CR%(极差符合率)、VR%(变异系数变化率)、MD%(均值差异百分率)、VD%(方差差异百分率)、T值等10个参数[29]。相关数据分析在SPSS 23.0上进行,其他常规数据分析在EXCEL等上进行。
-
先对161个水青树个体利用主成分分析法分析[30],再对其进行聚类。运用SPSS软件对分析后的原始数据进行标准化,以此来消除其量纲和数量级,最后得到无量纲数据,其均值为0、方差为1。根据标准化后的数据,利用欧氏距离和瓦尔德法进行逐步聚类,得到各个体间聚类图。
-
利用总体取样比例法,设定相应的取样比例。目前,绝大多数研究中用来构建种质资源库的取样比例设定在5%~40%[31]。但又有大量文献表明,总体样本数量少的,其种质资源的取样比例会相对更大一点[31]。根据本次的161份实验材料,设定10%、15%、20%、25%、30%、35%、40%、45%、50%、55%10个取样比例。根据设定的10个取样比例,分别用随机(Random sampling strategy)[32]、位点优先[29](Allele preferred sampling strategy)和偏离度取样策略[33](Deviation sampling)3种取样方法进行取样,以此构建各取样比例的种质资源库。通过对这3种取样策略下构建的种质资源代表性进行检验和比较,筛选出最优种质资源库。
-
对筛选的核心种质资源库的各表型性状参数值进行t检验[33],以验证库中的核心种质是否能够有效的代表原种质;再检测评价核心种质资源库中的各系数,比较其与原种质各系数的符合程度。分别对原种质和核心种质资源库进行主成分分析,查看各主成分的累积贡献率及得分情况,确认其核心种质,并评价该种质遗传多样性的高低及其结构的保存水平。
-
利用软件SPSS计算构建的161个种质的水青树表型性状各指标值见表 1。各表型性状在一定程度上存在差异。由于各表型性状存在量纲差别,而变异系数正好消除了各性状之间的量纲区别,因此,变异系数具有可比性和代表性。根据表 1结果可知:叶先端尖削指数的变异系数最大,为50%,其它性状的变异系数在10%~50%间(上表皮细胞弯曲度指数除外,它的变异系数最小)。整体而言,本实验所选的水青树叶表型性状都存在较大的变异,其遗传多样性较高,证明这161个种质资源能较好的反应水青树的遗传变异。
表 1 水青树各表型性状值
Table 1. The phenotypic traits values of T. sinense
变异系数
variable coefficient标准差
standard deviation平均值
mean方差
variance极差
range上表皮细胞数目Number of epidermal cells/个 0.43 52.53 122.92 2 758.94 355.68 气孔器数目Number of stmata/个 0.39 4.95 12.82 24.54 23.91 气孔器长The stomata length/μm 0.16 7.04 42.78 49.57 29.89 气孔器宽The stomata width/μm 0.18 6.54 35.64 42.81 25.25 上表皮细胞面积Upper epidermal cell area/μm2 0.40 734.99 1 835.44 540 208.74 3 181.18 上表皮细胞周长Perimeter of epidermal cells/μm 0.27 51.77 192.99 2 680.64 248.67 上表皮细胞弯曲度指数Upper epidermal cell curvature index 0.08 0.11 1.29 0.01 0.53 上表皮细胞密度Density of epidermal cells/(个·mm-2) 0.42 374.07 889.40 139 930.13 2 370.14 气孔器密度Stomatal density/(个·mm-2) 0.39 35.90 92.92 1 288.96 173.26 叶面积Leaf area/cm2 0.25 12.72 51.03 161.75 73.50 叶周长Leaf perimeter/cm 0.12 3.59 28.88 12.91 21.37 叶柄长Petiole length/cm 0.18 0.47 2.53 0.22 2.44 叶长Length of leaf/cm 0.14 1.39 9.80 1.93 12.37 叶最长The longest leaf/cm 0.14 1.51 11.10 2.30 8.64 叶宽Leaf width/cm 0.18 1.30 7.12 1.69 11.79 叶基Phyllo podium/cm 0.14 0.51 3.61 0.26 3.69 叶基尖削指数Leaf base sharpening index 0.20 0.27 1.34 0.07 2.84 叶先端尖削指数Leaf apex sharpening index 0.50 0.32 0.65 0.10 4.27 叶全长Leaf length/cm 0.12 1.54 12.35 2.36 11.46 叶形指数Leaf index 0.34 0.49 1.46 0.24 6.06 -
分析水青树20个叶表型性状的主成分,获得了5个能够代表其性状的特征值(分析时,从每个原始变量里提取的信息,SPSS默认保留其>1的值)大于1的主成分,且其累积贡献率达到了87.692%(表 2,自第6主成分开始特征值小于1)。对以上所提取出的主成分分别计算各主成分值,并进一步利用主成分值对各个体进行聚类分析,以此来研究各个体间的亲缘关系。
表 2 主成分分析
Table 2. Principal Component Analysis (PCA)
特征值
Eigenvalue贡献率/%
Contribution rate累积贡献率/%
Accumulating contribution rate1 7.598 33.036 33.036 2 5.959 25.910 58.946 3 3.614 15.715 74.661 4 1.747 7.595 82.257 5 1.250 5.436 87.692 6 0.652 2.836 90.528 -
采用随机取样法抽取10个比例的种质资源。随着抽样比例的增大,除CR外,叶表型性状的各参数均呈先逐渐增大后逐渐减小的趋势;其中,VR和VD在取样比例为35%时达到最大,此时CR和MD也相对较高(表 3)。因此,R6最能代表原种质,并得到56份核心种质。
表 3 随机取样的种质资源与原种质性状差异百分率
Table 3. Percentage difference between germplasm resources and original germplasm characters by random sampling strategy
种质资源库
Germplasm resources bank取样比例
Sampling ratio/%均值差异百分率
MD/%方差差异百分率
VD/%变异系数变化率
CR/%极差符合率
VR/%R1 10 1 21 50 85 R2 15 2 17 54 86 R3 20 2 16 58 87 R4 25 2 16 61 87 R5 30 0 19 64 86 R6 35 1 34 89 113 R7 40 0 26 89 110 R8 45 0 24 91 110 R9 50 0 19 91 108 R10 55 0 13 91 106 -
用位点优先取样法来抽取10个比例的种质资源时发现,各取样比例的MD均较小,绝大部分为0;VD和CR均随取样比例的增大而呈现出相似的变化趋势,在取样比例为45%时达到最大(表 4),而此时VR的值相对较高。因此,S8最能反映原种质各情况,并得到72份核心种质。
表 4 位点优先取样的种质资源与原种质性状差异百分率
Table 4. Percentage difference between the germplasm resources and the original germplasm characters sampled by allele preferred sampling strategy
种质资源库
Germplasm resources bank取样比例
Sampling ratio/%均值差异百分率
MD/%方差差异百分率
VD/%变异系数变化率
CR/%极差符合率
VR/%S1 10 1 73 82 47 S2 15 21 136 87 58 S3 20 1 80 88 58 S4 25 0 74 83 60 S5 30 0 71 82 60 S6 35 0 71 82 62 S7 40 0 71 82 66 S8 45 0 111 103 89 S9 50 0 109 103 92 S10 55 1 106 102 92 -
用偏离度取样策略构建水青树种质资源库时发现:MD的值大多接近0%;CR和VR值较大,但是VD值较小。从结果中可以得到,该种取样策略下,筛选出的最适种质资源应是45%取样比例下的种质(表 5),即,D8为最适种质资源,共72份。
表 5 偏离度取样的种质资源与原种质性状差异百分率
Table 5. Percentage difference between germplasm resources and original germplasm characters sampled by deviation sampling
种质资源库
Germplasm resources bank取样比例
Sampling ratio/%均值差异百分率
MD/%方差差异百分率
VD/%变异系数变化率
CR/%极差符合率
VR/%D1 10 2 20 63 107 D2 15 2 7 66 101 D3 20 1 7 67 94 D4 25 0 10 68 92 D5 30 0 17 69 88 D6 35 0 16 70 88 D7 40 1 12 71 91 D8 45 0 22 91 109 D9 50 0 13 91 106 D10 55 0 13 93 106 -
比较不同策略构建的核心种质(表 6),位点优先取样策略构建得来的种质,其各表型性状的极差、均值和方差等值均大于随机和偏离度这2种策略;不仅如此,叶表型性状的变异系数在位点优先取样时最小,随机取样时却是最大的;MD在位点优先和偏离度取样时均为0;位点优先取样的VD远大于随机以及偏离度取样策略的VD;虽然位点优先取样法下的VR略小于其他2种方法,但综合考虑,位点优先取样策略更适合用来构建濒危植物水青树的核心种质资源库。因此,在相同的聚类方法下,结合位点优先取样策略一共构建了72份水青树核心种质资源。
表 6 3种取样策略下各参数值
Table 6. The values of each parameter under the three sampling strategies
核心种质资源库
Core collection极差
Range均值
Mean标准差
Standard deviation方差
Variance变异系数
Coefficient of variation均值差异百分率MD/% 方差差异百分率VD/% 变异系数变化率CR/% 极差符合率VR/% D8 251.59 147.51 53.93 27 856.49 0.27 0 22 91 109 R6 218.79 148.69 57.34 32 664.20 0.28 1 34 89 113 S8 260.66 149.40 52.74 28 184.87 0.25 0 111 103 89 -
由表 7可知:对初步构建的核心种质进行t检验,结果均不显著,这说明本次实验所构建的核心种质与原种质在遗传多样性上相差不大。检测种质各表型性状平均值、变异系数与原种质符合度发现,均值符合率达到94.4%以上;变异系数符合率也高达84.8%以上。因此,本次构建的核心种质资源库具有原种质中的各性状变异,且这72份种质是有效的。
表 7 比较构建的核心种质与原种质的不同性状
Table 7. To compare the characters of the core collection and the primary germplasm
编号
Code性状
Traits均值Mean 变异系数Coefficient of variation t值
t-value原种质
Primary germplasm核心种质
Core collection符合率
Coincidence rate原种质
Primary germplasm核心种质
Core collection符合率
Coincidence rate1 上表皮细胞数目Number of epidermal cells/个 122.92 116.05 0.94 0.43 0.36 0.85 0.98 2 气孔器数目Number of stomata/个 12.82 12.15 0.95 0.39 0.34 0.89 1.01 3 气孔器长The stomata length/μm 42.78 43.43 1.02 0.16 0.16 0.95 -0.65 4 气孔器宽The stomata width/μm 35.64 36.12 1.01 0.18 0.18 0.96 -0.52 5 上表皮细胞面积Upper epidermal cell area/μm2 1 835.44 1 953.04 1.06 0.40 0.38 0.95 -1.13 6 上表皮细胞周长Perimeter of epidermal cells/μm 192.99 200.12 1.04 0.27 0.25 0.93 -0.98 7 上表皮细胞弯曲度指数
Upper epidermal cell curvature index1.29 1.29 1.00 0.08 0.07 0.88 -0.42 8 上表皮细胞密度Density of epidermal cells/(个·mm-2) 889.40 840.96 0.95 0.42 0.36 0.86 0.97 9 气孔器密度Stomatal density/(个·mm-2) 92.92 88.03 0.95 0.39 0.34 0.89 1.01 10 叶面积Leaf area/cm2 51.03 51.50 1.01 0.25 0.24 0.95 -0.27 11 叶周长Leaf perimeter/cm 28.88 28.97 1.00 0.12 0.12 0.96 -0.17 12 叶柄长Petiole length/cm 2.53 2.53 1.00 0.18 0.18 0.96 0.08 13 叶长Length of leaf/cm 9.80 9.73 0.99 0.14 0.17 1.18 0.33 14 叶最长The longest leaf/cm 11.10 11.17 1.01 0.14 0.13 0.98 -0.35 15 叶宽Leaf width/cm 7.12 7.27 1.02 0.18 0.21 1.13 -0.78 16 叶基Phyllo podium/cm 3.61 3.65 1.01 0.14 0.14 1.00 -0.54 17 叶基尖削指数Leaf base sharpening index 1.34 1.35 1.01 0.20 0.25 1.23 -0.38 18 叶先端尖削指数Leaf apex sharpening index 0.65 0.68 1.05 0.50 0.70 1.40 -0.61 19 叶全长Leaf length/cm 12.35 12.29 1.00 0.12 0.14 1.09 0.26 20 叶形指数Leaf index 1.46 1.49 1.02 0.34 0.47 1.40 -0.39 注:t0.05=1.960,t0.01=2.576。 -
利用主成分分析法确认最终得到的72份核心种质。表 8显示了各主成分解释原种质中原始变量总方差的情况。核心种质在第4个主成分之后特征值开始小于1,其4个主成分几乎包含了原种质各个原始变量80%以上的遗传信息,因此,保留4个主成分最为合适。构建的核心种质中,4个主成分的累积贡献率达到83.366%高于原种质的82.257%,可见,核心种质的贡献率高于原种质,这样有效的避免了种质的冗余。
表 8 水青树原种质和构建的种质资源库的核心种质资源的主成分分析
Table 8. 8 Principal component analysis of the germplasm and the core collection resources in the germplasm bank of T. sinense
主成分
Principal component原种质The original germplasm 核心种质The core collection 特征值
Eigenvalue贡献率/%
Contribution rate累积贡献率/%
Accumulating contribution rate特征值
Eigenvalue贡献率/%
Contribution rate累积贡献率/%
Accumulating contribution rate1 7.598 33.036 33.036 7.214 31.365 31.365 2 5.959 25.910 58.946 5.752 25.008 56.373 3 3.614 15.700 74.661 4.355 18.935 75.308 4 1.747 7.596 82.257 1.853 8.058 83.366 5 1.250 5.435 87.692 0.766 3.832 87.435 6 0.652 2.836 90.528 -
由核心种质资源库[9, 34]的概念可知,种质资源库中的核心种质要以尽可能小的群体数量且能够最大程度的保留原种质的遗传多样性,因此,评价构建的种质资源库是否合适,其关键步骤是检验构建的该种种质资源的遗传多样性高低和实用性的大小[27]。通过比较各评价参数发现:MD、VD、CR、VR这4个参数能更好的反映出构建的种质资源库中的水青树种质与原种质在方差、变异系数等方面的差异[35]。徐海明等[29]研究结果表明,位点优先取样策略构建的种质资源库更优于偏离度取样策略。而在这3种取样策略中,随机取样策略虽然能够获得无偏样本,但其构建的核心种质代表性表,无法保留原种质有效的遗传多样性;相比之下,偏离度取样法却能最大程度的保留原种质的遗传以及变异,而位点优先取样法不仅可以保留原种质的最大性状值,还可以保留其最小性状值,与此同时原种质的遗传结构也能被保留下来[32, 36]。因此,运用欧氏距离和瓦尔德法进行逐步聚类再结合位点优先取样策略来构建水青树的核心种质资源库,是最适合的方法。该结果与新疆野杏等[13]的结果一致。
本次得到水青树种质资源库中共有72份核心种质资源,均是在比例为45%时构建。本次样株数只有161株,最佳取样比例为45%相较于其它样本数多的取样比例偏大。Brown[34]认为,样品数超过3 000时,种质资源库的比例在5%~10%之间;目前大多认为种质资源库的取样比例在5%~40%之间[37],而李自超等[31]认为,如果采集的样本数越少,它的取样比例也会相应变大。因此,本次构建水青树种质资源库的取样比例是合情合理的。
众所周知,植物的表型多样性是由其自身基因和所处的环境共同决定的[36, 38],对于不同的物种来说,引起其表型变异的主要因素不尽相同,有的是以环境为主导,有的则是由自身的基因所决定的。植物的表型变异是其遗传变异的前提,故而可以通过研究植物表型性状来推测其遗传变异的情况[39]。李珊[40]等在水青树叶表型变异的研究中还发现,虽然水青树各天然种群大生境间的异质性较差,水青树对环境变化的适应能力变低,但其叶表型分化仍处于中等水平。所以,叶表型的变异情况也能反映水青树遗传变异的情况。
-
本次构建的核心种质资源库拥有极高的特征值和累计贡献率,既避免了种质资源库的冗杂,又确保了它的代表性。本实验运用水青树叶这一营养器官的表型变异来探究其遗传性状是具有一定科学性的,且利用水青树叶表型性状探究构建的水青树核心种质资源库的策略,具有参考价值。同时构建的72份核心种质是有效的,为以后水青树种质资源的保护奠定了基础。
基于水青树叶表型性状的核心种质资源库构建策略
Construction Strategy of Core Collection Based on Leaf Phenotypic Traits of Tetracentron sinense
-
摘要:
目的 为了更好地构建水青树核心种质资源库,本文以161个水青树种质为试材,利用叶表型性状的遗传变异数据,对其构建方法进行了探索。 方法 首先,采用欧氏距离和瓦尔德法对所有个体进行逐步聚类;然后,设定10个取样比例(10%、15%、20%、25%、30%、35%、40%、45%、50%、55%),分别用随机取样策略、偏离度取样策略和位点优先取样策略筛选出与之对应的核心种质资源库。将这3种不同取样策略构建的核心种质资源库进行比较,从而筛选出最适种质资源。 结果 (1)三种取样策略中,位点优先取样法明显提高了其种质资源库的方差差异百分率(VD)、变异系数变化率(VR)和极差符合率(CR),且45%是最适合构建水青树核心种质资源库的比例;(2)对种质资源核心库不同数量性状进行t检验,其累计贡献率达到82%以上。 结论 在欧氏距离结合瓦尔德法聚类条件下,位点优先取样策略是构建水青树种质资源核心库的最佳方法。 Abstract:Objective To construct the core collection bank of Tetracentron sinense. Method Taking 161 germplasm of T. sinense as samples, the genetic variation data of leaf phenotypic characters of T. sinense were studied. First, the methods of Euclidean distance and Wald were used to cluster all individuals step by step. Second, 10 sampling ratios (10%, 15%, 20%, 25%, 30%, 35%, 40%, 45%, 50%, and 55%) were set, and then their core collection were screened by random sampling strategy, deviation sampling strategy and allele preferred sampling strategy. The germplasm resource banks constructed under different sampling strategies were compared and then the optimum core collection was screened out. Result (1) Among the three sampling strategies, the allele preferred sampling strategy significantly increased the percentage of variance difference (VD), the variation rate of coefficient of variation(VR) and the coincidence rate of range difference (CR) in core collection. 45% is the most suitable sampling ratio to construct core collection of T. sinense. (2) The t test for different quantitative characters of core collection showed that the cumulative contribution rate of core collection was higher than 82%. Conclusion The allele preferred sampling strategy is the most appropriate to construct the core collection of T. sinense with the methods of Euclidean distance and Wald. -
Key words:
- Tetracentron sinense
- / core collection
- / genetic distance
- / clustering method
- / sampling strategy
- / phenotypic traits
-
表 1 水青树各表型性状值
Table 1. The phenotypic traits values of T. sinense
变异系数
variable coefficient标准差
standard deviation平均值
mean方差
variance极差
range上表皮细胞数目Number of epidermal cells/个 0.43 52.53 122.92 2 758.94 355.68 气孔器数目Number of stmata/个 0.39 4.95 12.82 24.54 23.91 气孔器长The stomata length/μm 0.16 7.04 42.78 49.57 29.89 气孔器宽The stomata width/μm 0.18 6.54 35.64 42.81 25.25 上表皮细胞面积Upper epidermal cell area/μm2 0.40 734.99 1 835.44 540 208.74 3 181.18 上表皮细胞周长Perimeter of epidermal cells/μm 0.27 51.77 192.99 2 680.64 248.67 上表皮细胞弯曲度指数Upper epidermal cell curvature index 0.08 0.11 1.29 0.01 0.53 上表皮细胞密度Density of epidermal cells/(个·mm-2) 0.42 374.07 889.40 139 930.13 2 370.14 气孔器密度Stomatal density/(个·mm-2) 0.39 35.90 92.92 1 288.96 173.26 叶面积Leaf area/cm2 0.25 12.72 51.03 161.75 73.50 叶周长Leaf perimeter/cm 0.12 3.59 28.88 12.91 21.37 叶柄长Petiole length/cm 0.18 0.47 2.53 0.22 2.44 叶长Length of leaf/cm 0.14 1.39 9.80 1.93 12.37 叶最长The longest leaf/cm 0.14 1.51 11.10 2.30 8.64 叶宽Leaf width/cm 0.18 1.30 7.12 1.69 11.79 叶基Phyllo podium/cm 0.14 0.51 3.61 0.26 3.69 叶基尖削指数Leaf base sharpening index 0.20 0.27 1.34 0.07 2.84 叶先端尖削指数Leaf apex sharpening index 0.50 0.32 0.65 0.10 4.27 叶全长Leaf length/cm 0.12 1.54 12.35 2.36 11.46 叶形指数Leaf index 0.34 0.49 1.46 0.24 6.06  下载: 导出CSV
表 2 主成分分析
Table 2. Principal Component Analysis (PCA)
特征值
Eigenvalue贡献率/%
Contribution rate累积贡献率/%
Accumulating contribution rate1 7.598 33.036 33.036 2 5.959 25.910 58.946 3 3.614 15.715 74.661 4 1.747 7.595 82.257 5 1.250 5.436 87.692 6 0.652 2.836 90.528
下载: 导出CSV
表 3 随机取样的种质资源与原种质性状差异百分率
Table 3. Percentage difference between germplasm resources and original germplasm characters by random sampling strategy
种质资源库
Germplasm resources bank取样比例
Sampling ratio/%均值差异百分率
MD/%方差差异百分率
VD/%变异系数变化率
CR/%极差符合率
VR/%R1 10 1 21 50 85 R2 15 2 17 54 86 R3 20 2 16 58 87 R4 25 2 16 61 87 R5 30 0 19 64 86 R6 35 1 34 89 113 R7 40 0 26 89 110 R8 45 0 24 91 110 R9 50 0 19 91 108 R10 55 0 13 91 106
下载: 导出CSV
表 4 位点优先取样的种质资源与原种质性状差异百分率
Table 4. Percentage difference between the germplasm resources and the original germplasm characters sampled by allele preferred sampling strategy
种质资源库
Germplasm resources bank取样比例
Sampling ratio/%均值差异百分率
MD/%方差差异百分率
VD/%变异系数变化率
CR/%极差符合率
VR/%S1 10 1 73 82 47 S2 15 21 136 87 58 S3 20 1 80 88 58 S4 25 0 74 83 60 S5 30 0 71 82 60 S6 35 0 71 82 62 S7 40 0 71 82 66 S8 45 0 111 103 89 S9 50 0 109 103 92 S10 55 1 106 102 92
下载: 导出CSV
表 5 偏离度取样的种质资源与原种质性状差异百分率
Table 5. Percentage difference between germplasm resources and original germplasm characters sampled by deviation sampling
种质资源库
Germplasm resources bank取样比例
Sampling ratio/%均值差异百分率
MD/%方差差异百分率
VD/%变异系数变化率
CR/%极差符合率
VR/%D1 10 2 20 63 107 D2 15 2 7 66 101 D3 20 1 7 67 94 D4 25 0 10 68 92 D5 30 0 17 69 88 D6 35 0 16 70 88 D7 40 1 12 71 91 D8 45 0 22 91 109 D9 50 0 13 91 106 D10 55 0 13 93 106
下载: 导出CSV
表 6 3种取样策略下各参数值
Table 6. The values of each parameter under the three sampling strategies
核心种质资源库
Core collection极差
Range均值
Mean标准差
Standard deviation方差
Variance变异系数
Coefficient of variation均值差异百分率MD/% 方差差异百分率VD/% 变异系数变化率CR/% 极差符合率VR/% D8 251.59 147.51 53.93 27 856.49 0.27 0 22 91 109 R6 218.79 148.69 57.34 32 664.20 0.28 1 34 89 113 S8 260.66 149.40 52.74 28 184.87 0.25 0 111 103 89
下载: 导出CSV
表 7 比较构建的核心种质与原种质的不同性状
Table 7. To compare the characters of the core collection and the primary germplasm
编号
Code性状
Traits均值Mean 变异系数Coefficient of variation t值
t-value原种质
Primary germplasm核心种质
Core collection符合率
Coincidence rate原种质
Primary germplasm核心种质
Core collection符合率
Coincidence rate1 上表皮细胞数目Number of epidermal cells/个 122.92 116.05 0.94 0.43 0.36 0.85 0.98 2 气孔器数目Number of stomata/个 12.82 12.15 0.95 0.39 0.34 0.89 1.01 3 气孔器长The stomata length/μm 42.78 43.43 1.02 0.16 0.16 0.95 -0.65 4 气孔器宽The stomata width/μm 35.64 36.12 1.01 0.18 0.18 0.96 -0.52 5 上表皮细胞面积Upper epidermal cell area/μm2 1 835.44 1 953.04 1.06 0.40 0.38 0.95 -1.13 6 上表皮细胞周长Perimeter of epidermal cells/μm 192.99 200.12 1.04 0.27 0.25 0.93 -0.98 7 上表皮细胞弯曲度指数
Upper epidermal cell curvature index1.29 1.29 1.00 0.08 0.07 0.88 -0.42 8 上表皮细胞密度Density of epidermal cells/(个·mm-2) 889.40 840.96 0.95 0.42 0.36 0.86 0.97 9 气孔器密度Stomatal density/(个·mm-2) 92.92 88.03 0.95 0.39 0.34 0.89 1.01 10 叶面积Leaf area/cm2 51.03 51.50 1.01 0.25 0.24 0.95 -0.27 11 叶周长Leaf perimeter/cm 28.88 28.97 1.00 0.12 0.12 0.96 -0.17 12 叶柄长Petiole length/cm 2.53 2.53 1.00 0.18 0.18 0.96 0.08 13 叶长Length of leaf/cm 9.80 9.73 0.99 0.14 0.17 1.18 0.33 14 叶最长The longest leaf/cm 11.10 11.17 1.01 0.14 0.13 0.98 -0.35 15 叶宽Leaf width/cm 7.12 7.27 1.02 0.18 0.21 1.13 -0.78 16 叶基Phyllo podium/cm 3.61 3.65 1.01 0.14 0.14 1.00 -0.54 17 叶基尖削指数Leaf base sharpening index 1.34 1.35 1.01 0.20 0.25 1.23 -0.38 18 叶先端尖削指数Leaf apex sharpening index 0.65 0.68 1.05 0.50 0.70 1.40 -0.61 19 叶全长Leaf length/cm 12.35 12.29 1.00 0.12 0.14 1.09 0.26 20 叶形指数Leaf index 1.46 1.49 1.02 0.34 0.47 1.40 -0.39 注:t0.05=1.960,t0.01=2.576。
下载: 导出CSV
表 8 水青树原种质和构建的种质资源库的核心种质资源的主成分分析
Table 8. 8 Principal component analysis of the germplasm and the core collection resources in the germplasm bank of T. sinense
主成分
Principal component原种质The original germplasm 核心种质The core collection 特征值
Eigenvalue贡献率/%
Contribution rate累积贡献率/%
Accumulating contribution rate特征值
Eigenvalue贡献率/%
Contribution rate累积贡献率/%
Accumulating contribution rate1 7.598 33.036 33.036 7.214 31.365 31.365 2 5.959 25.910 58.946 5.752 25.008 56.373 3 3.614 15.700 74.661 4.355 18.935 75.308 4 1.747 7.596 82.257 1.853 8.058 83.366 5 1.250 5.435 87.692 0.766 3.832 87.435 6 0.652 2.836 90.528
下载: 导出CSV
-
[1] 傅立国, 金鉴明.中国植物红皮书[M].北京:科学出版社, 1992:590-591. [2] Wang Y F, Lai G F, Efferth T, et al. New glycosides from Tetracentron sinense and their cytotoxic activity[J]. Chemical Biodiversity, 2006, 3(9):1023-1030. doi: 10.1002/(ISSN)1612-1880 [3] 吴征镒.中国植物志(第一卷)[M].北京:科学出版社, 2004:125-126. [4] 罗靖德, 甘小洪, 贾晓娟, 等.濒危植物水青树种子的生物学特性[J].云南植物研究, 2010, 32(3):204-210. [5] Fu D Z, Bartholomew B.Tetracentron in Wu Z Y and Raven P H. Flora of China[M]. Beijing:Science Press, 1992, 590-591. [6] 吴小巧, 黄宝龙, 丁雨龙.中国珍稀濒危植物保护研究现状与进展[J].南京林业大学学报:自然科学版, 2004, 28(2):72-76. [7] 沈金雄, 郭庆元, 张秀荣, 等.中国芝麻种质资源的聚类分析[J].华中农业大学学报, 1995, 14(6):532-536. [8] Frankel O H.Genetic perspectives of germplasm conservation[J]In: Arber W, Llimensee K, Peacock W J, et al.Genetic Manipulation: Impact on Man and Society. Cambridge, UK: Cambridge University Press, 1984. [9] Frankel O H, Brown A H D.Current plant genetic resources-a critical appraisal[C]. In: Genetics: New Frontiers (vol. IV).New Delhi, India: Oxford and IBH Publishing, 1984. [10] Brown A H D.The case for core collections[M].In: Brown A H D, Frankel O H, Marshall R D, et al.The Use of Plant Genetic Resources.Cambridge, England: Cambridge Univ Press, 1989: 136-156. [11] 胡晋, 徐海明, 朱军.基因型值多次聚类法构建作物种质资源核心库[J].生物数学学报, 2000, 15(1):103-109. doi: 10.3969/j.issn.1001-9626.2000.01.016 [12] 胡晋.植物遗传资源核心库及其建立[J].种子, 1996(5):22-24. [13] 刘娟, 廖康, 曹倩, 等.利用表型性状构建新疆野杏种质资源核心种质[J/OL].果树学报, 2015, 32(5): 787-796. [14] 赵宁, 杨孟莉, 李继东, 等.基于ISSR标记的山茱萸种质资源库构建[J].农业生物技术学报, 2017, 25(4):579-587. [15] 胡建斌, 马双武, 王吉明, 等.基于表型性状的甜瓜核心种质构建[J].果树学报, 2013, 30(3):404-411. [16] 刘遵春, 张春雨, 张艳敏, 等.利用数量性状构建新疆野苹果核心种质的方法[J].中国农业科学, 2010, 43(2):358-370. doi: 10.3864/j.issn.0578-1752.2010.02.017 [17] 张捷, 张萍, 李勤霞.新疆野核桃核心种质的构建[J].果树学报, 2018, 35(2):168-176. [18] 李正宏, 邱英雄, 徐海明, 等.濒危植物种质资源库取样比率的蒙特卡罗模拟研究[J].浙江大学学报:农业与生命科学版, 2006, 32(4):455-459. [19] Heather M, Brain C M, Kim J.Determining the shade tolerance of American chestnut using morphological and physiological leaf para-meters[J].Forest Ecology and Management, 2009, 257:280-286. doi: 10.1016/j.foreco.2008.09.009 [20] 王英姿.灵石山不同海拔米槠林优势种叶片δ13C值与叶属性因子的相关性[J].生态学报, 2013, 33(10):3129-3137. [21] 刘小芬, 刘剑秋, 杨成梓.福建省不同居群轮叶蒲桃叶形态与表皮特征比较[J].亚热带植物科学, 2009, 38(2):33-40. doi: 10.3969/j.issn.1009-7791.2009.02.009 [22] 陆畅, 王芳, 张小平.不同地区青檀叶片的解剖及表皮特征的比较研究[J].植物科学学报, 2012, 30(4):337-351. [23] 倪书邦, 毛常丽, 吴裕, 等.云南保存橡胶树部分种质资源叶表型变异分析[J].东北林业大学学报, 2012, 40(3):32-35. doi: 10.3969/j.issn.1000-5382.2012.03.009 [24] 招礼军, 朱栗琼, 黄寿先, 等.不同种源鹅掌楸苗木叶解剖性状的遗传多样性[J].广西植物, 2014, 34(3):308-314. [25] 韦艳梅, 王凌晖, 曹福亮, 等.何首乌不同种源的叶性状变异及聚类分析[J].安徽农业科学, 2010, 38(32):18136-18139. doi: 10.3969/j.issn.0517-6611.2010.32.058 [26] 戚继忠.川榛分类等级的研究[J].南京林业大学学报, 1996, 20(2):72-75. [27] 田青, 曹致中, 张睿.基于数码相机和Auto CAD软件测定园林植物叶面积的简便方法[J].草原与草坪, 2008(3):25-28. doi: 10.3969/j.issn.1009-5500.2008.03.006 [28] Han H, Li S, Gan X, et al.Phenotypic diversity in natural populations of an endangered plant Tetracentron sinense[J]. Botanical Sciences, 2017, 95(2):283. doi: 10.17129/botsci.824 [29] 徐海明, 邱英雄, 胡晋, 等.不同遗传距离聚类和抽样方法构建作物种质资源库的比较[J].作物学报, 2004, 30(9):932-936. doi: 10.3321/j.issn:0496-3490.2004.09.016 [30] 李小胜, 陈珍珍.如何正确应用SPSS软件做主成分分析[J].统计研究, 2010, 27(8):105-108. doi: 10.3969/j.issn.1002-4565.2010.08.016 [31] 李自超, 张洪亮, 曹永生, 等.中国地方稻种资源初级种质资源库取样策略研究[J].作物学报, 2003, 29(1):20-24. doi: 10.3321/j.issn:0496-3490.2003.01.004 [32] 詹世雄, 曾宪威.植物核心种质构建方法的研究进展[J].中国农学通报, 2010, 26(3):279-282. [33] 刘子记, 牛玉, 朱婕, 等.苦瓜核心种质资源构建方法的比较[J].华南农业大学学报, 2017, 38(1):31-37. [34] Brown A H D.Collection:A practical approach to genetic resources management[J].Genome, 1989, 31:818-824. doi: 10.1139/g89-144 [35] Hu J, Zhu J, Xu H M.Methods of constructing core collection by stepwise cluster with three sampling strategies based on genotypic values of crops[J]. Theoretical and Applied Genetics, 2000, 101:264-268. doi: 10.1007/s001220051478 [36] 谢春平, 方彦, 方炎明.乌冈栎天然居群叶表型变异[J].四川农业大学学报, 2011, 29(2):191-198. doi: 10.3969/j.issn.1000-2650.2011.02.010 [37] Yonezawa K, Nomura T, Morishima H. Sampling strategies for use in straitified germplasm collections[A]. Core collections of plant genetic resources[C]. UK: John Wiley & Son, 1995: 35-54. [38] 曾杰, 郑海水, 甘四明, 等.广西西南桦天然居群的表型变异[J].林业科学, 2005, 41(2):59-65. doi: 10.3321/j.issn:1001-7488.2005.02.010 [39] 刘莹, 宁祖林, 王静, 等.板栗和锥栗天然同域居群的叶表型变异研究[J].武汉植物学研究, 2009, 27(5):480-488. doi: 10.3969/j.issn.2095-0837.2009.05.005 [40] 李珊, 甘小洪, 憨宏艳, 等.濒危植物水青树叶的表型性状变异[J].林业科学研究, 2016, 29(5):687-697. doi: 10.3969/j.issn.1001-1498.2016.05.010 -

 点击查看大图
计量
- 文章访问数: 4380
- HTML全文浏览量: 1612
- PDF下载量: 142
- 被引次数: 0
