


-
森林碳循环是陆地生态系统物质和能量循环的核心[1],但由于其受到气候变化、人类活动以及森林生长和退化的影响呈动态变化规律,导致碳通量模拟有较大的不确定性[2-4],所以不同区域和森林类型的碳通量精确模拟一直是科学家关注的重点[5]。净初级生产力(NPP)决定了植被对大气中的碳吸收率,是研究森林碳通量的关键指标[6-7]。目前模拟森林生产力主要应用参数模型和过程模型[8]。参数模型主要利用森林植被吸收的光合有效辐射(APAR)和光能利用率(ε)来估测森林生产力[9]。代表模型有:GLO-PEM[10]、CASA[11]、TURC[12]、MODIS MOD17 [13]、C-Fix[14]等。这类模型已在区域、国家尺度上得到了广泛应用[15-16]。但其存在一定的不足:(1)模型精度依赖于遥感数据质量;(2)不同类型森林植被光能利用率缺乏率定;(3)无法表征森林生态生理学机理。过程模型是建立在植被生长机理之上,可刻画森林植被碳循环全过程及其与土壤、大气的相互作用。代表模型有:TEM[17]、DEMETER[18]、CERTURY[19]、DOLY[20]、LSM[21]、BIOME1, 2, 3, 4[22]、IBIS[23]、SiB2[24]、BEPS[25]以及Biome-BGC[26]等。这类模型被认为机理过程复杂,模型参数化方案较繁琐,容易产生较大的不确定性。但Chiesi等[27]和Yan等[28]提出了基于遥感模型MODIS MOD17模型和过程模型(Biome-BGC)融合的方法,在一定程度上抑制了由于模型参数化方案带来的模拟结果不确定性,使模拟精度得到较大改善。气候条件是影响NPP变化的主要因子[29-34],分析主导气候因素对不同区域森林NPP的扰动也成为研究热点[35-36]。
本研究基于Yan等[28]优化后的MODIS MOD17和机理过程模型(Biome-BGC)耦合率定的模型参数,进行了参数的优化验证,对寒温带内蒙古大兴安岭地区2003—2012年森林NPP进行模拟和精度验证,并分析该地区森林NPP时空分布格局及其与气候因素的关系。
-
研究区选定在内蒙古大兴安岭地区,119° 36′~26″125° 24′10″ E,47° 03′ 26″~53° 20′ 00″ N。该区森林覆盖率79.56%,是我国东北地区重要的森林生态功能保障区,也是寒温带森林类型的典型代表。森林类型以兴安落叶松( Larix gemelinii (Rupr.) Kuzen)构成的明亮针叶林为主,优势树种为兴安落叶松,伴生白桦( Betula platylla Suk.),山杨( Polulus davidaana Dode in Bull.)、樟子松( Pinus sylvestris var. mongolica Litv.)、黑桦( Betula davurica Pall.)和蒙古栎( Quercus mongolica Fisch.ex Ledeb.)等。
-
获取了2003—2012年研究区的MODIS土地覆被类型年合成产品(MCD12Q1)(http://modis.gsfc.nasa.gov),空间分辨率为500 m。为保持与Biome-BGC模拟单元大小一致,将其尺度扩展到1 km(采用Albers投影,WGS-84坐标系,下同)。
-
2003—2012年的气象数据来自寒区旱区科学数据中心发布的中国区域高时空分辨率地面气象要素驱动数据集(空间分辨率为0.1°)。为保持与Biome-BGC模拟网格大小一致,利用Biome-BGC模型附带的山地气象插值模块(MTCLIM 4.3)将上述气象要素降尺度到1 km,提取了Biome-BGC模型运行所需要的气象数据,包括逐日最高温、最低温、日均温、降水、饱和水气压差、短波辐射和日照时数等。
-
土壤质地数据为生态过程模型Biome-BGC的重要输入参数,模型模拟过程中需逐网格输入砂土、粘土和粉土的百分比含量。本文所采用的土壤质地数据从中国科学院资源环境科学数据中心获得(http://www.resdc.cn),该数据是根据我国1:100万土壤类型图以及全国第二次土壤普查数据综合编制生成(空间分辨率为1 km)。
-
为验证Biome-BGC模型参数可行性及模拟结果的准确性,2013年8月,在内蒙古根河市设置方形样地(面积:45 m×45 m)18块,主要森林类型包括落叶松和白桦纯林、松桦混交林等。对样地进行每木检尺。并将样地内林木分为6个等级(5~10,10~15,15~20,20~25,25~30 cm,>30 cm),每个等级选取3株标准样木,在其胸径处沿东西、南北两个方向钻取树芯。此外,为验证火灾区域森林净初级生产力的预测精度,2016年8月还对该研究区受林火干扰较重的地方,设置45个圆形样地(半径15 m),并分别对样地中的树木按照上述方法钻取木芯。
野外获取的树芯称质量后风干,然后进行打磨修正,直到年轮清晰。采用WinDENDRO年轮分析仪测量得出年轮宽度,测量精度0.001 mm。利用COFECHA算法进行手动交叉定年,得到每株标准样木逐年胸径值。
基于样地调查的胸径、树高数据,拟合得到研究区主要树种兴安落叶松和白桦的树高-胸径函数关系,兴安落叶松树高方程: H =2.325 DBH0.648( R2=0.73)、白桦树高方程: H =2.618 DBH0.621( R2=0.67)。然后由逐年胸径数据计算每株标准木逐年树高。应用已有的兴安落叶松和白桦生物量模型计算生物量[37-38](表 1),根据兴安落叶松和白桦生物量与各组分含碳量的平均比值0.521 1和0.491 4[39],作为生物量与净初级生产力的转换系数,由此得到各样地的森林NPP,用于验证模型模拟结果。
表 1 兴安落叶松和白桦各组分生物量方程
Table 1. Biomass functions of Larix gemelinii and Betula platylla organs
组分 Organs 兴安落叶松 Larix gemelinii 白桦 Betula platylla 回归方程 Equation 相关系数 Coefficient 回归方程 Equation 相关系数 Coefficient 树干 Stem AGBS = 0.013 8( D2H )1.010 7 0.99 AGBS = 0.028 53( D2H )0.892 71 0.99 树枝 Branch AGBB = 0.000 8( D2H )1.127 2 0.98 AGBB = 0.002 78( D2H )1.025 68 0.99 树叶 Leaf AGBL = 0.002 29( D2H )0.365 9 0.94 AGBL = 0.015 45( D2H )0.612 65 0.98 树根 Root AGBR = 0.001 7( D2H )1.179 3 0.98 AGBR = 0.045 77( D2H )0.696 12 0.98 树皮 Bark AGBT = 0.026 01( D2H )0.720 6 0.99 AGBT = 0.023 92( D2H )0.711 31 0.99 -
Biome-BGC模型以Farquhar光合酶促反应机理[40]为基础,计算植被光合作用强度和GPP。已被广泛用于森林、草地、农田的生产力模拟[41-42]。Biome-BGC模型以日尺度为步长,可模拟多级时间尺度的森林植被生态系统GPP和NPP。在空间尺度上,其模拟的网格大小一般为1km(取决于可获取的输入参数,如气象因子,土壤质地因子等产品的空间分辨率)。Biome-BGC模型的驱动参数包括3个方面:初始化参数、气象因子和森林植被生理生态参数(44个)。初始化文件参数提供模型模拟的基本属性信息,如模拟网格(或站点)的海拔、土壤质地组成、有效土壤深度,模拟的时间跨度、CO2浓度、N沉降等;气象因子包括日尺度的最高、最低、平均温度,饱和水汽压差,降水量,短波辐射和日照时数;生理生态参数包括更新与死亡、分配参数,碳氮比,易分解质、纤维素、木质素的比例,叶片与冠层形态参数以及传导速率相关的参数等。
-
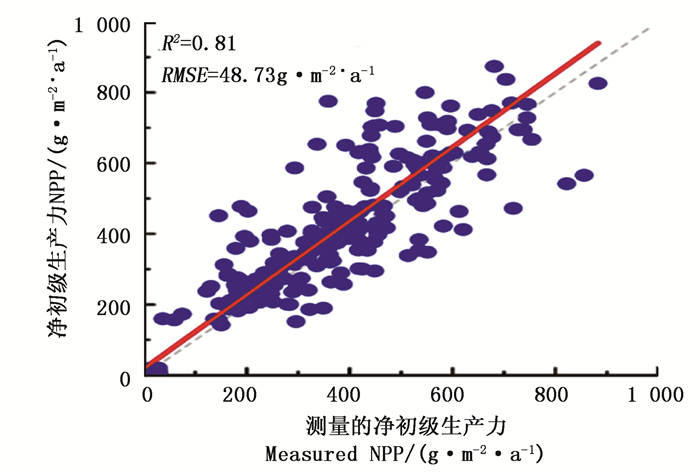
Biome-BGC模型生理生态参数优化应用模型-模型交叉率定法。本研究首先应用扩展的傅里叶幅度分析法(EFAST)对该研究区Biome-BGC模型的生理生态参数进行敏感性分析,根据以往研究得到的生理生态参数的概率密度分布生成样本[28],在此基础上运行Biome-BGC模型,计算得到内蒙古大兴安岭地区10年(2003~2012)的NPP值,输入到SimLab2.2中进行参数敏感性分析。将参数分为低敏感度(敏感度指数小于0.1)、中敏感度(0.1~0.2)和高敏感度(敏感度指数大于0.2)3个等级。然后将Biome-BGC模型中敏感度大于0.1的参数,针对该区特定植被类型(兴安落叶松和白桦)对敏感性参数进行校正。兴安落叶松林选取了30个森林样本点(样本个数:23层×5年×30个=3 450个),白桦林选取了10个森林样本点(样本个数:23层×5年×10个=1 150个),分别进行2003—2007年GPP的模拟。利用优化的MOD_17模型输出的森林样本点生长季的NPP拟合Biome-BGC模型对应生长季输出的NPP结果,拟合过程中不断调整生理生态参数,当两者拟合结果达到稳定时,得到文中该区域兴安落叶松和白桦的最优参数组合。其他敏感度低于0.1的参数采用模型默认值。然后基于木芯样品实测资料计算各样地NPP,与Biome-BGC参数优化后的模型进行精度验证,模拟效果较好, R2达0.81, RMSE 为48.73 g·m-2·a-1(图 1)。优化后的Biome-BGC模型适合预测内蒙古大兴安岭地区净初级生产力。

图 1 树轮数据推算NPP与模型模拟NPP值对比
Figure 1. Comparison of the tree ring calculated NPP with the simulated NPP
本研究基于Biome-BGC的4.3版本,利用初始化参数文件、研究区气象和土壤质地数据、以及在该区域应用经敏感性分析后模型-模型交叉率定的生理生态参数,对2003—2012年的内蒙古大兴安岭的森林植被净初级生产力(NPP)进行模拟。分析该区NPP的时空分布特点,并采用相关分析描述气象因素对其影响。
-
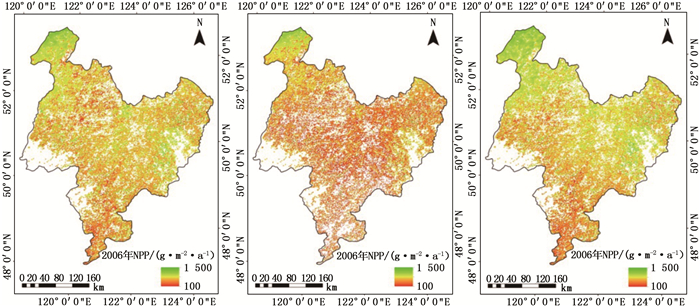
2003—2012年内蒙古大兴安岭地区森林NPP空间平均值呈不显著增长趋势,其中以2009年的最大(399.5 g·m-2·a-1),2007年的最小(219.3 g·m-2·a-1)(表 2)。从空间分布来看,该区森林NPP呈现北高南低,东部偏低的空间差异(图 2)。从该区森林NPP时空分布特征来看,火灾是影响内蒙古大兴安岭地区森林NPP空间分布差异的重要因素之一,如图 2中2006年内蒙古大兴安岭东部和中部以及2007年中部出现的范围较大的NPP低值区域,其分别是2006年松岭坎都河特大森林火烧迹地,以及2007年的松岭以及罕诺河管护区森林火灾区。天保工程是影响该区森林NPP空间分布差异的另一个重要因素,2012年额尔古纳市、根河市和牙克石市等森林NPP呈增长趋势,则是由于该区域全面贯彻落实“国家天然林保护工程”,开展了荒山造林、森林抚育等项目。
表 2 2003—2012年内蒙古大兴安岭地区森林NPP均值统计
Table 2. Statistical information of forest NPP averages over the Great Khinganin Inner Monolia from 2003 to 2012
年份 Year 2003 2004 2005 2006 2007 2008 2009 2010 2011 2012 NPP/(g·m-2·a-1) 334.2 264.3 278.5 296.9 219.3 244.9 399.5 228.8 322.4 333.4 
图 2 内蒙古大兴安岭地区2003—2012年森林NPP空间分布图
Figure 2. Spatial distribution of annual forest NPPs over the Great Khinganwithin the Inner Monolia from 2003 to 2012
-
根据该区的土地覆盖类型和森林NPP的平均值分别计算得到该区域针叶林、阔叶林和混交林的NPP区域平均值(表 3)。其中针叶林,阔叶林和混交林2009年的NPP区域平均值最大,分别为414.9,412.3,404.7 g·m-2·a-1,2007年的NPP区域平均值最小,分别为218.6,213.7,188.3 g·m-2·a-1,2003—2012年间不同森林类型的NPP空间平均值也呈不显著增长趋势。
表 3 2003—2012年内蒙古大兴安岭地区各森林类型NPP均值统计
Table 3. Statistics of NPP of different forest types over the Great Khingan within the Inner Monolia from 2003 to 2012
年份 Year 2003 2004 2005 2006 2007 2008 2009 2010 2011 2012 针叶林 Needle-leaf forest 349.0 274.2 286.4 312.5 218.6 263.3 414.9 238.1 341.4 351.9 阔叶林 Broad-leaf forest 348.0 277.7 291.6 309.9 213.7 256.4 412.3 232.5 339.3 348.1 混交林 Mixed forest 340.0 245.9 280.6 308.2 188.3 251.3 404.7 204.5 333.4 333.6 -
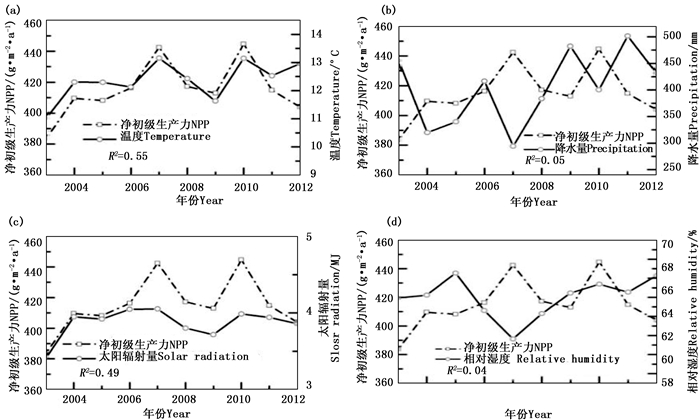
2003—2012年研究区生长季平均温度在11.02~13.15 ℃之间,温度的年际变化与生长季NPP的年际变化均呈上升趋势,相关性 R2达0.55(图 3(a));生长季太阳辐射量在3.41~4.05 MJ之间,变化较小,整体比较稳定,但与生长季NPP相关性较大, R2达0.49(图 3(c)所示);生长季总降水量与平均相对湿度分别在294.29~501.86 mm、59.64%~66.54%之间,整体均表现为上升趋势,但其变化趋势与年际的生长季植被NPP的变化不一致,且相关性较小, R2分别为0.05和0.04(图 3(b)(d)所示)。植被NPP的最低值出现在2003年,该年虽然降水充足、湿度适宜,但平均温度和太阳辐射均为历年最低;2007年的温度和辐射量都处于历年的最高值,但是降水偏少,相对湿度也较小,但是植被NPP却达到一个高值。综上所述,温度和太阳辐射是影响该区植被NPP变化的主要因子。
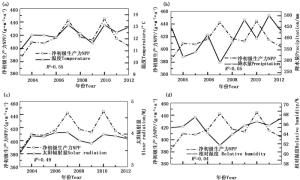
图 3 生长季NPP与平均温度(a)、总降水量(b)、总太阳辐射量(c)、平均相对湿度(d)的年际关系
Figure 3. Correlations between annual vegetation NPPs and annual average temperature (a), total precipitation (b), total solar radiation (c) and average relative humidity (d) over growing season
-
针叶林NPP值介于378.43~433.67 g·m-2·a-1,与温度和太阳辐射量的相关性较好, R2分别为0.41和0.30。而与降水量和相对湿度的相关性较差, R2分别为0.03和0.12。2007年由于温度和太阳辐射量都处于较高水平,NPP值达到了最高值。而2003年温度和太阳辐射量是10年来的最低值,NPP也为历年最低值(图 4)。阔叶林的植被NPP值也与温度和太阳辐射量的相关性较好, R2分别为0.56和0.22。而与降水量不相关,与相对湿度的相关系数仅为-0.02。2010年阔叶林的NPP值为10年间的最高值450.96 g·m-2·a-1,该年的温度也为历年最高值,太阳辐射也处于较高的值。2003年阔叶林的NPP值为10年间的最低值388.53 g·m-2·a-1,该年的温度和太阳辐射值均为历年的最低值(图 5)。混交林NPP的年际变化与温度和太阳辐射的年际变化情况基本一致,表现出较高的整体相关性( R2为0.66和0.63);而与降水量和相对湿度的相关性较低(图 5)。总体来看,该区各森林类型的NPP也主要受到温度和太阳辐射的影响。
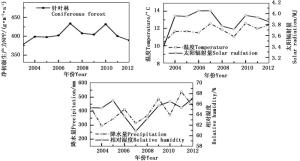
图 4 研究区针叶林生长季NPP与气候因子的年际变化
Figure 4. Interannual variation of needle-leaf forest NPP and climate factors during the growing season
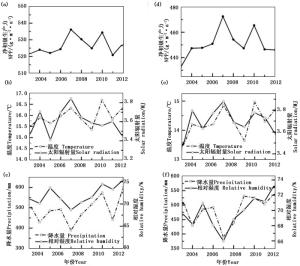
图 5 研究区阔叶林(a, b, c)和混交林(d, e, f)生长季NPP与气候因子的年际变异
Figure 5. Annual variation of broad-leaf (a, b, c) and mixed forests(d, e, f)' NPP and climate factors during the growing season
-
将优化的遥感模型和基于生态过程的机理模型相集成来模拟碳通量的时空变异,这种方法已被证明对热带森林和暖温带森林类型碳通量时空变异的估算是可靠的、有效的[28, 40]。但对寒温带针叶林碳通量的估算还有待验证。因此,本研究利用Yan等[28]基于优化后的参数模型MODIS MOD17模型与过程模型Biom-BGC模型耦合,采用研究区域样地数据经EFAST敏感性分析对过程模型参数进行校正,然后对该区长时间序列的森林NPP进行模拟,得到森林NPP经实测数据验证精度较高, R2为0.81, RMSE 为48.73 g·m-2·a-1,该模型能准确有效地模拟内蒙古大兴安岭地区不同森林类型NPP。但不同于前期Yan等[28]研究,本研究主要针对寒温带针叶林区森林NPP的模拟,并采用两次样地调查和树轮数据对模拟结果进行了验证。虽然未能获取到研究区的通量站点等观测资料进行模型验证,但采用的地面样点实测调查数据具有更多森林类型、多种干扰情景(火灾、抚育、择伐等)以及多生境条件等特点,且树轮数据验证相比于通量站点验证,具有较高的时空间连续性,大量的样本数据避免了数据的偶然性,可证实这种耦合方法率定的模型预测可靠性与全局代表性[41]。
在研究时段内, 温度和太阳辐射对该区森林NPP年际变化影响较大,相关系数R2达0.55和0.49,而降水和相对湿度对其影响较小。该区的各种森林类型(针叶林、阔叶林和混交林)对气候因素的响应与总森林NPP的一致。该结论也被许多研究证实,温度升高会导致NPP增加[42-43]。但曾慧卿等[44]对湿地松人工林NPP与气候因素关系时认为其主要受降水的影响,而与温度相关性较小。这可能由于研究地区处于不同的纬度带造成的,曾慧卿[44]的研究地点在北亚热带,该区域降水充沛,年平均降水量达1 487 mm,且年度间波动较大;而本研究的试验地在寒温带,年平均降水量仅300~450 mm,年间波动很小,导致降水对该区森林NPP影响较小。所以对于不同气候区来说,由于气候条件差异较大,森林NPP受到气候因素的驱动机制是不同的,这需要我们针对不同气候区域开展森林NPP的研究工作。
-
本研究利用优化率定后的生理生态过程模型Biome-BGC参数,模拟了内蒙古大兴安岭地区时间序列(2003—2012年)森林净初级生产力(NPP)。该区森林NPP的年变化量为219.3~399.5 g·m-2·a-1,其中针叶林NPP的年变化量在218.6~414.9 g·m-2·a-1、阔叶林为214.7~412.4 g·m-2·a-1、混交林为188.3~404.7 g·m-2·a-1。随时间变化呈现缓慢的增长趋势,年间变化中森林NPP的低值出现在林火发生的年份。研究区森林NPP呈现北高南低,东部偏低的空间分布格局,东部由于受森林火灾的影响,NPP均值较低。总体来看,火灾是造成该区森林NPP降低的主要因素。林思美等[45]也证实火后森林NPP会显著下降,平均降低的百分比为43%~80%。天保工程是影响该区森林NPP增加与空间分布差异的另一个重要因素,自实施天然林保护工程以来,该区森林面积净增67.45万hm2,森林质量由蓄积量86.6 m3·hm-2提高到97 m3·hm-2 [46]。天然林保护工程和火灾二者是造成了该区NPP呈现不同时空分布格局的主要因素。不同森林类型的NPP值差异较大,总体来看,大小依次为针叶林>阔叶林>混交林。温度和太阳辐射是寒温带针叶林区森林NPP年际变化的主导气候因素。
内蒙古大兴安岭森林净初级生产力时空格局分析
Analysis of Spatial-temporal Pattern of Forest Net Primary Productivity of the Great Khingan in Inner Mongolia
-
摘要:
目的 通过模型模拟分析内蒙古大兴安岭地区森林生产力时空分布格局及其驱动因子。 方法 利用优化率定后的生理生态过程模型Biome-BGC参数,模拟了内蒙古大兴安岭地区时间序列(2003—2012年)森林净初级生产力(NPP)。基于外业实测数据,在全区域尺度上进行NPP模拟结果验证。 结果 优化率定后的Biome-BGC模拟的该区森林NPP具有较高可靠性,实测数据验证 R2为0.81, RMSE 为48.73 g·m-2·a-1。2003—2012年间该区森林NPP为219.3~399.5 g·m-2·a-1,其中针叶林NPP为218.6~414.9 g·m-2·a-1、阔叶林为213.7~412.3 g·m-2·a-1、混交林为188.3~404.7 g·m-2·a-1。森林NPP与温度和太阳辐射的相关性较高( R2分别为0.55和0.49),与降水量和相对湿度的相关性较低。 结论 时间序列上该区森林NPP年平均值总体呈缓慢增长趋势;空间分布呈北高南低,东部偏低的特征。"天然林保护工程"的实施是该区森林NPP增加的主要因素,而火灾则降低了森林NPP,二者造成了该区NPP呈现时空差异;不同森林类型NPP差异主要受温度和太阳辐射的影响。 -
关键词:
- 净初级生产力
- / Biome-BGC模型
- / 时空格局
- / 气象驱动力
Abstract:Objective To analyze the spatial and temporal distribution patterns and driving factors of forest productivity in Daxing'anling of Inner Mongolia by model simulation. Method The optimized and calibrated physiological parameters of the ecological process model, the Biome-BGC, performed in a previous study were applied to simulate the long-term (from 2003 to 2012) forest net primary productivity (NPP) over the Daxing'anling region in Inner Mongolia. Based on forest dendrochronological measurements, the simulated NPPs were validated at a regional scale. Result The simulated forest NPPs from the calibrated Biome-BGC model had high reliability with R2=0.81 and RMSE =48.73 g·m-2·a-1. From 2003 to 2012, the forest NPP ranged from 219.3 to 399.5 g·m-2·a-1, of which coniferous forest NPP ranged from 218.6 to 414.9 g·m-2·a-1, broadleaved forest 213.7 to 412.3 g·m-2·a-1 and mixed forest 188.3 to 404.7 g·m-2·a-1 respectively. The correlation between forest NPP and temperature and solar radiation was higher ( R2 was 0.55 and 0.49), and the precipitation and relative humidity was lower. Conclusion In time series, the annual average of forest NPP in this area shows a slow growth trend, while the spatial distribution shows the characteristics of high in the north and low in the south and east. The implementation of "Natural Forest Conservation Project" is the main factor driving the increase of forest NPP in this area, while fire decreases forest NPP, which results in the spatial and temporal differences of NPP in this area. The differences of NPP in different forest types are mainly affected by temperature and solar radiation. -
Key words:
- NPP
- / Biome-BGC model
- / spatial-temporal pattern
- / meteorological driving force
-
图 1 树轮数据推算NPP与模型模拟NPP值对比
Figure 1. Comparison of the tree ring calculated NPP with the simulated NPP
图 2 内蒙古大兴安岭地区2003—2012年森林NPP空间分布图
Figure 2. Spatial distribution of annual forest NPPs over the Great Khinganwithin the Inner Monolia from 2003 to 2012
图 3 生长季NPP与平均温度(a)、总降水量(b)、总太阳辐射量(c)、平均相对湿度(d)的年际关系
Figure 3. Correlations between annual vegetation NPPs and annual average temperature (a), total precipitation (b), total solar radiation (c) and average relative humidity (d) over growing season
图 4 研究区针叶林生长季NPP与气候因子的年际变化
Figure 4. Interannual variation of needle-leaf forest NPP and climate factors during the growing season
图 5 研究区阔叶林(a, b, c)和混交林(d, e, f)生长季NPP与气候因子的年际变异
Figure 5. Annual variation of broad-leaf (a, b, c) and mixed forests(d, e, f)' NPP and climate factors during the growing season
表 1 兴安落叶松和白桦各组分生物量方程
Table 1. Biomass functions of Larix gemelinii and Betula platylla organs
组分 Organs 兴安落叶松 Larix gemelinii 白桦 Betula platylla 回归方程 Equation 相关系数 Coefficient 回归方程 Equation 相关系数 Coefficient 树干 Stem AGBS = 0.013 8( D2H )1.010 7 0.99 AGBS = 0.028 53( D2H )0.892 71 0.99 树枝 Branch AGBB = 0.000 8( D2H )1.127 2 0.98 AGBB = 0.002 78( D2H )1.025 68 0.99 树叶 Leaf AGBL = 0.002 29( D2H )0.365 9 0.94 AGBL = 0.015 45( D2H )0.612 65 0.98 树根 Root AGBR = 0.001 7( D2H )1.179 3 0.98 AGBR = 0.045 77( D2H )0.696 12 0.98 树皮 Bark AGBT = 0.026 01( D2H )0.720 6 0.99 AGBT = 0.023 92( D2H )0.711 31 0.99  下载: 导出CSV
表 2 2003—2012年内蒙古大兴安岭地区森林NPP均值统计
Table 2. Statistical information of forest NPP averages over the Great Khinganin Inner Monolia from 2003 to 2012
年份 Year 2003 2004 2005 2006 2007 2008 2009 2010 2011 2012 NPP/(g·m-2·a-1) 334.2 264.3 278.5 296.9 219.3 244.9 399.5 228.8 322.4 333.4
下载: 导出CSV
表 3 2003—2012年内蒙古大兴安岭地区各森林类型NPP均值统计
Table 3. Statistics of NPP of different forest types over the Great Khingan within the Inner Monolia from 2003 to 2012
年份 Year 2003 2004 2005 2006 2007 2008 2009 2010 2011 2012 针叶林 Needle-leaf forest 349.0 274.2 286.4 312.5 218.6 263.3 414.9 238.1 341.4 351.9 阔叶林 Broad-leaf forest 348.0 277.7 291.6 309.9 213.7 256.4 412.3 232.5 339.3 348.1 混交林 Mixed forest 340.0 245.9 280.6 308.2 188.3 251.3 404.7 204.5 333.4 333.6
下载: 导出CSV
-
[1] Liu S, Bondlamberty B, Hicke J A, et al . Simulating the impacts of disturbances on forest carbon cycling in North America:processes, data, models, and challenges[J]. Journal of Geophysical Research Biogeosciences, 2015, 116(G4):127-134. [2] 施志娟, 白彦锋, 孙睿, 等.杉木人工林伐后2种恢复模式碳储量的比较[J].林业科学研究, 2017, 30(2):214-221 [3] 余超, 王斌, 刘华, 等.中国森林植被净生产量及平均生产力动态变化分析[J].林业科学研究, 2014, 27(4):542-550 [4] Gray A N, Whittier T R. Carbon stocks and changes on Pacific Northwest national forests and the role of disturbance, management, and growth[J]. Forest Ecology and Management, 2014, 328:167-178. doi: 10.1016/j.foreco.2014.05.015 [5] Zhou T, Shi P, Jia G, et al . Nonsteady state carbon sequestration in forest ecosystems of China estimated by data assimilation[J]. Journal of Geophysical Research:Biogeosciences, 2013, 118(4):1369-1384. doi: 10.1002/jgrg.20114 [6] 方江平.西藏南伊沟林芝云杉林生物量与生产力研究[J].林业科学研究, 2012, 25(5):582-589. doi: 10.3969/j.issn.1001-1498.2012.05.007 [7] Piao S, Cui M, Chen A, et al . Altitude and temperature dependence of change in the spring vegetation green-up date from 1982 to 2006 in the Qinghai-Xizang Plateau[J]. Agricultural and Forest Meteorology, 2011, 151(12):1599-1608. doi: 10.1016/j.agrformet.2011.06.016 [8] Jorgensen W L, Gao J. Cis-trans energy difference for the peptide bond in the gas phase and in aqueous solution[J]. Journal of the American Chemical Society, 1988, 110(13):4212-4216. doi: 10.1021/ja00221a020 [9] Monteith J L. Solar radiation and productivity in tropical ecosystems[J]. Journal of Apply Ecology, 1972, 9(3):747-766. doi: 10.2307/2401901 [10] Prince S D. A model of regional primary production for use with coarse resolution satellite data[J]. International Journal of Remote Sensing, 1991, 12(6):1313-1330. doi: 10.1080/01431169108929728 [11] Potter C S, Randerson J T, Field C B, et al . Terrestrial ecosystem production:A process model based on global satellite and surface data[J]. Global Biogeochemical Cycles, 1993, 7(4):811-841. doi: 10.1029/93GB02725 [12] Ruimy A, Dedieu G, Saugier B. TURC:A diagnostic model of continental gross primary productivity and net primary productivity[J]. Global Biogeochemical Cycles, 1996, 10(2):269-285. doi: 10.1029/96GB00349 [13] Running S W, Glassy J M, Thornton P E. MODIS daily photosynthesis (PSN) and annual net primary production (NPP) product (MOD17) Algorithm Theoretical Basis Document[M]. Maryland. April, 1999. [14] Veroustraete F, Estimation of carbon mass fluxes over Europe using the C-Fix model and Euroflux data[J]. Remote Sensing of Environment, 2002, 83(3):376-399. doi: 10.1016/S0034-4257(02)00043-3 [15] Bonan G B. Sensitivity of a GCM simulation to inclusion of inland water surfaces[J]. Journal of Chemical Ecology, 1995, 8(11):2691-2704. [16] Fensholt R, Sandholt I, Stisen S, et al . Analysing NDVI for the African continent using the geostationary meteosat second generation SEVIRI sensor[J]. Remote Sensing of Environment, 2006, 101(2):212-229. doi: 10.1016/j.rse.2005.11.013 [17] Melillo J M, Mcguire A D, Kicklighter D W, et al . Global climate change and terrestrial net primary production[J]. Nature, 1993, 363(6426):234-240. doi: 10.1038/363234a0 [18] Foley J A. The sensitivity of the terrestrial biosphere to climatic change:A simulation of the Middle Holocene[J]. Global Biogeochemical Cycles, 1994, 8(4):505-525. doi: 10.1029/94GB01636 [19] Melillo J M. Terrestrial biotic responses to environmental change and feedbacks to climate[J]. Climate Change, 1995, 13(3):445-481. [20] Woodward F I, Smith T M, Emanuel W R. A global land primary productivity and phytogeography model[J]. Global Biogeochemical Cycles, 1995, 9(4):471-490. doi: 10.1029/95GB02432 [21] Haxeltine A, Prentice I C. BIOME3:An equilibrium terrestrial biosphere model based on ecophysiological constraints, resource availability, and competition among plant functional types[J]. Global Biogeochemical Cycles, 1996, 10(4):693-709. doi: 10.1029/96GB02344 [22] Foley, Simon, Gong, et al . A security model of dynamic labeling providing a tiered approach to verification[J]. Proceedings of the IEEE Symposium on Security & Privacy, 1996:142-153. [23] Sellers P J, Los S O, Tucker C J, et al . A revised land surface parameterization (SiB2) for atmospheric GCMS. Part Ⅱ:The generation of global fields of terrestrial biophysical parameters from satellite data.[J]. Journal of Climate, 1996, 9(4):706-737. doi: 10.1175/1520-0442(1996)009<0706:ARLSPF>2.0.CO;2 [24] Liu J, Chen J M, Cihlar J, et al . A process-based boreal ecosystem productivity simulator using remote sensing inputs[J]. Rem Sens Environ, 1997, 62(2):158-175. doi: 10.1016/S0034-4257(97)00089-8 [25] Thornton P E, Law B E, Gholz H L, et al . Modeling and measuring the effects of disturbance history and climate on carbon and water budgets in evergreen needleleaf forests[J]. Agricultural & Forest Meteorology, 2002, 113(1-4):185-222. [26] Chiesi M, Maselli, Moriondo, et al . Application of BIOME-BGC to simulate Mediterranean forest processes[J]. Ecological Modelling, 2007, 206(1):179-190. [27] Chiesi M, Fibbi L, Genesio L, et al . Integration of ground and satellite data to model Mediterranean forest processes[J]. International Journal of Applied Earth Observation & Geoinformation, 2011, 13(3):504-515. [28] Yan M, Tian X, Li Z Y, et al . A long-term simulation of forest carbon fluxes over the Qilian Mountains[J]. International Journal of Applied Earth Observations & Geoinformation, 2016, 52:515-526. [29] Lu L, Li X, Veroustraete F, et al . Analysing the forcing mechanisms for net primary productivity changes in the Heihe River Basin, north-west China[J]. International Journal of Remote Sensing, 2009, 30(3):793-816. doi: 10.1080/01431160802438530 [30] 刘世荣, 徐德应, 王兵.气候变化对中国森林生产力的影响Ⅱ.中国森林第一性生产力的摸拟[J].林业科学研究, 1994, 7(4):425-430 doi: 10.3321/j.issn:1001-1498.1994.04.011 [31] 刘世荣, 徐德应, 王兵.气候变化对中国森林生产力的影响Ⅰ.中国森林现实生产力的特征及地理分布格局[J].林业科学研究, 1993, 6(6):633-642 doi: 10.3321/j.issn:1001-1498.1993.06.009 [32] Pan Y, Birdsey R A, Fang J, et al . A large and persistent carbon sink in the world's forests[J]. Science, 2011, 333(6045):988-993. doi: 10.1126/science.1201609 [33] Tian X. Modeling of forest above-Ground biomass and evapotranspiration[D]. Enschede: University of Twente, 2015. [34] Ouyang S, Wang X, Wu Y, et al . Contrasting responses of net primary productivity to inter-annual variability and changes of climate among three forest types in northern China[J]. Journal of Plant Ecology, 2014, 7(3):309-320. doi: 10.1093/jpe/rtt066 [35] Berthelot M, Friedlingstein P, Ciais P, et al . How uncertainties in future climate change predictions translate into future terrestrial carbon flux[J]. Global Change Biology, 2010, 11(6):959-970. [36] Zhang G, Kang Y, Han G, et al . Effect of climate change over the past half century on the distribution, extent and NPP of ecosystems of Inner Mongolia[J]. Global Change Biology, 2011, 17(1):377-389. doi: 10.1111/j.1365-2486.2010.02237.x [37] 吴刚, 冯宗炜.中国寒温带-温带落叶松林群落生物量的研究概述[J].东北林业大学学报, 1995, 23(1):95-101. [38] 董利虎, 李凤日, 贾炜玮, 等.含度量误差的黑龙江省主要树种生物量相容性模型[J].应用生态学报, 2011, 22(10):2653-2661. [39] 代武君.大兴安岭典型林分生物量生产力研究[D].哈尔滨: 东北林业大学, 2015 [40] Farquhar G D, Von C S, Berry J A. A biochemical model of photosynthetic CO2 assimilation in leaves of C3 species[J]. Planta, 1980, 149(1):78-90. doi: 10.1007/BF00386231 [41] 张瑜.黄土高原降水梯度带典型植物适宜盖度空间分布特征[D].西安: 西北农林科技大学, 2014. [42] 方超.模拟升温和氮沉降对黄土髙原半干旱区苜蓿草地净初级生产力和土壤呼吸的影响[D].兰州: 兰州大学, 2015. [43] Maselli F, Chiesi M, Fibbi L, et al . Integration of remote sensing and ecosystem modelling techniques to estimate forest net carbon uptake[J]. International Journal of Remote Sensing, 2008, 29(8):2437-2443. doi: 10.1080/01431160801894857 [44] Raich J W, Rastetter E B, Melillo J M, et al . Potential Net Primary Productivity in South America:Application of a Global Model[J]. Ecological Applications, 1991, 1(4):399-429.. doi: 10.2307/1941899 [45] 闫淑君, 洪伟, 吴承祯, 等.福建近41年气候变化对自然植被净第一性生产力的影响[J].山地学报, 2001, 19(6).227-231. [46] Su H X, Sang W G. Simulations and analysis of netprimary productivity in Quercus liaotungensis forest of Donglingshan Mountain range in response to different climate change scenarios[J]. Acta Botanica Sinica, 2004, 46(11):1281-1291. [47] 曾慧卿, 刘琪璟, 冯宗炜, 等.基于BIOME-BGC模型的红壤丘陵区湿地松( Pinus elliottii )人工林GPP和NPP[J].生态学报, 2008, 1(11):5314-5321. doi: 10.3321/j.issn:1000-0933.2008.11.013 [48] 林思美, 黄华国.基于3PGS-MTCLIM模型模拟根河林区火后植被净初级生产力恢复及其影响因子[J].应用生态学报, 2018, 29(11):3712-3722. [49] 李政源.内蒙古大兴安岭林区天保工程建设成效分析[J].内蒙古林业调查设计, 2012(2):12-13. doi: 10.3969/j.issn.1006-6993.2012.02.005 -

 点击查看大图
计量
- 文章访问数: 4365
- HTML全文浏览量: 2326
- PDF下载量: 108
- 被引次数: 0
