


-
湿地松(Pinus elliottii Engelmann)为速生常绿乔木,原产于美国南部[1],是优良的绿化和经济树种。湿地松抗旱、耐涝、耐瘠,具有良好的适应性和抗逆力。其根系发达,易育苗造林,早期生长迅速。该树种松脂产量高,经加工后可得到松节油、松香等产品,用途广泛[2]。我国引种始于20世纪30年代,目前人工林面积超过200万hm2,已成为南方丘陵地区的主要造林树种之一[3]。
松脂是一种可再生资源,我国松香年产量占世界的1/3,居世界第一位[4]。近年来,采脂对林分生长和木材材性的影响备受关注[5]。研究发现,采脂对林分材积生长和林分生长有抑制作用[6-8],但也有研究表明采脂对松树胸径生长有积极影响[9]。另外,采脂强度与胸径生长相关,当采脂强度超过60%时,显著抑制松树胸径生长[10]。目前关于湿地松的采脂研究主要集中在其对胸径生长、材积生长和树高生长的影响,而采脂对湿地松基本密度和力学性能的影响研究较少。徐慧兰等[5]对湿地松幼林采脂的研究表明,采脂导致基本密度和力学性能等材性指标不同程度的降低。Jim等[11]认为木材中的树脂的缺失可轻微降低部分材性强度。
木材基本密度是决定木材性能最重要的因素之一,直接影响木材强度和木材质量,是研究木材材性利用与木材培育相关性的常用指标[12]。木质素是植物体内仅次于纤维素的第二大有机物质,化学结构中含有羰基、羧基、甲氧基和酚羟基等官能团,已成为生物基新材料开发中的候补材料[13-15]。木质素主要位于纤维素与纤维之间,可起抗压作用和增强植物体机械强度,利于抵御外界不良环境,另外木质素也可作为输导组织,利于水分运输[16]。研究采脂对湿地松不同部位木材基本密度和木质素含量的影响,对科学确定木材加工工艺、提高产品质量具有重要意义。
体积法是测量木材基本密度的传统方法,这种方法在一定程度上损伤树干,且不利于大规模的木材密度测定的实施。近年来,通过针刺仪[17-19]间接测量木材基本密度逐渐成为无损评估的方法之一。Resistograph记录在钻入过程中相对应的阻力值和推进深度,通过所得曲线图,可间接估算木材密度、各年轮宽度和去皮直径[17, 20]。Resistograph具有便携和自动保存测定数据的优点,为野外大规模测量提供了可能[19]。因此,本试验以不同采脂年限的湿地松为材料,结合Resistograph对不同采脂年限的湿地松基本密度和木质素含量进行估测和对比研究,旨在为不同采脂年限湿地松基本密度和木质素含量的测定建立高效、稳定且便捷的方法,探析采脂对其采脂部位、树干基部的木材基本密度和木质素含量产生的影响,为湿地松遗传改良和资源科学利用提供参考。
-
湿地松试验林位于安徽省宣城市泾县琴溪镇(30°68′ N,118°41′ E),2000年春季造林,株行距为2 m×3 m,种苗为自由授粉种子园混合苗,在林分年龄12、14、17 a左右分区块使用下降式V型割脂法割脂,采脂强度为60%,割脂的单株此后每年继续割脂。试验地海拔高度80~180 m,属于北亚热带、副热带季风湿润性气候,年平均气温15.7℃。年降水量1600 mm,相对湿度84%,土壤为黄壤土,土层厚度为50~100 cm。
-
对相同林龄(20 a)的4个不同采脂年限进行样品采集,分别为连续采脂8、6、3、0 a的湿地松。每组选定15株标准木,共采取60株。用直径14 mm的电动生长锥(坎特伯雷大学林学院,新西兰)分别在树干基部(未采脂)和采脂部位(胸径采脂处)自南向北钻取穿过髓心的木芯并收集木屑。剔除由于操作不当引起的异常指标值,共得到57株用于数据分析,其中12株为采脂8 a的湿地松,其余3个采脂年限均为15株。
-
将每株采集的木芯和木屑放于烘箱中80℃烘干至恒质量,测定每个木芯烘干后质量,用旋风粉粹机将木屑粉粹成粉末,过40目筛并做好标记,置于干燥器皿中备用。采用齐一生物科技有限公司(上海)的木质素含量试剂盒测定木质素含量(mg·g− 1),具体步骤严格按照说明书操作。
-
木芯采集后,首先利用排水法测定木材基本密度。试样放在烘箱烘干至恒质量,称质量(m)。木芯浸水处理48 h,每隔一段时间测定木芯质量,直至木芯质量恒定,以确保木芯含水量达到饱和状态。将待测的试样插在针上,并浸没于水中,试样不与容器的壁和底相接触,试样排水所占体积即为试样体积(V)。基本密度(ρ)= 质量(m)/ 体积(V)。
-
采用Resistograph-IML-RESI树木针刺仪(PD500,德国)在每株树木的树干基部和采脂部位(胸高处)垂直主干自南向北进行测定,测定时探针经过髓心透过树干。钻针推进速度为150 cm·min− 1,转速为2500 r·min− 1,探针直径1.5 mm。探针每0.1 mm记录钻进深度值及对应阻力值(用振幅百分数表示)。用仪器自带的PDToolsPro软件将测定结果导入Excel 2019。
由于湿地松早晚材密度不同,形成峰谷现象,相邻两个峰之间为1 a生长周期[21](图1)。因此可以认为波峰间的钻进深度为当年的年轮宽度,波峰间的振幅均值可作为密度指数。收集数据时,去除外围树皮的不规则波动,选择可明显看出树干的髓心、起止点和年轮处阻力峰值的数据,以髓心以南(起点方向)测得数据为最终分析数据。第1年的数据不能被准确测出,统计树龄20 a到2 a的年轮数据。每株Resistograph数据包括19 a的每年年轮宽度均值(RE)、每年年轮振幅均值(AE)、每株年轮宽度均值(RM)和每株年轮振幅均值(AM)。
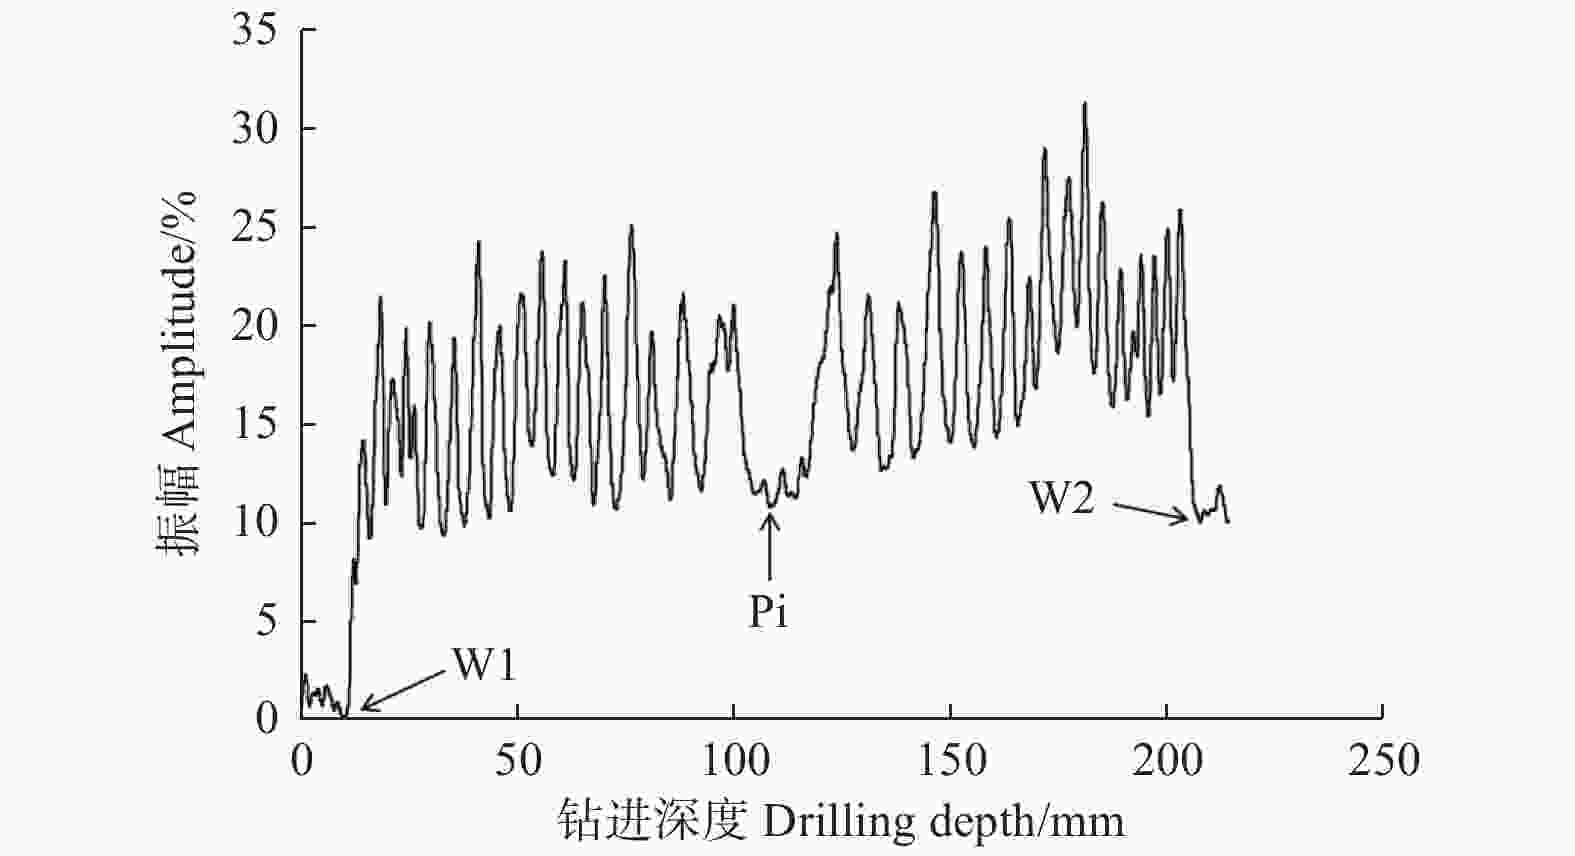
图 1 Resistograph测定的湿地松木材振幅(阻力)曲线
Figure 1. Amplitude (resistance) curves of P. elliottii wood measured by Resistograph
-
利用R语言对Resistograph数据进行循环统计,采用SPSS 22.0对各性状和指标值进行方差分析和对比分析,并用Excel 2019和R语言的ggplot2[22]包进行制图等。
-
57株20年生湿地松的生长锥、Resistograth测定值如表1所示,12株采脂8 a、15株采脂6 a、15株采脂3 a、15株采脂0 a的湿地松采脂部位的ρ均值分别为0.53、0.50、0.56、0.51 g·cm− 3,变异系数分别为8.68%、5.95%、11.15%、6.58%。树干基部的ρ均值分别为0.48、0.48、0.55、0.53 g·cm− 3,变异系数分别为7.21%、7.16%、9.64%、8.51%。采脂部位的RE分别为4.57、4.70、4.25、4.26 mm,变异范围分别为3.65~5.50、3.53~5.67、3.25~6.05、2.83~5.41 mm,每年的胸径增长约为每年年轮宽度均值的2倍,即9.14、9.40、8.50、8.52 mm。采脂部位AM和AE的平均值相同,分别为19.69%、16.58%、19.97%、16.47%,树干基部AM和AE的平均值相同,分别为18.13%、14.57%、19.00%、16.91%。由变异系数可知,采脂8、6、3、0 a湿地松采脂部位和树干基部的AM的变异系数大部分接近20%,比AE的变异系数超出10%以上,显示ρ变异更多存在于单株间,单株内不同年龄间的平均变异相对较小;同时,采脂部位的RM变异系数接近20%,大于RE的变异系数,表明胸径的单株变异大于每年增长变异。
表 1 采脂8、6、3、0 a湿地松采脂部位和树干基部的生长锥、Resistograth测定值
Table 1. Measured values of growth cones and Resistograth of different rossing parts and stem base of P. elliottii for 8, 6, 3 and 0 years
采脂年限
Rossing fixed
number of year /a不同部位
Different parts性状
Traits均值
Mean最大值
Maximum最小值
Minimum标准差
Standard deviation变异系数
Coefficient of
variation /%8 采脂部位
Rossing parts基本密度ρ
Basic density/(g·cm−3)0.53 0.62 0.47 0.05 8.68 Resistograph 测定值
Resistograph measurement valueAE/% 19.69 21.94 16.66 1.61 8.18 AM/% 19.69 27.31 12.94 4.60 23.36 RE/mm 4.57 5.50 3.65 0.56 12.25 RM/mm 4.57 5.69 3.51 0.77 16.85 树干基部
Stem base基本密度ρ
Basic density/(g·cm−3)0.48 0.53 0.42 0.03 7.21 Resistograph 测定值
Resistograph measurement valueAE/% 18.13 19.37 15.70 0.85 4.69 AM/% 18.13 24.40 10.18 3.42 18.86 RE/mm 5.06 6.56 3.40 0.90 17.79 RM/mm 5.06 6.57 3.90 0.94 18.58 6 采脂部位
Rossing parts基本密度ρ
Basic density/(g·cm−3)0.50 0.55 0.45 0.03 5.95 Resistograph 测定值
Resistograph measurement valueAE/% 16.58 18.56 12.36 1.36 8.20 AM/% 16.59 25.13 10.19 3.77 22.72 RE/mm 4.70 5.67 3.53 0.63 13.40 RM/mm 4.70 6.72 3.02 1.06 22.55 树干基部
Stem base基本密度ρ
Basic density/(g·cm−3)0.48 0.53 0.43 0.03 7.16 Resistograph 测定值
Resistograph measurement valueAE/% 14.57 16.65 10.71 1.60 10.98 AM/% 14.57 19.09 8.83 3.28 22.51 RE/mm 5.34 7.15 3.47 0.98 18.35 RM/mm 5.34 6.52 3.26 0.86 16.10 3 采脂部位
Rossing parts基本密度ρ
Basic density/(g·cm−3)0.56 0.69 0.48 0.06 11.15 Resistograph 测定值
Resistograph measurement valueAE/% 19.97 22.46 14.82 1.81 9.06 AM/% 19.97 25.90 16.40 2.69 13.47 RE/mm 4.25 6.05 3.25 0.79 18.59 RM/mm 4.25 5.69 2.96 0.77 18.12 树干基部
Stem base基本密度ρ
Basic density/(g·cm−3)0.55 0.62 0.46 0.05 9.64 Resistograph 测定值
Resistograph measurement valueAE/% 19.00 20.32 14.95 1.26 6.63 AM/% 19.01 26.00 13.47 3.15 16.57 RE/mm 4.91 6.69 3.71 0.81 16.50 RM/mm 4.91 6.38 3.39 0.76 15.48 0 采脂部位
Rossing parts基本密度ρ
Basic density/(g·cm−3)0.51 0.58 0.46 0.03 6.58 Resistograph 测定值
Resistograph measurement valueAE/% 16.47 18.25 13.95 1.13 6.86 AM/% 16.47 23.19 13.03 2.31 14.03 RE/mm 4.26 5.41 2.83 0.72 16.90 RM/mm 4.26 5.34 3.02 0.81 19.01 树干基部
Stem base基本密度ρ
Basic density/(g·cm−3)0.53 0.66 0.47 0.05 8.51 Resistograph 测定值
Resistograph measurement valueAE/% 16.91 19.75 12.62 1.46 8.63 AM/% 16.91 25.52 10.96 3.51 20.76 RE/mm 4.73 6.49 2.79 1.00 21.14 RM/mm 4.73 6.42 3.77 0.82 17.34 -
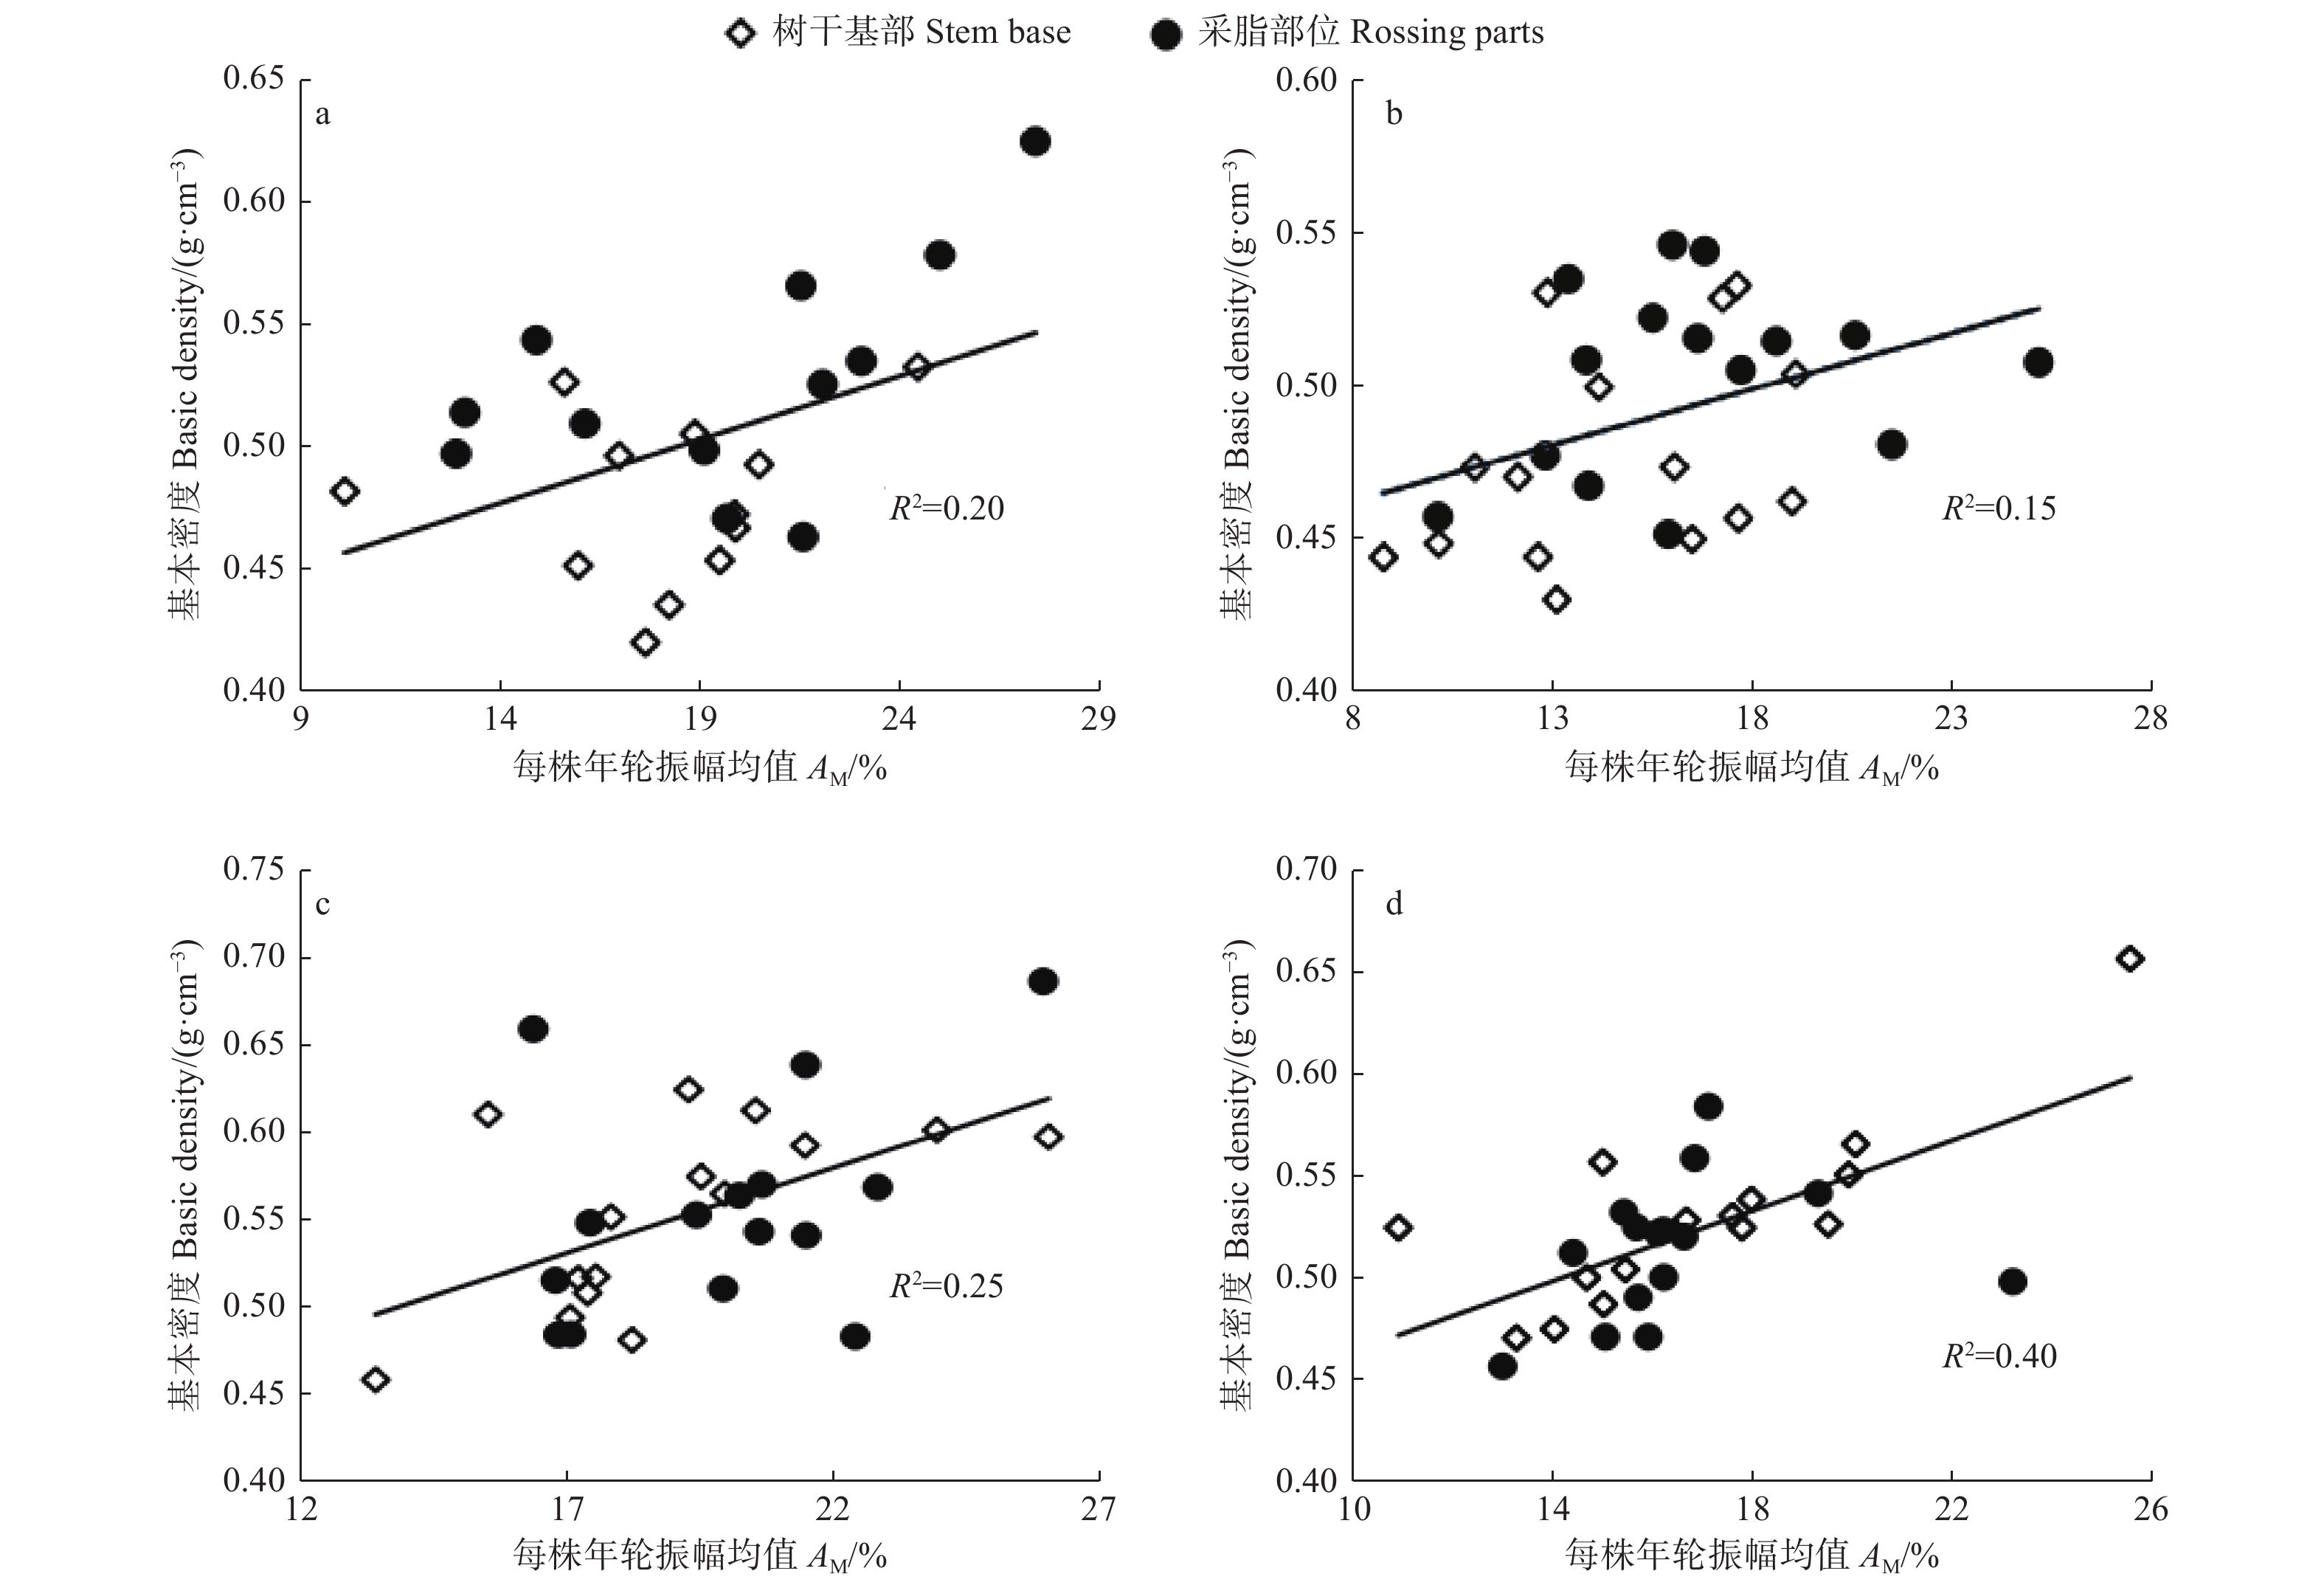
采脂8、6、3、0 a的木材ρ与AM的相关系数分别为0.45、0.39、0.50、0.63,均呈显著正相关或极显著正相关(图2)。因此,Resistograth可用于预测不同采脂年限的湿地松单株的ρ,并建立预测方程。利用 Resistograph的AM预测ρ的线性回归方程分别为ρ = 0.0052AM + 0.4044(R = 0.45,P < 0.05,df = 23)、ρ = 0.0037AM + 0.4321(R = 0.39,P < 0.05,df = 29)、ρ = 0.0098AM + 0.3650(R = 0.50,P < 0.01,df = 29)、ρ = 0.0086AM + 0.3774(R = 0.63,P < 0.01,df = 29)。

图 2 不同采脂时间长度采脂8、6、3、0 a的采脂部位、树干基部不同部位的基本密度(ρ)与AM值的相关分析
Figure 2. Correlation analysis of basic density(ρ) and AM values of the rossing parts
采脂8、6、3、0 a湿地松的采脂部位、树干基部的ρ和Resistograth测定值的RM进行Pearson相关性分析,结果显示:未采脂和采脂8 a湿地松的ρ与RM不相关,采脂3、6 a的ρ与RM的相关系数分别为0.39(P < 0.05,df = 29)、−0.46(P < 0.01,df = 29);ρ和RE不相关,这可能与环境条件、采脂造成其后期生长过程中ρ和RE发生变化有关。
-
对不同采脂年限湿地松ρ与Resistograph测定值的AE进行相关性分析可以看出,ρ与AE绝大部分都呈正相关,仅采脂8 a树龄为16~17 a和采脂3 a树龄为13 a的相关系数为负值,且呈不显著相关(P > 0.05)。其中,采脂8 a与树龄为1、4、5 a为极显著相关(P < 0.01,df = 23),3、10、13 a为显著相关(P < 0.05,df = 23);采脂6 a树龄为14、16 a呈显著相关(P < 0.05,df = 29);采脂3 a树龄为1~5、8 a为极显著相关(P < 0.01,df = 29),6、7、9、10 a为显著相关(P < 0.05,df = 29);未采脂的树龄为8、10~19 a呈极显著正相关,其余均为不显著相关(图3)。可见ρ与各年轮振幅的平均值的相关系数R呈显著或极显著正相关,在一定程度上解释了ρ和AM呈正相关的原因。
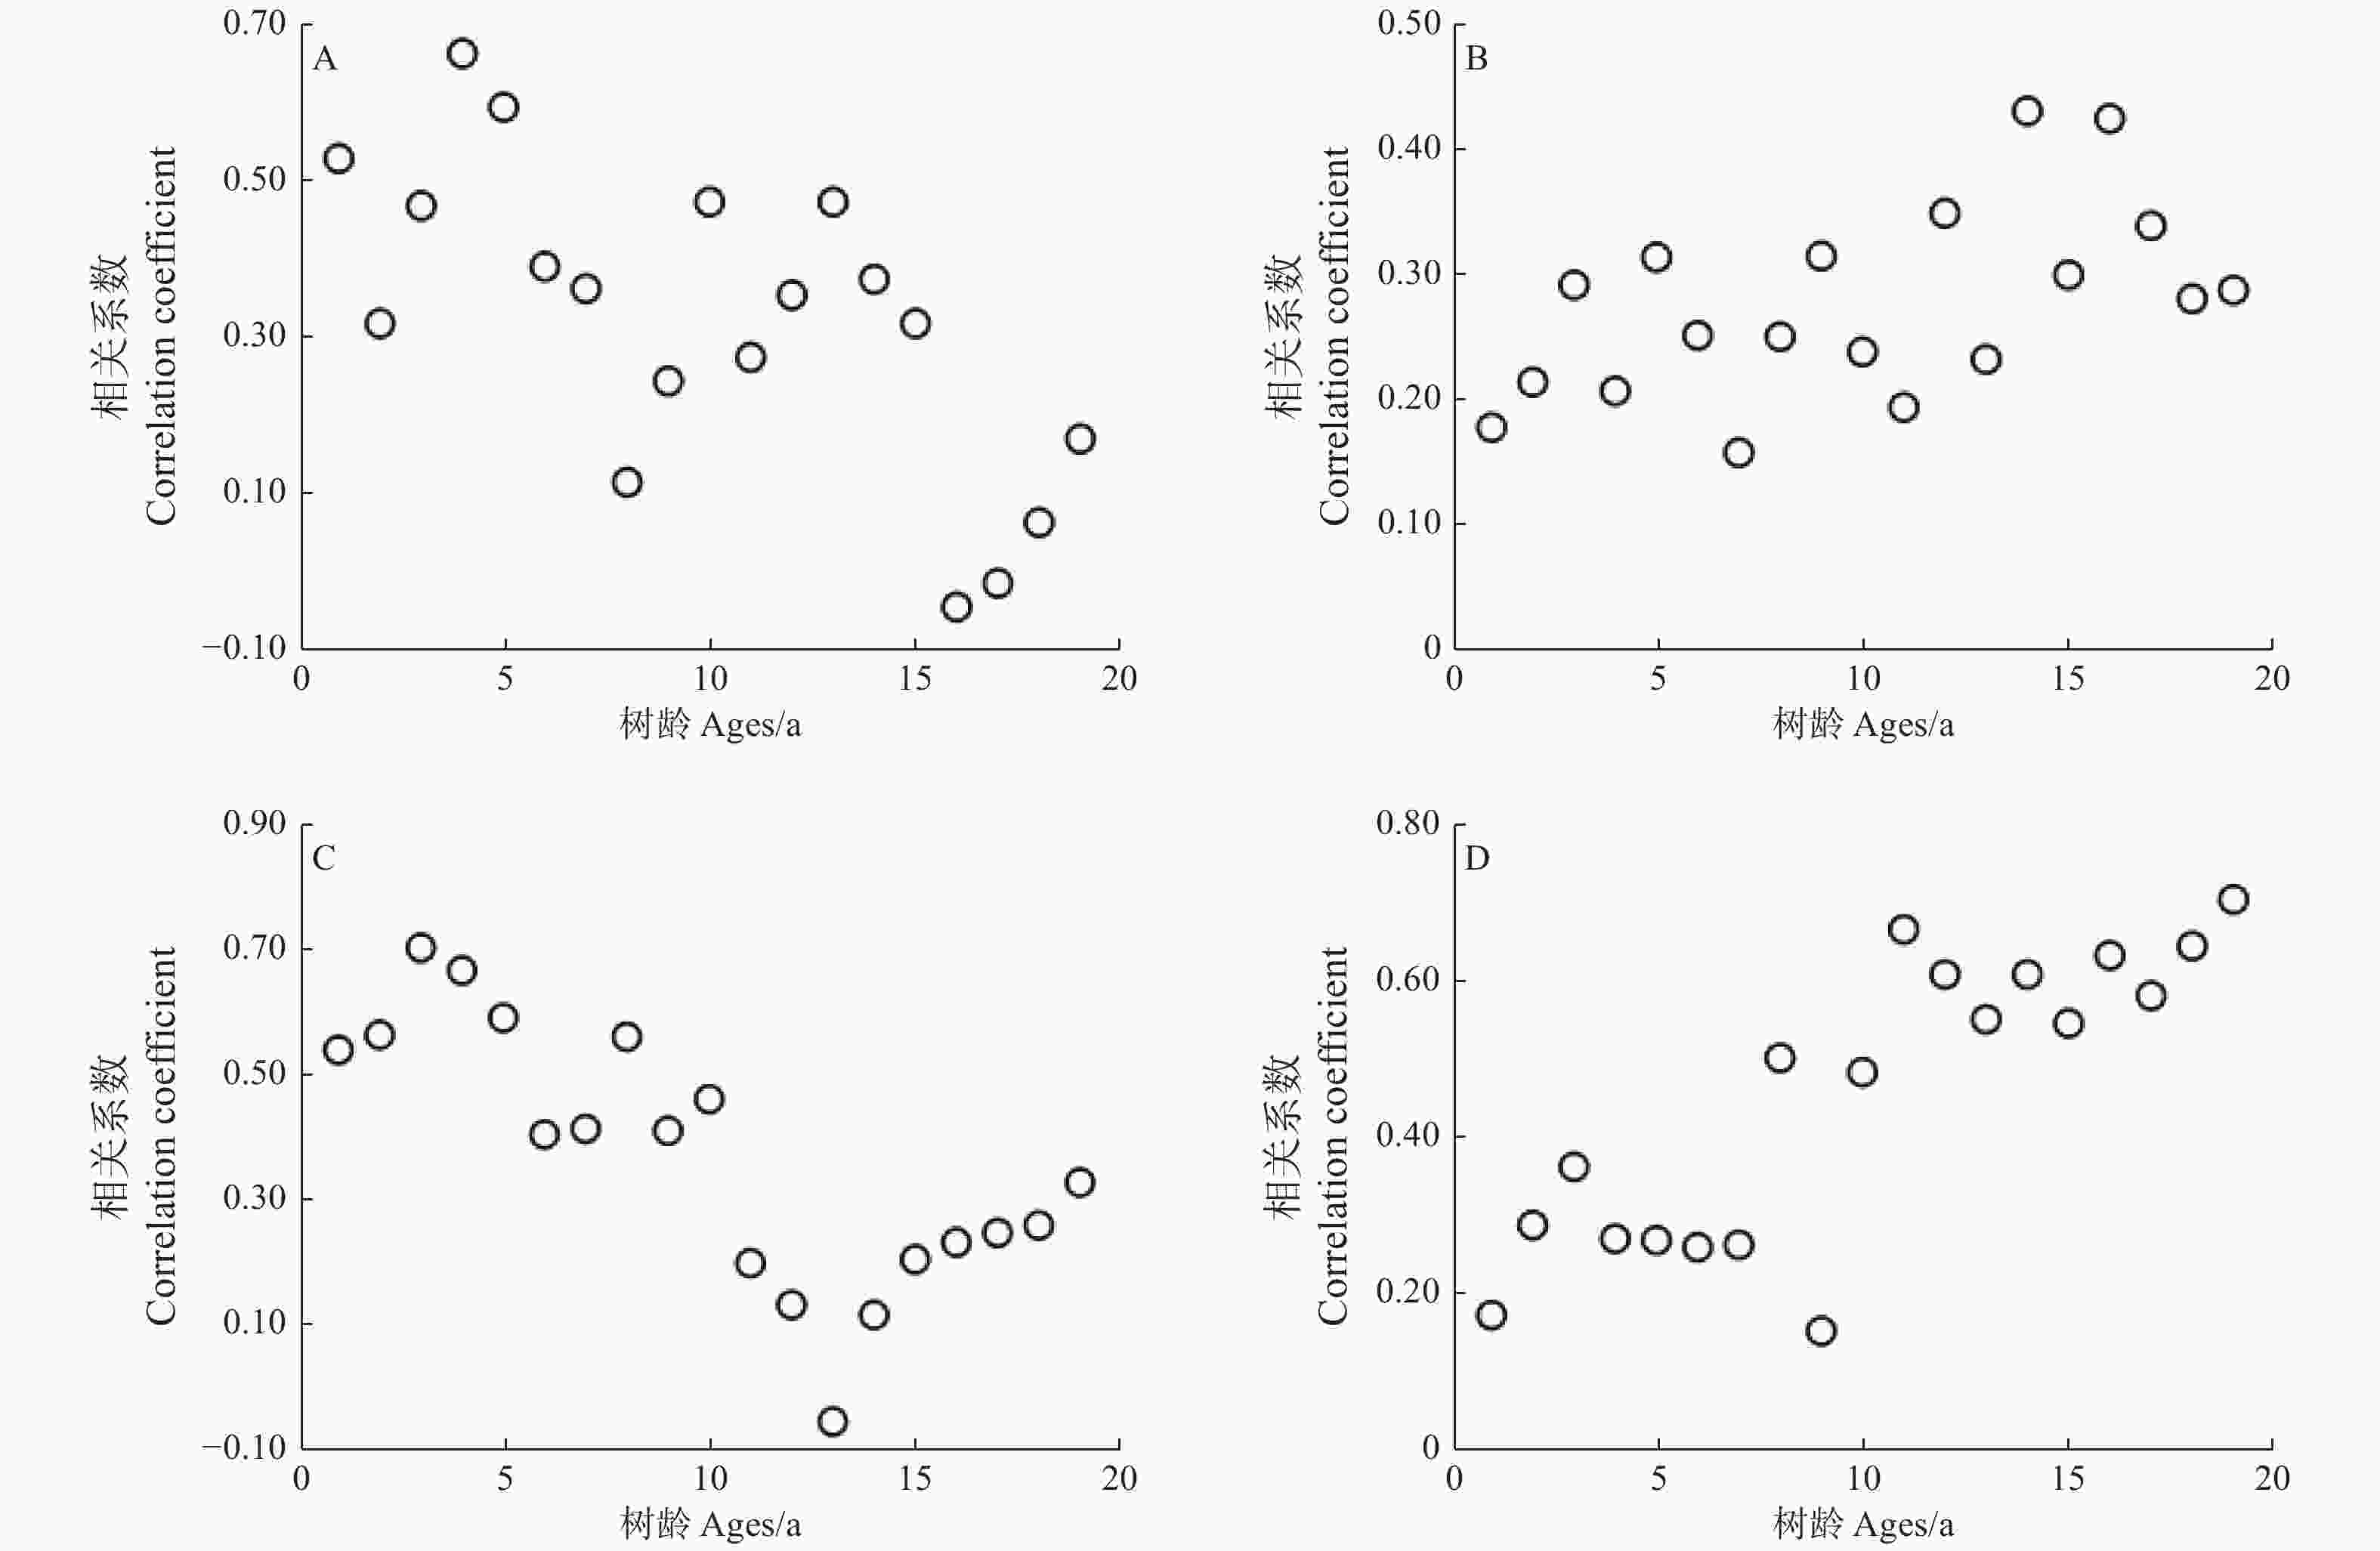
图 3 不同采脂年限的湿地松基本密度(ρ)与每年年轮振幅均值(AE)的相关系数
Figure 3. Correlation coefficient between basic density(ρ) and annual mean amplitude of tree (AE) values of P. elliottii with different years of harvesting
总体来说,采脂8、6、3、0 a的湿地松树龄分别为1~5、10、13 a,14、16 a,1~10 a,8、10~19 a是影响不同采脂年限的湿地松ρ的主要生长期。可以看出,采脂的湿地松10 a之后ρ与AE的相关系数大部分呈不显著相关,这与未采脂的湿地松形成了鲜明的对比,可能是采脂对湿地松生长后期的ρ造成了一定的影响。
-
对湿地松树干基部而言,采脂3 a的ρ显著高于采脂8、6、0 a的ρ,采脂8、6 a的ρ显著低于未采脂ρ,而采脂6 a和采脂8 a的ρ间无显著性差异。可以得出,一定范围内,采脂使湿地松树干基部ρ呈先升高后降低的变化,但总体趋势是造成其ρ降低。对采脂部位而言,采脂3 a的ρ显著高于采脂6、0 a的ρ,但与采脂8 a的ρ无差异,采脂8、6、0 a的ρ三者之间无显著性差异(图4)。因此,采脂对湿地松采脂部位的ρ的影响,仅出现在采脂前几年,后期对其影响逐渐减小,表现出其一定的恢复性。
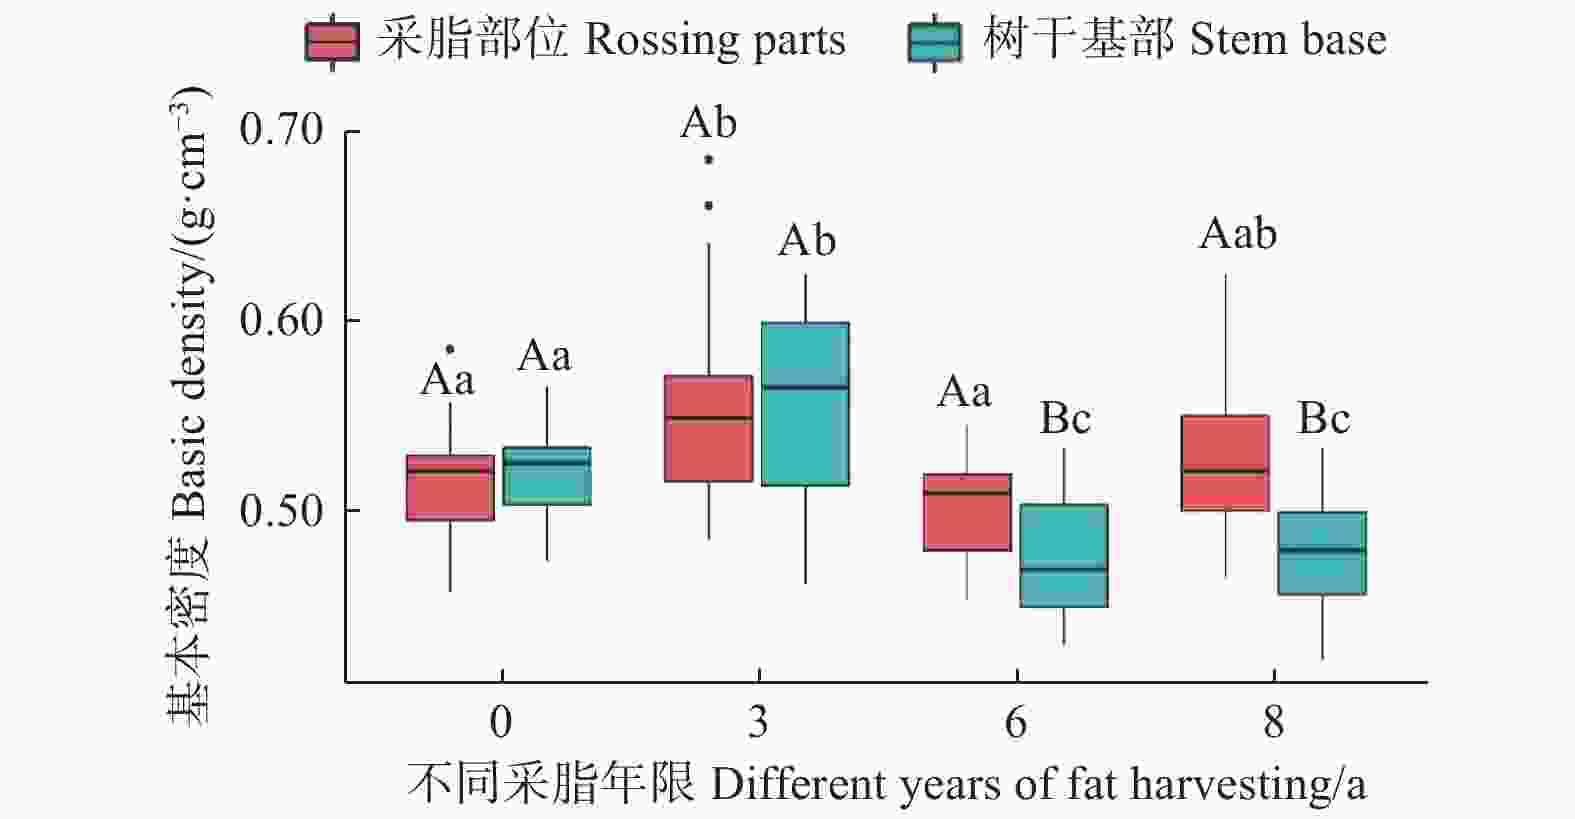
图 4 不同采脂年限对基本密度(ρ)的影响
Figure 4. Effects of different years of fat harvesting on basic density(ρ)
-
将木质素含量与Resistograth测定的AM和ρ进行相关性分析,相关系数都大于0,未达到显著水平,因此湿地松木质素含量与ρ和AM无相关性或相关性很低。
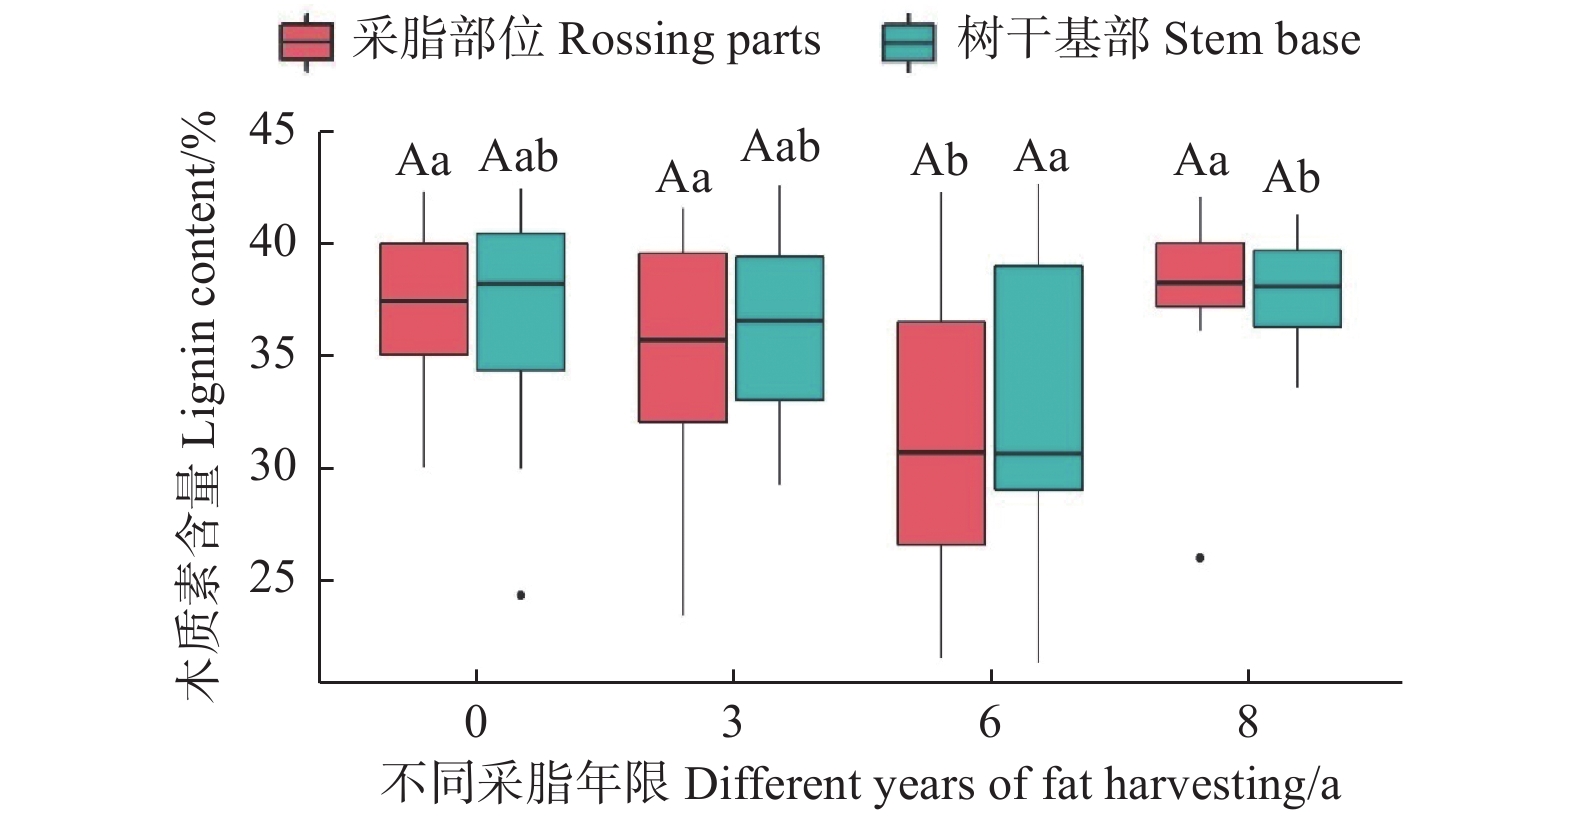
对采脂部位而言,采脂6 a的湿地松木质素含量显著低于采脂8、3、0 a的木质素含量,为32.40%,采脂8、3、0 a的木质素含量彼此之间无显著性差异。对树干基部而言,4个采脂年限组间无显著性差异,但采脂6 a的木质素含量较低(图5)。因此,采脂可导致木质素含量发生显著性改变,且在一定程度上随着采脂年限的增加木质素含量呈先减少后增加的趋势,当采脂年限增加到一定范围,其表现出较强的恢复能力。
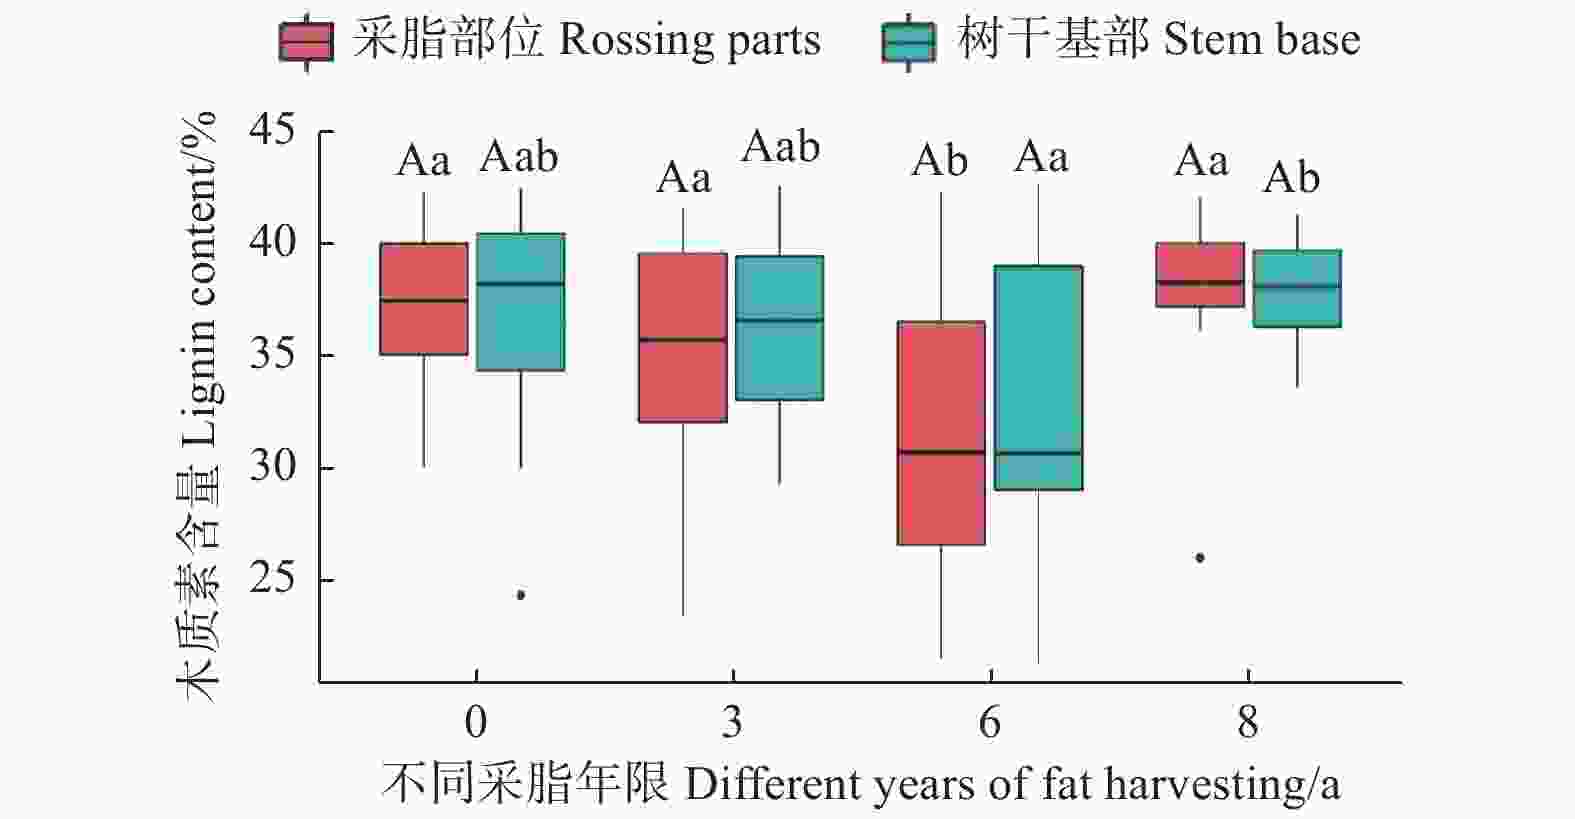
图 5 不同采脂年限对木质素含量的影响
Figure 5. Effects of different years of fat harvesting on lignin content
-
分别对4个不同采脂年限湿地松采脂部位和树干基部的ρ、木质素含量进行差异性分析。结果显示,采脂3、0 a湿地松不同部位之间的ρ无显著差异(P > 0.05),采脂6 a和采脂8 a的采脂部位和树干基部有显著性差异(P = 0.03 < 0.05、df = 29,P ≈ 0.01 < 0.01、df = 23),且采脂部位ρ显著高于树干基部(图4、5)。4个采脂年限湿地松不同部位的木质素含量无显著性差异。随着采脂年限的增加,在一定程度上可以造成采脂部位和树干基部的ρ产生显著性差异,但对两个部位的木质素含量无影响。
-
相关研究表明,在多个树种中,Resistograph与ρ表型值呈正相关。赵奋成等[18]、丁显印等[17]研究显示,18年生、24年生湿地松的Resistograph阻力值和ρ的表型相关系数(rp)分别为0.66、0.50;Gantz[23]报道,10年生辐射松(P. radiata D. Don)、10~16年生加勒比松 ( P. caribaea Morelet)针刺仪阻力值和木材密度的表型相关系数(rp)分别为0.41~0.58、0.77~0.78。本研究对采脂年限为8、6、3、0 a的20年生湿地松的ρ进行直接和间接的测定,Resistograph阻力值和ρ的相关系数为0.39~0.63,且都呈显著的正相关。这与赵奋成等[18]和丁显印等[17]的研究结果相似,表明针刺仪同样适用于预测采脂后的湿地松单株的ρ。但Resistograph 测定值AE与ρ的相关性从活立木外侧到髓心未全达到显著水平,这与丁显印等[17]的研究结果存在差异。4个采脂年限的湿地松10 a以后Resistograph测定值AE与ρ的相关性存在差异,有可能与采脂有关,也有可能是周围环境的影响。赵奋成等[18]研究得出,针刺仪数据校正后,对阻力值与ρ的相关系数并没有显著性优化,故本试验没有对数据进行校正。
目前关于湿地松的采脂研究主要集中在其对胸径生长、材积生长和树高生长的影响。本研究对20年生湿地松进行不同采脂年限处理,分析了不同采脂年限对湿地松不同部位ρ和木质素含量的影响。采脂可影响湿地松采脂部位的ρ,主要表现在采脂前几年ρ显著提高,后期对其影响逐渐减小。采脂使湿地松树干基部的ρ呈先升高后降低的变化,但总体趋势是其ρ降低。陈鉴朝[24]的研究显示采脂对木材的力学性能除了冲击韧性降低外,其它性能略有提高,本研究采脂部位的结果与其有相似之处,且采脂6 a以上湿地松采脂部位的ρ高于树干基部的ρ,更符合前者的研究结果。而徐慧兰等[5]对5~9年生湿地松采脂的研究结果显示,采脂导致密度变小,这与本研究树干基部的结果相似,而与采脂部位的结果存在差异,推测其原因为起始采脂林龄的差异造成。湿地松从5 a到11 a属于林木胸径、树高和单株材积由速生期向缓慢生长期过渡的阶段[25]。徐慧兰等[5]对湿地松的起始采脂林龄处于速生期,本试验起始采脂林龄处于缓慢生长期。这种差异也可能与生长率、晚材率和纤维形态的变化等有关[11],有待进一步研究。
木质素可起抗压和增强植物体机械强度的作用,木质素含量降低会给植物本身生长带来不利影响,消弱其对不良环境的抵抗[26]。采脂6 a的湿地松采脂部位木质素含量显著低于其它3个处理,而另外3个处理无显著差异。这与陈鉴朝[24]的研究结果相反,与徐慧兰[5]的研究结果相符。采脂强度提高,造成割面扩大,使木材质量降低,且常造成心材腐烂,病虫害发生[10]。这可能是木质素含量降低的结果。一定采脂年限范围内,采脂会使湿地松采脂部位木质素含量降低,而对树干基部影响不大。对同一采脂年限的湿地松两个部位的木质素变化结果显示,同一株湿地松的不同部位的木质素含量无差异,且采脂对其也无影响。采脂只影响湿地松整体采脂部位木质素含量发生显著变化。
-
(1)采脂8、6、3、0 a的湿地松基本密度(ρ)与每株年轮振幅均值(AM)在单株水平上的表型相关系数分别为0.45、0.39、0.50、0.63,可通过预测方程ρ = 0.0052AM + 0.4044、ρ = 0.0037AM + 0.4321、ρ = 0.0098AM + 0.3650、ρ = 0.0086AM + 0.3774来估算ρ,针刺仪同样适用于预测采脂后的湿地松单株的ρ。湿地松木质素含量与Resistograth测定的AM相关性不显著,针刺仪Resistograth不可用来预测木质素含量。
(2)采脂对湿地松的基本密度(ρ)和木质素含量具有一定的影响。一定范围内,树干基部的ρ表现为先升高后降低,最后显著低于未采脂的ρ;而采脂部位的ρ先升高后降低,最终与未采脂的ρ无差异。采脂部位的木质素含量表现为先降低后恢复到未采脂的木质素含量水平,而采脂对树干基部的木质素含量无影响。
(3)本试验中采脂6 a以上的湿地松,其采脂部位的基本密度(ρ)显著高于树干基部的基本密度(ρ);采脂对两个部位之间的木质素含量无影响。
采脂年限对湿地松活立木不同部位材性变化的影响
Effects of Resin-Tapping Year on Wood Properties of Living Pinus elliottii
-
摘要:
目的 通过采脂试验,结合Resistograph技术,研究不同采脂年限对湿地松采脂部位、未采脂部位(树干基部)的基本密度和木质素含量的影响,为湿地松遗传改良和资源最优化利用提供参考。 方法 以采脂8、6、3、0(未采脂)a的20年生湿地松为材料,利用Resistograph测定其采脂部位、树干基部密度的相对值和年轮宽度,在同株同一位置上利用电动生长锥钻取木芯并收集木屑,测定木芯基本密度和木屑木质素含量,分析其与Resistograph测定结果的相关性。 结果 采脂8、6、3、0 a的湿地松木材基本密度与Resistograph测定值的相关系数分别为0.45、0.39、0.50、0.63,分别建立木材阻力预测木材基本密度的线性回归方程。木质素含量与Resistograph测定值相关不显著(P > 0.05)。采脂3 a的湿地松树干基部基本密度显著高于采脂8、6、0 a的基本密度,采脂8、6 a的基本密度显著低于未采脂的基本密度,而采脂6 a和采脂8 a的基本密度间无显著性差异;采脂3 a的湿地松采脂部位基本密度显著高于采脂6、0 a的基本密度,但与采脂8 a的无差异,采脂8、6、0 a的基本密度三者之间无显著差异;木质素含量分析结果显示,仅采脂6 a的湿地松采脂部位木质素含量显著低于采脂8、3、0 a的木质素含量,其余均无显著性差异,但采脂6 a的树干基部木质素含量比其它3个采脂年限的木质素含量低。 结论 Resistograph测定同样适用于采脂后湿地松基本密度的预测,但其不可预测木质素含量;一定采脂年限范围内,采脂使湿地松树干基部和采脂部位的基本密度先升高后降低,采脂部位的木质素含量先降低后升高,但对树干基部木质素含量无影响;采脂超过一定年限,可导致采脂部位的基本密度高于树干基部的基本密度,而对两个部位的木质素含量无影响。 -
关键词:
- 湿地松
- / 采脂
- / Resistograph
- / 基本密度
- / 木质素含量
Abstract:Objective To study the influnence of resin-tapping duration on the basic density and lignin content of resin-tapping parts and trunk of Pinus elliottii in order to optimize the genetic improvement and resource utilization of P. elliottii. Method Twenty-years-old P. elliottii trees that have been resin-tapped for 8, 6, 3, and 0 years were studied using Resistograph technology to measure the relative value of density and width of tree in the resin-tapping part and the base of the trunk. The wood core was extracted from the same plant by electric growth cone drill and the sawdust was collected. The basic density of wood was determined by submerged water method and the lignin content was determined by Reagent test kit. The correlation around basic density, lignin content and the Resistograph was analyzed. Result The correlation coefficients between the basic density of P. elliottii wood and the Resistograph values after 8, 6, 3 and 0 years of resin-tapping were 0.45, 0.39, 0.50 and 0.63, respectively. The linear regression equations for predicting the basic density of wood using Resistograph values were established. There was no significant correlation between lignin content and Resistograph values (P > 0.05). The base density of the tree trunk of P. elliottii after 3 years of resin-tapping was significantly higher than that after 0, 6 and 8 years of resin-tapping, and the base density of the tree trunk after 6 and 8 years of resin-tapping was significantly lower than that of the tree trunk without resin-tapping, but there was no significant difference between the base density of the tree trunk after 6 and 8 years of resin-tapping. The basic density of P. elliottii after 3 years of resin-tapping was significantly higher than that after 0 and 6 years of resin-tapping, but there was no difference with that after 8 years of resin-tapping. There was no significant difference among the basic density after 0, 6 and 8 years of resin-tapping. The analysis results of lignin content showed that the lignin content in the base of the tree trunk was lower than that after 0, 3 and 8 years of resin-tapping, and there was no significant difference in the rest, but the lignin content in the base of the tree trunk was lower after 6 years of resin-tapping than that after the other three durations. Conclusion Resistograph determination is suitable for predicting the basic density of P. elliottii after resin-tapping, but not for lignin content. To a certain extent, the basic density of P. elliottii at the base and site of tree trunk will increase in initial and then decrease, and the lignin content at the site of tree trunk will decrease in initial and then increase, but shows no effect on the lignin content at the base of tree trunk. When the resin is harvested over a certain years, the basic density of the resin-tapping part will be higher than that of the base of tree trunk, but the lignin content of the two parts is not affected. -
Key words:
- Pinus elliottii
- / resin-tapping
- / Resistograph
- / basic density
- / lignin content
-
图 1 Resistograph测定的湿地松木材振幅(阻力)曲线
Figure 1. Amplitude (resistance) curves of P. elliottii wood measured by Resistograph
图 2 不同采脂时间长度采脂8、6、3、0 a的采脂部位、树干基部不同部位的基本密度(ρ)与AM值的相关分析
Figure 2. Correlation analysis of basic density(ρ) and AM values of the rossing parts
图 3 不同采脂年限的湿地松基本密度(ρ)与每年年轮振幅均值(AE)的相关系数
Figure 3. Correlation coefficient between basic density(ρ) and annual mean amplitude of tree (AE) values of P. elliottii with different years of harvesting
图 4 不同采脂年限对基本密度(ρ)的影响
Figure 4. Effects of different years of fat harvesting on basic density(ρ)
图 5 不同采脂年限对木质素含量的影响
Figure 5. Effects of different years of fat harvesting on lignin content
表 1 采脂8、6、3、0 a湿地松采脂部位和树干基部的生长锥、Resistograth测定值
Table 1. Measured values of growth cones and Resistograth of different rossing parts and stem base of P. elliottii for 8, 6, 3 and 0 years
采脂年限
Rossing fixed
number of year /a不同部位
Different parts性状
Traits均值
Mean最大值
Maximum最小值
Minimum标准差
Standard deviation变异系数
Coefficient of
variation /%8 采脂部位
Rossing parts基本密度ρ
Basic density/(g·cm−3)0.53 0.62 0.47 0.05 8.68 Resistograph 测定值
Resistograph measurement valueAE/% 19.69 21.94 16.66 1.61 8.18 AM/% 19.69 27.31 12.94 4.60 23.36 RE/mm 4.57 5.50 3.65 0.56 12.25 RM/mm 4.57 5.69 3.51 0.77 16.85 树干基部
Stem base基本密度ρ
Basic density/(g·cm−3)0.48 0.53 0.42 0.03 7.21 Resistograph 测定值
Resistograph measurement valueAE/% 18.13 19.37 15.70 0.85 4.69 AM/% 18.13 24.40 10.18 3.42 18.86 RE/mm 5.06 6.56 3.40 0.90 17.79 RM/mm 5.06 6.57 3.90 0.94 18.58 6 采脂部位
Rossing parts基本密度ρ
Basic density/(g·cm−3)0.50 0.55 0.45 0.03 5.95 Resistograph 测定值
Resistograph measurement valueAE/% 16.58 18.56 12.36 1.36 8.20 AM/% 16.59 25.13 10.19 3.77 22.72 RE/mm 4.70 5.67 3.53 0.63 13.40 RM/mm 4.70 6.72 3.02 1.06 22.55 树干基部
Stem base基本密度ρ
Basic density/(g·cm−3)0.48 0.53 0.43 0.03 7.16 Resistograph 测定值
Resistograph measurement valueAE/% 14.57 16.65 10.71 1.60 10.98 AM/% 14.57 19.09 8.83 3.28 22.51 RE/mm 5.34 7.15 3.47 0.98 18.35 RM/mm 5.34 6.52 3.26 0.86 16.10 3 采脂部位
Rossing parts基本密度ρ
Basic density/(g·cm−3)0.56 0.69 0.48 0.06 11.15 Resistograph 测定值
Resistograph measurement valueAE/% 19.97 22.46 14.82 1.81 9.06 AM/% 19.97 25.90 16.40 2.69 13.47 RE/mm 4.25 6.05 3.25 0.79 18.59 RM/mm 4.25 5.69 2.96 0.77 18.12 树干基部
Stem base基本密度ρ
Basic density/(g·cm−3)0.55 0.62 0.46 0.05 9.64 Resistograph 测定值
Resistograph measurement valueAE/% 19.00 20.32 14.95 1.26 6.63 AM/% 19.01 26.00 13.47 3.15 16.57 RE/mm 4.91 6.69 3.71 0.81 16.50 RM/mm 4.91 6.38 3.39 0.76 15.48 0 采脂部位
Rossing parts基本密度ρ
Basic density/(g·cm−3)0.51 0.58 0.46 0.03 6.58 Resistograph 测定值
Resistograph measurement valueAE/% 16.47 18.25 13.95 1.13 6.86 AM/% 16.47 23.19 13.03 2.31 14.03 RE/mm 4.26 5.41 2.83 0.72 16.90 RM/mm 4.26 5.34 3.02 0.81 19.01 树干基部
Stem base基本密度ρ
Basic density/(g·cm−3)0.53 0.66 0.47 0.05 8.51 Resistograph 测定值
Resistograph measurement valueAE/% 16.91 19.75 12.62 1.46 8.63 AM/% 16.91 25.52 10.96 3.51 20.76 RE/mm 4.73 6.49 2.79 1.00 21.14 RM/mm 4.73 6.42 3.77 0.82 17.34  下载: 导出CSV
-
[1] 汪正齐. 湿地松丰产造林技术探析[J]. 南方农业, 2019, 13(3):62-63. [2] 李学平, 覃德文, 何 春. 广西湿地松人工林经济评估与分析[J]. 山西农业科学, 2019, 47(7):1277-1281. doi: 10.3969/j.issn.1002-2481.2019.07.39 [3] 吴东山, 杨章旗, 黄永利. 25年生湿地松家系基本产脂力遗传分析与选择[J]. 广西林业科学, 2019, 48(4):438-443. [4] 刘春芳, 陈锡联. 采脂对湿地松林分生长和经济效益的影响[J]. 浙江林业科技, 2004, 24(3):25-27. [5] 徐慧兰, 颜培栋, 唐生森, 等. 采脂处理对湿地松幼龄林生长和材性的影响[J]. 森林与环境学报, 2016, 36(2):252-256. [6] Génova M, Caminero L, Dochao J. Resin tapping in Pinus pinaster: effects on growth and response function to climate[J]. European Journal of Forest Research, 2013, 133(2): 323-333. [7] Chen F, Yuan Y J, Yu S L, et al. Influence of climate warming and resin collection on the growth of masson pine (Pinus massoniana) in a subtropical forest, southern China[J]. Trees, 2015, 29(5): 1423-1430. doi: 10.1007/s00468-015-1222-3 [8] 吴明山, 普爱明, 周汝良, 等. 采脂对思茅松林木生长的影响[J]. 西部林业科学, 2015, 44(6):47-50. [9] Van Der Maaten E, Mehl A, Wilmking M, et al. Tapping the tree-ring archive for studying effects of resin extraction on the growth and climate sensitivity of Scots pine [J]. Forest Ecosystems, 2017, 4(1): 1-7. [10] 邹文魁. 不同强度采脂对马尾松生长的影响[J]. 林业勘察设计, 2007(2):114-116. doi: 10.3969/j.issn.1004-2180.2007.02.034 [11] Jim L B J L, Rubin S R. Forest products and wood science: an introduction [M]. 4th ed. Ames, Iowa: Iowa State University Press, 2003: 205-231. [12] 孙燕良, 张厚江, 朱 磊, 等. 木材密度检测方法研究现状与发展[J]. 森林工程, 2011, 27(1):23-26. doi: 10.3969/j.issn.1001-005X.2011.01.007 [13] Duval A, Lawoko M. A review on lignin-based polymeric, micro- and nano-structured materials[J]. Reactive and Functional Polymers, 2014, 85: 78-96. doi: 10.1016/j.reactfunctpolym.2014.09.017 [14] 熊福全, 韩雁明, 李改云, 等. 点击化学在木质纤维素化学修饰中的研究现状[J]. 林业科学, 2016, 52(3):90-96. [15] 杨 静, 蒋剑春, 张 宁, 等. 微生物降解木质素的研究进展[J]. 生物质化学工程, 2021, 55(3):62-70. doi: 10.3969/j.issn.1673-5854.2021.03.010 [16] 蹇均宇, 高士帅, 张代晖, 等. 碱性酚化木质素结构表征及在酚醛树脂中的应用研究[J]. 中国胶粘剂, 2021, 30(5):21-24,30. [17] 丁显印, 陶学雨, 刁 姝, 等. Pilodyn和Resistograph对湿地松活立木基本密度的评估[J]. 南京林业大学学报: 自然科学版, 2020, 44(3):142-148. [18] 赵奋成, 郭文冰, 钟岁英, 等. 基于针刺仪测定技术的湿地松木材密度间接选择效果[J]. 林业科学, 2018, 54(10):172-179. [19] Isik F, Li B. Rapid assessment of wood density of live trees using the Resistograph for selection in tree improvement programs[J]. Canadian Journal of Forest Research, 2003, 33(12): 2426-2435. doi: 10.1139/x03-176 [20] Gao S, Wang X, Wiemann M C, et al. A critical analysis of methods for rapid and nondestructive determination of wood density in standing trees[J]. Annals of Forest Science, 2017, 74(2): 27. doi: 10.1007/s13595-017-0623-4 [21] Konguvel E, Kannan M. A Survey on FFT/IFFT processors for next generation telecommunication systems [J]. Journal of Circuits, Systems and Computers, 2017, 27(3). doi:10.1142/S0218126618300015. [22] Villanueva R A M, Chen Z J. ggplot2: Elegant graphics for data analysis (2nd ed. )[J]. Measurement: Interdisciplinary Research and Perspectives, 2019, 17(3): 160-167. doi: 10.1080/15366367.2019.1565254 [23] Gantz C H. Evaluating the efficiency of the Resistograph to estimate genetic parameters for wood density in two softwood and two hardwood species[D]. Raleigh, NC: North Carolina State University, 2002. [24] 陈鉴朝. 湿地松建筑材的材性与利用[J]. 广东林业科技, 1995, 11(4):26-31. [25] 唐生森, 韦理电, 蒙春江, 等. 采脂对湿地松幼林生长的影响与效益分析[J]. 中南林业科技大学学报, 2017, 37(11):96-102. [26] 宋恩慧, 蔡 诚, 魏 国, 等. RNA干涉培育低木质素杨树[J]. 林业科学, 2010, 46(2):39-44. doi: 10.11707/j.1001-7488.20100207 -

 点击查看大图

计量
- 文章访问数: 4597
- HTML全文浏览量: 2756
- PDF下载量: 76
- 被引次数: 0
