• 中国中文核心期刊
  • 中国科学引文数据库(CSCD)核心库来源期刊
  • 中国科技论文统计源期刊(CJCR)
  • 第二届国家期刊奖提名奖
Volume 36 Issue 4
Aug.  2023
Article Contents
Turn off MathJax

Citation:

Characteristics of Soil Organic Carbon Pools and Their Influencing Factors under Different Stand Types in the Plain Sandy Area

  • Corresponding author: GUAN Qing-wei, guanjapan999@163.com
  • Received Date: 2022-11-17
    Accepted Date: 2022-12-24
  • Objective By investigating the characteristics of soil organic carbon pools under different stand types, this study aims to provide a theoretical basis for the enhancement of soil carbon pools and ecological restoration in plain sandy areas. Method Soil organic carbon (SOC), labile organic carbon fractions and soil enzyme activities were measured in five soil layers (0-20, 20-40, 40-60, 60-80 and 80-100 cm depth) for three 16-year-old stand types (poplar pure plantation, willow pure plantation and poplar-willow mixed plantation) and a nearby abandoned land (as control) at a typical plain sandy area of Feng County, Jiangsu Province. The carbon pool management index (CPMI) was estimated for the examined stands. The correlations between soil carbon pool characteristics and environmental factors therein were also analyzed. Result (1) In general, the organic carbon content (SOC) and storage (SOCS) of the three forest types and the control soil layers ranged from 1.03 to 5.88 g·kg−1 and 3.53 to 17.55 t·hm−2, respectively. Among them, the SOC content increased by 45.2%-82.2% in the forested sites compared with the control site, and the SOCS in the 0-100 cm soil layer of pure poplar forest was 1.23, 1.24, and 1.83 times that of pure willow forest, mixed willow forest and the control, respectively. (2) Compared with the control, the soil labile organic carbon fractions, including easily oxidizable organic carbon, dissolved organic carbon and microbial biomass carbon, increased by 28.6%-48.0%, 6.8%-9.7% and 21.6%-33.4%, respectively. The CPMI was significantly higher than 100% for the three stand types (P<0.05). (3) Soil invertase activity and polyphenol oxidase activity were significantly affected by stand types, and the polyphenol oxidase activity of poplar-willow mixed plantation was significantly higher than that of poplar pure plantation and control (P<0.05) in 0-100 cm soil layer. (4) Pearson correlation analysis showed that characteristics of SOC pools were significantly affected by polyphenol oxidase and β-glucosidase activities(P<0.05), SOC, SOCS, EOC and CPMI were significantly affected by invertase, peroxidase activities. MBC was significantly affected by invertase activity. Redundancy analysis showed that soil carbon to nitrogen ratio and fine root biomass were the main factors in affecting the characteristics of SOC pools in the study area. Conclusion Plantation in plain sandy soil area can improve soil organic carbon, active components and stability of organic carbon pool, and pure poplar forest has the best effect on improving soil organic carbon storage.
  • 加载中
  • [1] 李金垚, 潘 雯, 王 佳, 等. 土壤活性有机碳及碳库管理指数对石漠化治理措施的响应[J]. 林业科学研究, 2022, 35(5):156-163.

    [2]

    WANG B R, LIU D, YANG J J, et al. Effects of forest floor characteristics on soil labile carbon as varied by topography and vegetation type in the Chinese Loess Plateau[J]. Catena, 2021, 196: 104825. doi: 10.1016/j.catena.2020.104825
    [3] 李帅锋, 苏建荣, 刘万德, 等. 思茅松人工林土壤有机碳和氮储量变化[J]. 林业科学研究, 2015, 28(6):810-817.

    [4]

    BONGIORNO G, BUNEMANN E K, OGUEJIOFOR C U, et al. Sensitivity of labile carbon fractions to tillage and organic matter management and their potential as comprehensive soil quality indicators across pedoclimatic conditions in Europe[J]. Ecological Indicators, 2019, 99: 38-50. doi: 10.1016/j.ecolind.2018.12.008
    [5]

    BARRETO P A B, GAMA-RODRIGUES E F, GAMA-RODRIGUES A C, et al. Distribution of oxidizable organic C fractions in soils under cacao agroforestry systems in Southern Bahia, Brazil[J]. Agroforestry Systems, 2011, 81(3): 213-220. doi: 10.1007/s10457-010-9300-4
    [6]

    BELAY-TEDLA A, ZHOU X, BO S, et al. Labile, recalcitrant, and microbial carbon and nitrogen pools of a tallgrass prairie soil in the US Great Plains subjected to experimental warming and clipping[J]. Soil Biology & Biochemistry, 2009, 41(1): 110-116.
    [7]

    YANG X, MENG J, LAN Y, et al. Effects of maize stover and its biochar on soil CO2 emissions and labile organic carbon fractions in Northeast China[J]. Agriculture, Ecosystems & Environment, 2017, 240: 24-31.
    [8]

    BLAIR G, LEFROY R, LISLE L. Soil carbon fractions based on their degree of oxidation, and the development of a carbon management index for agricultural systems[J]. Australian Journal of Agricultural Research, 1995, 46(7): 393-406.
    [9] 钱虹宇, 周宏鑫, 罗原骏, 等. 土壤活性有机碳及碳库管理指数对高寒湿地退化的响应[J]. 生态学杂志, 2020, 39(7):2273-2282.

    [10] 佟小刚, 韩新辉, 杨改河, 等. 碳库管理指数对退耕还林土壤有机碳库变化的指示作用[J]. 中国环境科学, 2013, 33(3):466-473.

    [11] 刘江伟, 徐海东, 林同岳, 等. 海涂围垦区不同林分土壤活性有机碳垂直变化特征[J]. 林业科学研究, 2022, 35(3):18-26.

    [12]

    YAO L, ADAME M F, CHEN C R. Resource stoichiometry, vegetation type and enzymatic activity control wetlands soil organic carbon in the Herbert River catchment, North-east Queensland[J]. Journal of Environmental Management, 2021, 296: 113183. doi: 10.1016/j.jenvman.2021.113183
    [13]

    YUAN Z X, JIN X M, GUAN Q W, et al. Converting cropland to plantation decreases soil organic carbon stock and liable fractions in the fertile alluvial plain of eastern China[J]. Geoderma Regional, 2021, 24: e00356. doi: 10.1016/j.geodrs.2021.e00356
    [14]

    DAWUD S M, RAULUND-RASMUSSEN K, RATCLIFFE S, et al. Tree species functional group is a more important driver of soil properties than tree species diversity across major European forest types[J]. Special Feature:The Ecology of De-Extinction, 2017, 31(5): 1153-1162.
    [15]

    RATCLIFFE S, WIRTH C, JUCKER T, et al. Biodiversity and ecosystem functioning relations in European forests depend on environmental context[J]. Ecology letters, 2017, 20(11): 1414-1426. doi: 10.1111/ele.12849
    [16]

    CAMPOS R, PIRES G F, COSTA M H. Soil carbon sequestration in rainfed and irrigated production systems in a New Brazilian agricultural frontier[J]. Agriculture, 2020, 10(5): 156. doi: 10.3390/agriculture10050156
    [17] 徐 蛟, 王良杰. 江苏省平原沙土区河道生态提升建设探索[J]. 中国水利, 2020(23):42-43,4.

    [18] 黄明逸, 朱成立, 韩以振, 等. 江苏省黄河故道沙土区植被措施因子试验分析[J]. 水土保持研究, 2017, 24(1):140-144.

    [19]

    LIU H X, SUN Z J, DONG Y Q, et al. Precipitation drives the accumulation of soil organic carbon in the sandy desert of the Junggar Basin, Northwest China[J]. Ecological Indicators, 2022, 142: 109224. doi: 10.1016/j.ecolind.2022.109224
    [20] 全国土壤普查办公室. 中国土种志[M]. 北京: 中国农业出版社, 1993.

    [21]

    ELLIOTT E T. Aggregate structure and carbon, nitrogen, and phosphorus in native and cultivated soils[J]. Soil Science Society of America Journal, 1986, 50(3): 627-627. doi: 10.2136/sssaj1986.03615995005000030017x
    [22] 鲍士旦. 土壤农化分析 3版[M]. 北京: 中国农业出版社, 2000.

    [23] 关松荫. 土壤酶及其研究法[M]. 北京: 中国农业出版社, 1986.

    [24]

    KUKULS L, KLAVINS M, NIKODEMUS O, et al. Changes in soil organic matter and soil humic substances following the afforestation of former agricultural lands in the boreal-nemoral ecotone (Latvia)[J]. Geoderma Regional, 2019, 16: e00213. doi: 10.1016/j.geodrs.2019.e00213
    [25]

    MAYER M, PRESCOTT C E, ABAKER W E, et al. Tamm review: Influence of forest management activities on soil organic carbon stocks: A knowledge synthesis[J]. Forest Ecology and Management, 2020, 466: 118127. doi: 10.1016/j.foreco.2020.118127
    [26] 沈芳芳, 袁颖红, 樊后保, 等. 氮沉降对杉木人工林土壤有机碳矿化和土壤酶活性的影响[J]. 生态学报, 2012, 32(2):517-527.

    [27] 高 瑞, 王祎珂, 艾 宁, 等. 陕北特色经济林深层土壤有机碳特征及影响因素[J]. 森林与环境学报, 2021, 41(5):464-470.

    [28]

    NEFF J C, ASNER G P. Dissolved organic carbon in terrestrial ecosystems: Synthesis and a model[J]. Ecosystems, 2001, 4(1): 29-48. doi: 10.1007/s100210000058
    [29]

    PANG D B, CUI M, LIU Y G, et al. Responses of soil labile organic carbon fractions and stocks to different vegetation restoration strategies in degraded karst ecosystems of southwest China[J]. Ecological Engineering, 2019, 138: 391-402. doi: 10.1016/j.ecoleng.2019.08.008
    [30]

    RICHTER D D, MARKEWITZ D, TRUMBORE S E, et al. Rapid accumulation and turnover of soil carbon in a re-establishing forest[J]. Nature, 1999, 400(6739): 56-58. doi: 10.1038/21867
    [31]

    WANG Q K, XIAO F M, ZHANG F Y, et al. Labile soil organic carbon and microbial activity in three subtropical plantations[J]. Forestry, 2013, 86(5): 569-574. doi: 10.1093/forestry/cpt024
    [32]

    YAN M F, LI T H, LI X R, et al. Microbial biomass and activity restrict soil function recovery of a post-mining land in eastern Loess Plateau[J]. Catena, 2021, 199: 105107. doi: 10.1016/j.catena.2020.105107
    [33] 林鑫宇, 惠 昊, 王亚茹, 等. 不同林分类型下土壤活性有机碳含量和分布特征[J]. 安徽农业大学学报, 2021, 48(3):437-443.

    [34] 谭桂霞, 刘苑秋, 李莲莲, 等. 湿地松林分结构调整对土壤活性有机碳的影响[J]. 应用生态学报, 2014, 25(5):1307-1312.

    [35]

    MEENA V S, MONDAL T, PANDEY B M, et al. Land use changes: Strategies to improve soil carbon and nitrogen storage pattern in the mid-Himalaya ecosystem, India[J]. Geoderma, 2018, 321: 69-78. doi: 10.1016/j.geoderma.2018.02.002
    [36]

    LI j, WEN Y C, LI X H, et al. Soil labile organic carbon fractions and soil organic carbon stocks as affected by long-term organic and mineral fertilization regimes in the North China Plain[J]. Soil and Tillage Research, 2018, 175: 281-290. doi: 10.1016/j.still.2017.08.008
    [37]

    PRIETO I, STOKES A, ROUMET C. Root functional parameters predict fine root decomposability at the community level[J]. Journal of ecology, 2016, 104(3): 725-733. doi: 10.1111/1365-2745.12537
  • 加载中
通讯作者: 陈斌, bchen63@163.com
  • 1. 

    沈阳化工大学材料科学与工程学院 沈阳 110142

  1. 本站搜索
  2. 百度学术搜索
  3. 万方数据库搜索
  4. CNKI搜索

Figures(4) / Tables(6)

Article views(2410) PDF downloads(69) Cited by()

Proportional views

Characteristics of Soil Organic Carbon Pools and Their Influencing Factors under Different Stand Types in the Plain Sandy Area

    Corresponding author: GUAN Qing-wei, guanjapan999@163.com
  • 1. College of Biology and the Environment, Nanjing Forestry University, Nanjing 210037, Jiangsu, China
  • 2. Fengxian Water Conservancy Bureau, Xuzhou 221799, Jiangsu, China
  • 3. Nanjing Yangtze Finless Porpoise Provincial Nature Reserve Management Station, Nanjing 210019, Jiangsu, China
  • 4. Water Conservancy Construction Bureau of Jiangsu Province, Nanjing 210029, Jiangsu, China
  • 5. Nanjing Yangtze River Management Bureau, Nanjing 210011, Jiangsu, China
  • 6. Wengan County Water Authority, Wengan 550400, Guizhou, China

Abstract:  Objective By investigating the characteristics of soil organic carbon pools under different stand types, this study aims to provide a theoretical basis for the enhancement of soil carbon pools and ecological restoration in plain sandy areas. Method Soil organic carbon (SOC), labile organic carbon fractions and soil enzyme activities were measured in five soil layers (0-20, 20-40, 40-60, 60-80 and 80-100 cm depth) for three 16-year-old stand types (poplar pure plantation, willow pure plantation and poplar-willow mixed plantation) and a nearby abandoned land (as control) at a typical plain sandy area of Feng County, Jiangsu Province. The carbon pool management index (CPMI) was estimated for the examined stands. The correlations between soil carbon pool characteristics and environmental factors therein were also analyzed. Result (1) In general, the organic carbon content (SOC) and storage (SOCS) of the three forest types and the control soil layers ranged from 1.03 to 5.88 g·kg−1 and 3.53 to 17.55 t·hm−2, respectively. Among them, the SOC content increased by 45.2%-82.2% in the forested sites compared with the control site, and the SOCS in the 0-100 cm soil layer of pure poplar forest was 1.23, 1.24, and 1.83 times that of pure willow forest, mixed willow forest and the control, respectively. (2) Compared with the control, the soil labile organic carbon fractions, including easily oxidizable organic carbon, dissolved organic carbon and microbial biomass carbon, increased by 28.6%-48.0%, 6.8%-9.7% and 21.6%-33.4%, respectively. The CPMI was significantly higher than 100% for the three stand types (P<0.05). (3) Soil invertase activity and polyphenol oxidase activity were significantly affected by stand types, and the polyphenol oxidase activity of poplar-willow mixed plantation was significantly higher than that of poplar pure plantation and control (P<0.05) in 0-100 cm soil layer. (4) Pearson correlation analysis showed that characteristics of SOC pools were significantly affected by polyphenol oxidase and β-glucosidase activities(P<0.05), SOC, SOCS, EOC and CPMI were significantly affected by invertase, peroxidase activities. MBC was significantly affected by invertase activity. Redundancy analysis showed that soil carbon to nitrogen ratio and fine root biomass were the main factors in affecting the characteristics of SOC pools in the study area. Conclusion Plantation in plain sandy soil area can improve soil organic carbon, active components and stability of organic carbon pool, and pure poplar forest has the best effect on improving soil organic carbon storage.

  • 土壤有机碳是土壤中地上地下凋落物、根系沉积物、动物残体和微生物体及其分解和合成的有机物质中的碳,是评价土壤肥力和土壤质量的重要指标[1]。由于土壤有机碳库含量巨大,其微小的变化将对全球碳循环和气候变化产生显著影响[2-3]。土壤有机碳储量受林分类型、地形地貌、气候变化和土地利用方式等自然和人为因素的影响,但土壤总有机碳对这些环境因素的响应表现出一定的滞后性,难以在短期内观测其变化[4-5]。土壤活性有机碳组分是土壤中活性较高、易分解矿化的有机碳,对区域环境变化的响应更敏感[6],可以及时、准确地反映土壤有机碳对干扰和环境变化的响应[7]。碳库管理指数是陆地生态系统中土壤碳动态变化率的敏感指标,可以衡量环境因素对土壤有机碳数量和质量的影响[8-9]。因此,明确有机碳及其活性有机碳组分和碳库管理指数等有机碳库特征对预测土壤碳循环具有重要意义。

    不同林分类型的根系分布、凋落物组成和微生物群落结构等存在差异,导致光照、水分和土壤理化性质等环境条件变化,进而影响土壤有机碳积累和转化速率[10-11]。Wang等[2]认为,黄土高原延河流域森林较高的凋落物输入,增加土壤氮磷含量,降低土壤容重和pH值,促进有机碳及活性组分的积累和固存。Yao等[12]对昆士兰赫伯特河流域土壤研究发现,不同植被的凋落物输入、酶活性以及微生物组成存在差异,增加潮汐森林0~30 cm土层有机碳含量。Yuan等[13]对亚热带冲击平原土壤有机碳库研究认为,相较于香樟(Cinnamomum camphora (L.) Presl)和水杉(Metasequoia glyptostroboides Hu & W. C. Cheng),落叶阔叶重阳木(Bischofia polycarpa (Levl.) Airy Shaw)人工林较低的碳氮比和较短的细根寿命加速凋落物分解,缓解土地利用方式转变初期有机碳的损失。Dawud等[14]和Ratcliffe等[15]指出,林分类型对土壤有机碳的影响在不同气候和土壤类型下存在差异。

    江苏省总面积约10.72万km2,其中,平原沙土区面积约2万km2,主要分为黄河故道沙土区、沿海平原沙土区和通南高沙土区。江苏省丰县属典型黄河故道沙土区,土壤类型以潮土和风沙土为主,土壤风化程度高,结构疏松,抗侵蚀能力弱,自然肥力低,孔隙率高,保水性差[16-17]。以往对平原沙土区研究多集中于植被恢复措施的水土保持效果[18],较少关注土壤碳库特征和土壤质量提升。前人研究表明,植被恢复可以改变沙土有机碳储量[19],但造林初期不同林分类型下沙土区土壤有机碳库特征及其与环境因子的关系尚不清楚。基于此,本研究以江苏省平原沙土区丰县16年生杨树(Populus × euramevicana cl. 'Zhonglin 46')纯林、柳树(Salix × jiangsuensis cl. ‘J-172’)纯林、杨柳混交林3种林分类型及相邻的撂荒地(对照)为对象,测定土壤有机碳及活性组分、蔗糖酶、过氧化物酶、多酚氧化酶和β-葡萄糖苷酶活性,并计算土壤碳库管理指数,旨在明晰不同林分类型下土壤有机碳库特征及其影响因子,以期为平原沙土区土壤碳库的提高和生态恢复提供理论依据。

    • 试验地位于江苏省丰县复新河中游(34°24′25″~34°56′27″N, 116°21′15″~116°52′03″E),属黄泛冲积平原,海拔34.5~48.2 m;属暖温带季风气候,四季分明,光照充足,雨量适中,雨热同期;春季天气多变,夏季高温多雨,秋季天高气爽,冬季寒潮频袭,无霜期200 d左右。年平均降水量630.4 mm,年平均气温15.3℃。试验地土壤以微碱性潮土为主[20],土壤湿润,土质分布均匀,周边区域以农业为主。主要乔木树种有杨树、柳树、泡桐(Paulownia tomentosa (Thunb.) Steud.)、构树(Broussonetia papyrifera (L.) L'Her. ex Vent.)、女贞(Ligustrum lucidum Ait.)等。

    2.   研究方法
    • 试验地为2006年河道整治形成的立地条件相近的防护林,宽约40 m,长约6 km。沿河道依次营造长约2 km林龄相同的杨树纯林、柳树纯林和杨柳混交林。杨树品种为“46-杨”,柳树品种为“苏柳172”,林龄16 a,初始营造密度均为500 株· hm−2。杨树纯林(PPP)、柳树纯林(WPP)、杨柳混交林(PWM)下皆有天然更新的灌木和草本,其中,灌木主要有枸杞(Lycium chinense Miller)、苎麻(Boehmeria nivea (L.) Gaudich.)等;草本植物主要有狗尾草(Setaria viridis (L.) Beauv.)、沼生水马齿(Callitriche palustris L.)等。试验地基本概况见表1

      林分类型
      Stand types
      平均胸径
      Mean DBH/cm
      平均树高
      Mean height/m
      郁闭度
      Canopy
      density
      凋落物厚度
      Litter
      thickness/
      cm
      细根生物量
      Fine root
      biomass/
      (t·hm−2)
      细根碳储量
      Fine root
      carbon stock/
      (t·hm−2)
      凋落物生物量
      Litter
      biomass/
      (t·hm−2)
      凋落物碳储量
      Litter
      carbon stock/
      (t·hm−2)
      杨树纯林 PPP28.8±1.616.8±0.60.92.28.69±0.55 A3.93±0.31 A12.89±0.01 A5.49±0.19 A
      柳树纯林 WPP14.9±2.37.2±0.40.41.34.66±0.63 B2.09±0.35 B8.85±2.61 B3.86±0.61 B
      杨柳混交林 PWM28.67±2.67(杨树)/
      18.43±1.72(柳树)
      17.84±0.41(杨树)/
      8.31±1.01(柳树)
      0.71.54.12±0.74 B1.69±0.35 B9.99±0.76 B4.35±0.19 AB
      撂荒地 CK0.21.14±0.04 C0.45±0.02 C2.86±1.38 C1.21±0.35 C
      注:表中的数据为“平均值±标准误”。不同大写字母表示不同林分之间差异显著(P<0.05)。下同。
       Notes: The data is “mean±standard error”. Capital case letters that differ indicate significant (P< 0.05) differences among stand types. The same below.

      Table 1.  Basic information of the sample plots

      采样时间为2022年3月。在每种林分类型分别设置3个间距大于300 m的面积为20 m × 20 m的标准样地,根据试验地踏勘情况,选择与3种林分类型相邻的以狗尾草等草本植物为主的立地条件相同的撂荒地为对照(CK),撂荒地同样设置3个远离林分边界的面积为20 m × 20 m的标准样地。在每个标准样地中按“S”型选取5个采样点,去除地表凋落物后挖取土壤剖面,每个剖面大小为1 m × 1.5 m × 1.2 m,分0~20、20~40、40~60、60~80、80~100 cm 5个土层分别采集土壤,将5个采样点同一土层的土壤混合成该标准样地的土壤样品。用镊子仔细去除土壤中的根系,过2 mm筛备用。将每个标准样地的土壤样品分为2份,一份作为鲜土保存在4 ℃冰箱中,用于土壤可溶性有机碳(DOC)、微生物生物量碳(MBC)和pH值的测定;另一份经自然风干过筛等处理后用于全碳(TC)、有机碳(SOC)、易氧化有机碳(EOC)、蔗糖酶、过氧化物酶、多酚氧化酶和β-葡萄糖苷酶及其它土壤理化性质的测定。使用内径9 cm、高20 cm的根钻,在5个采样点分5个土壤层次分别采集1份土芯,混合为一份装袋,带回实验室用0.2 mm细筛淘洗,筛选出直径<2 mm的细根。在每个标准样地中随机选取3个1 m × 1 m的小样方,收集各小样方地表凋落物混合为该标准样地的凋落物样。

    • 试验地土壤偏碱性,土壤、凋落物和细根的全碳和全氮含量采用元素分析仪(Vario ElementⅢ,Germany)测定,SOC采用重铬酸钾-外加热法测定;DOC经K2SO4浸提,采用TOC仪(TOC-VCPH + TNM-1, Shimazu Inc., Japan)测定;MBC用氯仿熏蒸-K2SO4提取法测定;EOC采用333 mmol·L−1高锰酸钾氧化法测定。土壤团聚体平均重量直径参考Elliot[21]湿筛法测定,其它土壤理化指标参照鲍士旦[22]的分析方法,容重和含水率用环刀法测定;细根生物量和凋落物生物量用烘干称量法测定;pH值用电位法(水土比为2.5:1)测定。

      土壤酶活性参考关松荫[23]的方法测定,蔗糖酶用3,5-二硝基水杨酸比色法测定;土壤过氧化物酶和多酚氧化酶以邻苯三酚为底物,用没食子素比色法测定;土壤β-葡萄糖苷酶用对硝基酚比色法测定。土壤基本理化性质见表2

      林分类型
      Stand types
      全碳
      TC content/
      (g·kg−1
      全氮
      TN content/
      (g·kg−1
      碳氮比
      C:N
      全磷
      TP content/
      (g·kg−1
      全钾
      TK content/
      (g·kg−1
      pH值土壤容重
      Bulk density
      /(g·cm−3)
      土壤含水率
      Water
      content/%
      平均重量直径
      Mean weight
      diameter/mm
      杨树纯林 PPP13.61±0.70 AB0.60±0.04 A25.67±0.70 B1.45±0.03 B18.68±0.62 B8.27±0.10 A1.64±0.03 A20.75±1.42 A0.71±0.08 A
      柳树纯林 WPP13.34±0.66 AB0.57±0.05 A29.97±1.04 B1.53±0.02 AB20.98±0.64 A8.39±0.04 A1.66±0.03 A20.09±1.40 A0.66±0.03 AB
      杨柳混交林 PWM13.97±0.74 A0.53±0.07 B26.60±1.39 B1.52±0.02 AB19.91±0.26 AB8.21±0.13 A1.64±0.03 A22.19±1.05 A0.52±0.01 BC
      撂荒地 CK12.49±0.48 B0.39±0.04 B46.40±3.65 A1.56±0.03 A20.16±0.23 AB8.09±0.02 A1.63±0.03 A23.94±1.25 A0.40±0.02 C
      注:土壤理化性质数据为0~20、20~40、40~60、60~80、80~100 cm 5个土层的平均值。
        Note: The data of soil physical and chemical properties were the average values in five soil layers (0-20, 20-40, 40-60, 60-80 and 80-100 cm).

      Table 2.  Physical and chemical properties of soil in the sample plots

    • 土壤有机碳储量(SOCS)计算公式如下:

      SOCS= SOC × ρ × h × (1-δ)/10

      式中:SOC为有机碳含量,ρ为土壤容重,h为土层厚度,δ为土壤砾石含量。

      根据Blair等[8]的方法,以撂荒地为对照进行碳库管理指数(CPMI)的计算,公式如下:

      CPMI=CPI × LI × 100%

      式中:碳库指数(CPI)=样品SOC/对照SOC

      碳库活度指数(LI)=样品碳库活度(L)/对照碳库活度(L)。

      L=EOC/(SOC-EOC)。

      用Excel 2019进行数据整理和CPMI的计算,用SPSS 21对数据进行统计分析。利用Shapiro-Wilk法检验方程残差分布的正态性,SOCS、MBC、CPMI、蔗糖酶、多酚氧化酶和β-葡萄糖苷酶等指标符合正态分布,SOC、EOC、DOC和过氧化物酶等采用对数转换,利用方差分析(ANOVA)和最小显著差异法(LSD)比较各指标间差异,双因素方差分析见表3。采用Pearson法和冗余分析(RDA)进行相关性分析;用Origin 2018软件进行统计图制作。

      指标
      Indicator
      林分类型
      Stand types
      土层
      Soil layers
      林分类型 × 土层
      Stand types × soil layers
      FPFPFP
      有机碳含量 SOC 27.015 <0.05 35.437 <0.05 1.478 0.173
      有机碳储量 SOCS 19.930 <0.05 45.566 <0.05 0.712 0.731
      易氧化有机碳 EOC 18.988 <0.05 30.684 <0.05 0.853 0.598
      可溶性有机碳 DOC 1.166 0.335 12.634 <0.05 0.568 0.854
      微生物生物量碳 MBC 20.276 <0.05 8.193 <0.05 0.661 0.777
      蔗糖酶活性 Invertase activity 4.550 <0.05 3.553 <0.05 0.809 0.639
      过氧化物酶活性 Peroxidase activity 1.364 0.268 4.701 <0.05 1.493 0.167
      多酚氧化酶活性 Polyphenol oxidase activity 23.941 <0.05 6.826 <0.05 1.150 0.350
      β-葡萄糖苷酶活性 β-Glucosidase activity 0.470 0.705 8.490 <0.05 0.853 0.598

      Table 3.  Effects of stand types and soil layer on SOC, labile fractions and enzyme activities
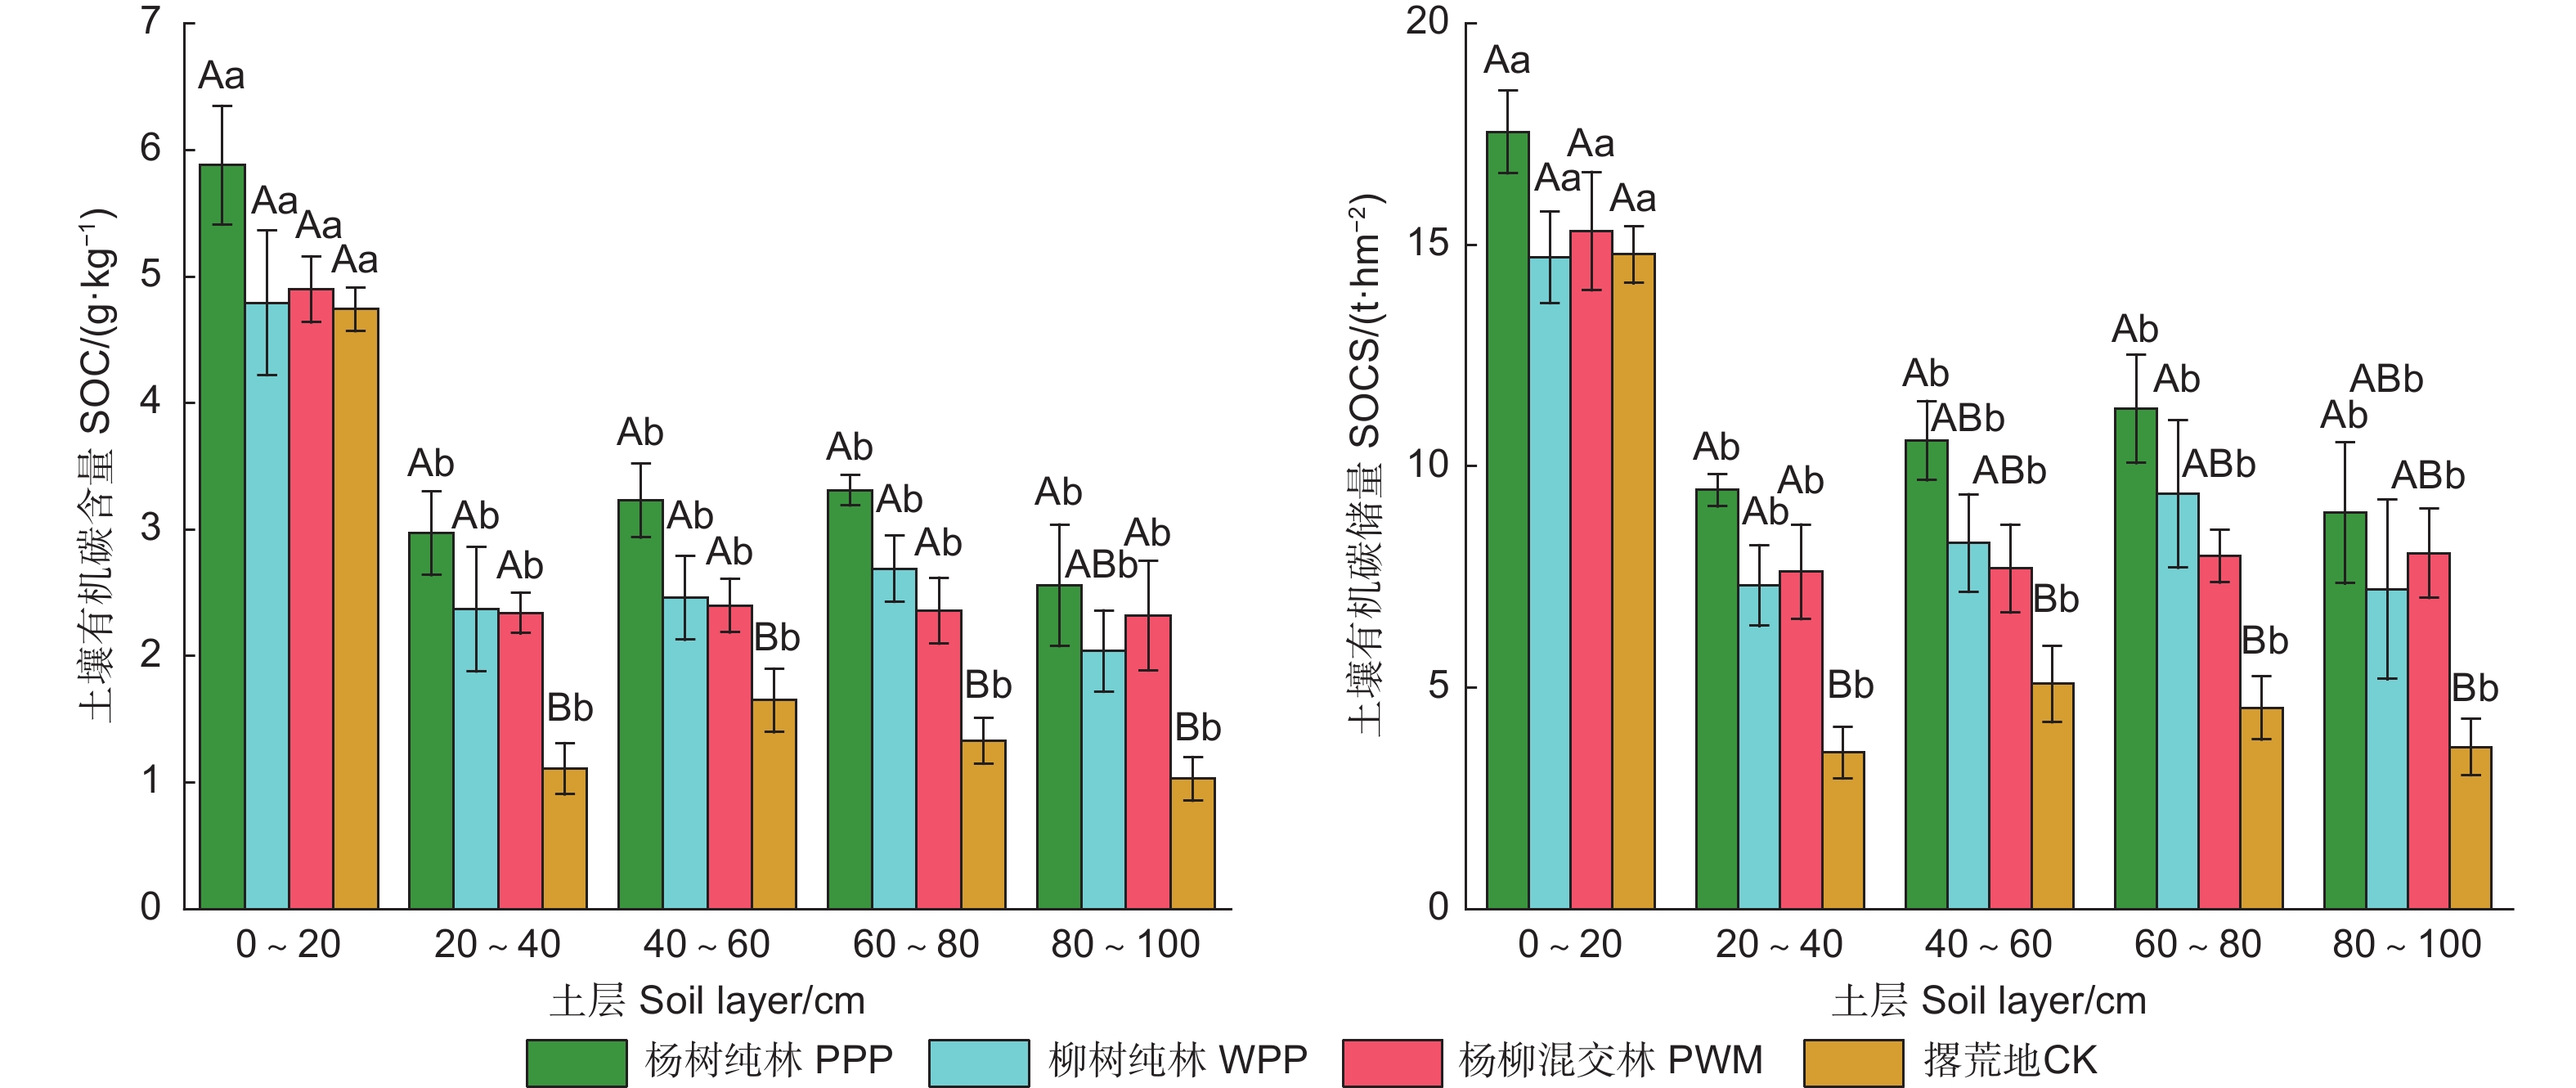
    3.   结果与分析
    • 图1可知:试验地3种林分类型和对照各土层SOC和SOCS范围分别为1.03~5.88 g·kg−1和3.53~17.55 t·hm−2,在不同林分类型和土层间差异显著(P<0.05)(表3)。3种林分类型0~100 cm土层的SOC和SOCS显著高于对照,分别增加了45.2%~82.2%和47.7%~83.1%,其中,杨树纯林SOC显著高于柳树纯林和杨柳混交林(表4)。在垂直分布上,SOC随土层加深而降低,0~20 cm土层的SOC显著高于20~100 cm各土层(P<0.05)。与柳树纯林、杨柳混交林和对照相比,杨树纯林0~20、20~40、40~60、60~80和80~100 cm土层SOCS分别增加了14.6%~19.2%、24.1%~168.1%、27.9%~108.1%、20.5%~149.2%和11.3%~144.4%;0~100 cm土层杨树纯林的SOCS分别是柳树纯林、杨柳混交林和对照的1.23、1.24、1.83倍。

      Figure 1.  SOC and SOCS in different soil layers under various stand types

      林分类型
      Stand types
      有机碳含量
      SOC/(g·kg−1
      有机碳储量
      SOCS/(t·hm−2
      易氧化有机碳
      EOC/(g·kg−1
      可溶性有机碳
      DOC/(mg·kg−1
      微生物生物量碳
      MBC/(mg·kg−1
      杨树纯林 PPP3.59 ± 0.20 A57.84 ± 1.80 A1.45 ± 0.08 A43.63 ± 1.27 A193.99 ± 5.78 A
      柳树纯林 WPP2.87 ± 0.33 B46.89 ± 5.49 A1.26 ± 0.03 A43.45 ± 2.05 A181.73 ± 2.08 A
      杨柳混交林 PWM2.86 ± 0.13 B46.65 ± 3.87 A1.39 ± 0.10 A42.46 ± 1.25 A176.89 ± 6.48 A
      撂荒地 CK1.97 ± 0.09 C31.59 ± 2.23 B0.98 ± 0.04 B39.77 ± 2.14 A145.44 ± 5.73 B
      注:土壤有机碳及活性组分数据为0~20、20~40、40~60、60~80、80~100 cm 5个土层的平均值。土壤有机碳储量为0~100 cm土层的总和。
        Notes: The data of SOC and labile fractions were the average values in five soil layers (0-20, 20-40, 40-60, 60-80 and 80-100 cm). The data of SOCS was the sum of 0-100 cm soil layer.

      Table 4.  The content of SOC and labile fraction in 0-100 cm soil layer under various stand types
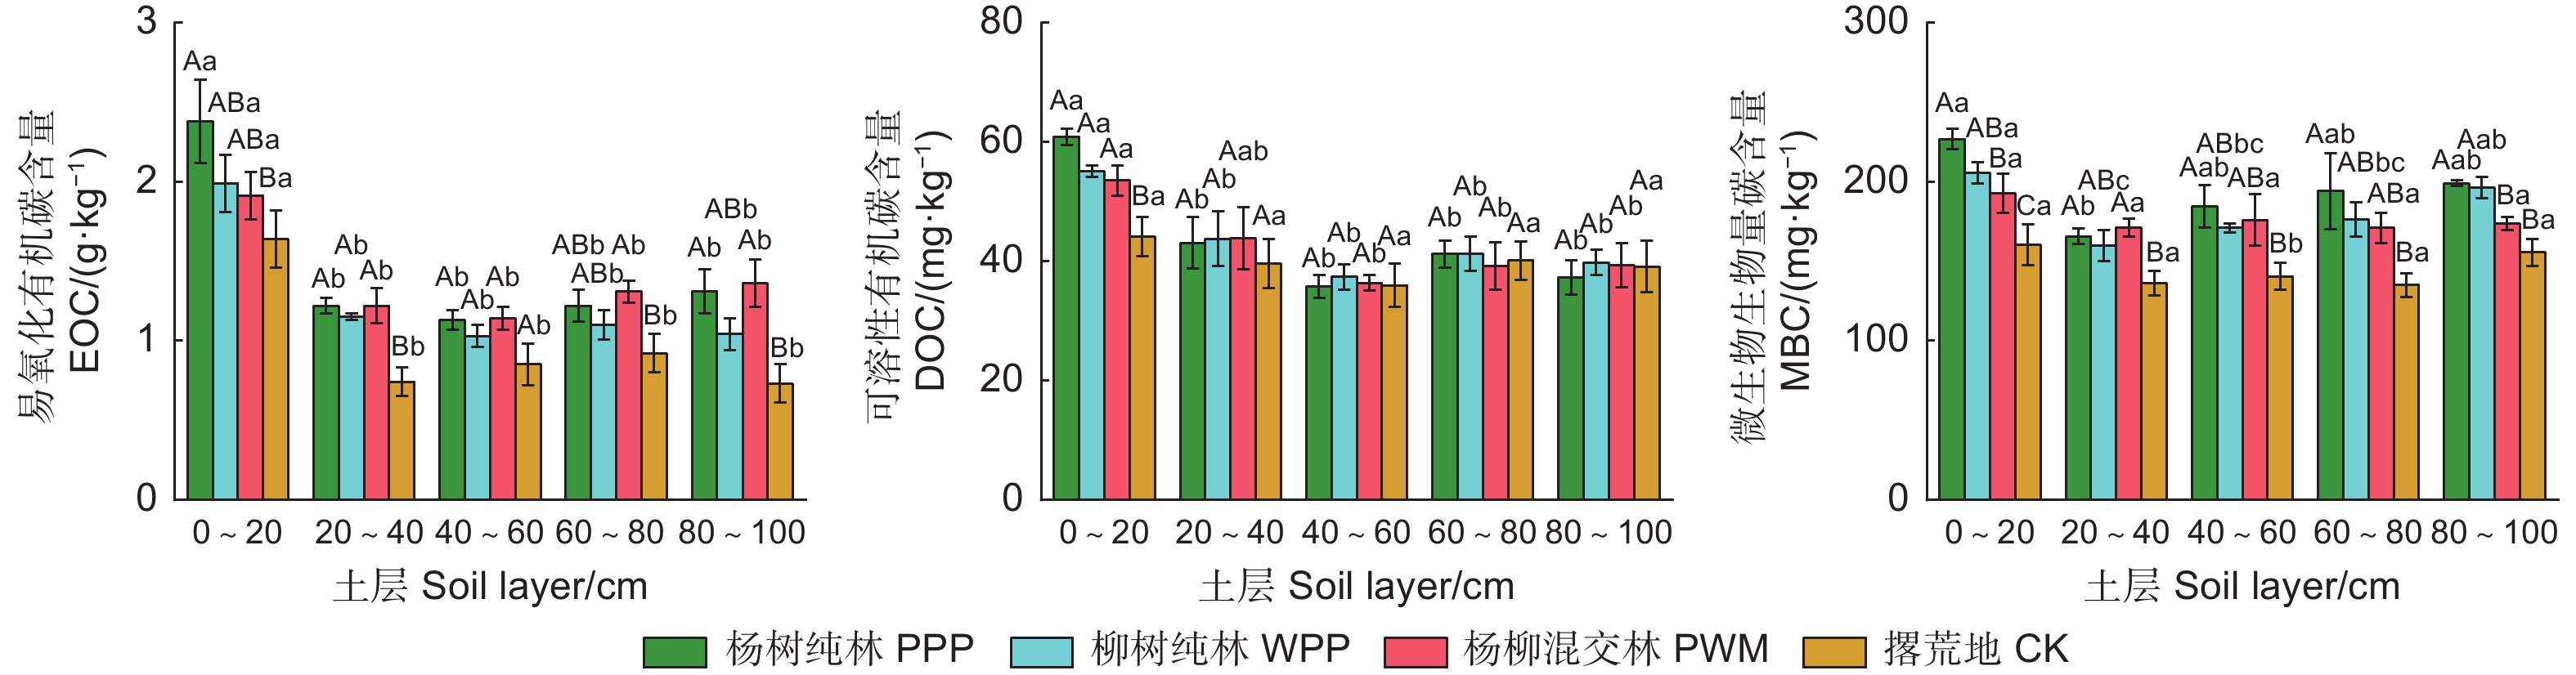
    • 图2可知:3种林分类型和对照不同土层的EOC、DOC和MBC范围分别为0.73~2.38 g·kg−1、35.96~62.53 mg·kg−1和134.94~226.84 mg·kg−1,EOC和MBC在不同林分类型和不同土层间差异显著(P<0.05),DOC仅在不同土层间差异显著(P<0.05)(表3)。在0~100 cm土层,3种林分类型的EOC和MBC均显著高于对照(P<0.05),杨树纯林、柳树纯林和杨柳混交林的EOC和MBC分别比对照平均提高了48.0%、28.6%、41.8%和33.4%、25.0%、21.6%(表4)。杨树纯林、柳树纯林、杨柳混交林0~20 cm土层的DOC显著高于对照(P<0.05),分别提高了37.9%、24.8%和21.3%。3种土壤活性有机碳组分含量在垂直分布上的规律相似,随土层深度增加呈先降低后微升趋势。

      Figure 2.  Distribution characteristics of labile SOC fraction content in different soil layers under various stand types

    • CMPI是基于对照土壤有机碳变化的稳定性指标,对照土壤的CMPI为100%。由图3可知:0~100 cm土层3种林分类型土壤的CPMI显著高于100%(P<0.05);0~20 cm土层CPMI为杨树纯林>柳树纯林>杨柳混交林,其中,杨树纯林显著高于杨柳混交林(P<0.05);40~100 cm土层杨柳混交林的CPMI显著高于杨树纯林和柳树纯林(P<0.05)。

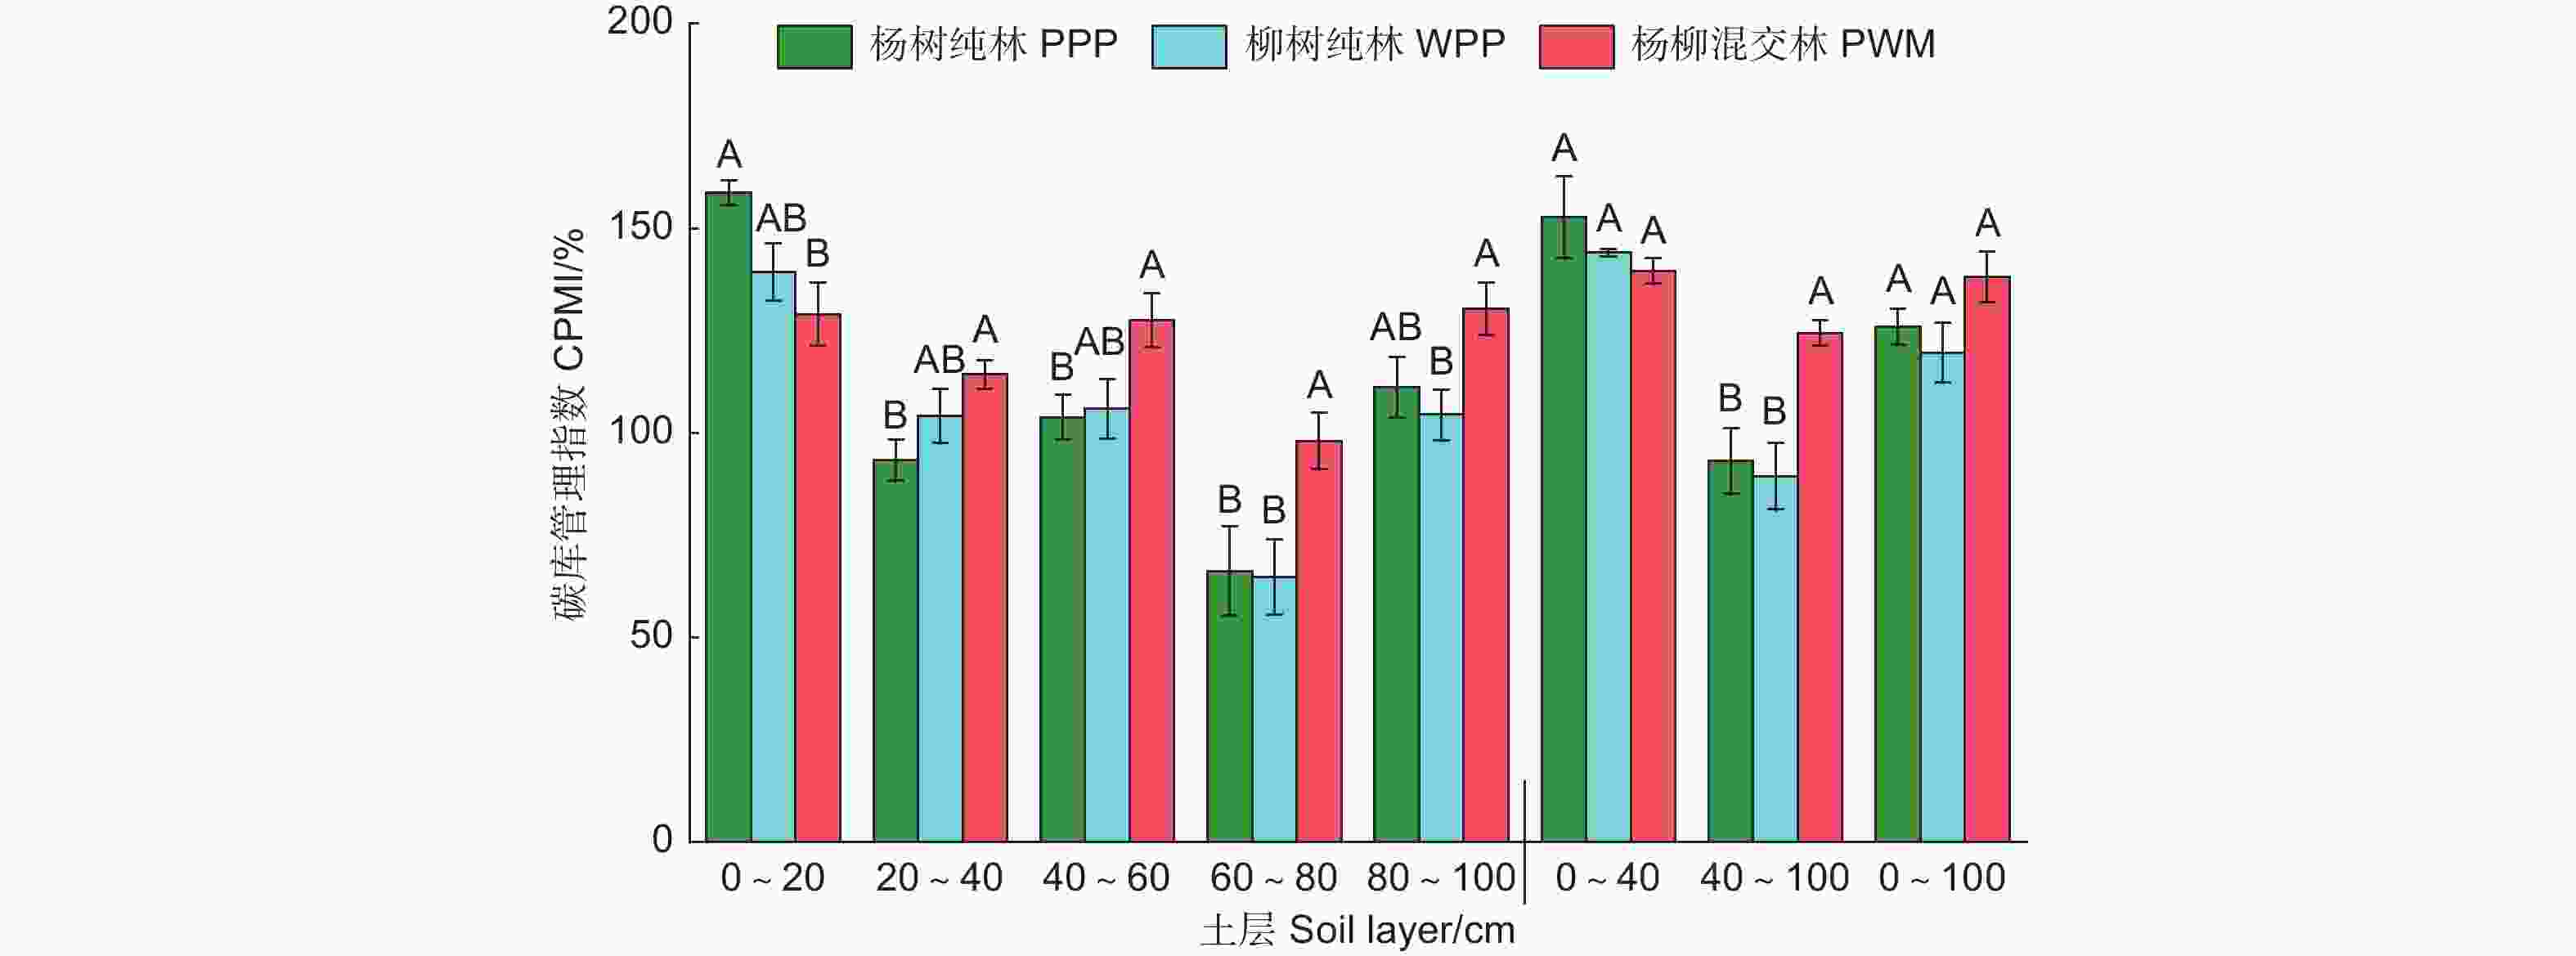
      Figure 3.  The CPMI of soil in different stand types

    • 表5可知:与杨树纯林、柳树纯林和对照相比,杨柳混交林0~100 cm土层过氧化物酶和多酚氧化酶的活性较高,其中,杨柳混交林过氧化物酶活性显著高于柳树纯林(P<0.05),提高了26.8%,多酚氧化酶的活性显著高于杨树纯林和对照(P<0.05),分别提高了32.8%和76.2%;杨柳混交林土壤蔗糖酶活性在80~100 cm土层显著高于杨树纯林(P<0.05);各土层β-葡萄糖苷酶活性在不同林分间差异不显著。除柳树纯林多酚氧化酶活性在20~40 cm土层最高,其余各林分的4种土壤酶活性均在0~20 cm土层最高,其中,杨柳混交林0~20 cm和40~60 cm土层的过氧化物酶活性显著高于80~100 cm土层(P<0.05),0~20 cm土层的β-葡萄糖苷酶活性显著高于40~100 cm各土层(P<0.05)。双因素方差分析表明:土层对蔗糖酶、过氧化物酶、多酚氧化酶和β-葡萄糖苷酶活性均有显著影响,林分类型仅显著影响蔗糖酶和多酚氧化酶的活性,林分类型和土层的交互作用对4种酶活性影响不显著(表3)。

      林分类型
      Stand types
      土层
      Soil layer/
      cm
      蔗糖酶活性
      Invertase activity/
      (mg·g−1·d−1
      过氧化物酶活性
      Peroxidase activity/
      (mg·g−1·d−1
      多酚氧化酶活性
      Polyphenol oxidase activity/
      (mg·g−1·d−1
      β-葡萄糖苷酶活性
      β-Glucosidase activity/
      (mg·g−1·d−1
      杨树纯林
      PPP
      0~2017.55±0.21 Aa11.74±0.59 Aa35.64±2.55 ABa10.93±1.34 Aa
      20~4016.51±0.50 Aab7.38±1.30 Aab32.98±3.07 Aab3.17±1.31 Ab
      40~6016.28±0.48 Aab4.82±0.44 Bb19.61±3.36 Bc5.12±0.65 Ab
      60~8015.99±0.42 Ab4.85±1.44 Ab18.13±3.77 Bc3.89±1.02 Ab
      80~10015.78±0.27 Bb6.64±1.92 Aab22.49±3.89 BCbc4.20±0.65 Ab
      0~10016.42±0.37 A7.09±0.33 AB25.77±1.32 B5.46±0.54 A
      柳树纯林
      WPP
      0~2016.79±0.46 Aa7.66±0.56 Ba35.39±3.14 ABa8.52±1.49 Aa
      20~4016.21±0.12 Aa4.92±0.15 Ba35.93±3.68 Aa4.76±1.59 Aa
      40~6016.14±0.40 Aa5.83±0.87 Aba29.77±3.62 ABa4.81±0.93 Aa
      60~8016.25±0.10 Aa6.44±1.30 Aa34.47±1.40 Aa6.15±0.72 Aa
      80~10016.28±0.17 ABa5.43±0.82 Aa30.60±1.00 ABa5.02±1.76 Aa
      0~10016.33±0.02 A6.05±0.41 B33.23±1.52 A5.85±0.22 A
      杨柳混交林
      PWM
      0~2017.07±0.34 Aa9.45±1.56 ABa39.35±3.68 Aa9.54±1.34 Aa
      20~4016.71±0.12 Aa6.17±0.68 ABab33.98±0.69 Aa6.77±1.65 Aab
      40~6017.00±0.42 Aa9.45±1.80 Aa34.04±3.20 Aa4.71±1.32 Ab
      60~8017.04±0.52 Aa8.36±1.98 Aab29.77±4.02 Aa4.92±0.97 Ab
      80~10016.64±0.04 Aa4.92±0.73 Ab33.95±2.68 Aa4.09±1.15 Ab
      0~10016.90±0.06 A7.67±0.69 A34.22±0.92 A6.01±0.68 A
      撂荒地
      CK
      0~2016.51±0.37 Aa8.23±0.90 ABa26.12±2.79 Ba6.87±1.13 Aa
      20~4015.99±0.25 Aa6.20±0.39 ABa20.18±4.02 Ba4.92±1.42 Aa
      40~6016.28±0.14 Aa7.93±1.04 ABa19.80±3.95 Ba5.64±1.44 Aa
      60~8016.09±0.12 Aa6.71±1.14 Aa14.51±1.53 Ba3.99±1.76 Aa
      80~10016.02±0.28 ABa6.20±0.42 Aa16.48±3.94 Ca4.20±1.47 Aa
      0~10016.18±0.23 A7.05±0.25 AB19.42±0.43 C5.12±0.24 A
      注:不同大写字母表示相同土层不同林分之间差异显著(P<0.05),不同小写字母表示相同林分不同土层之间差异显著(P<0.05)。
        Notes: Capital case letters that differ within same soil layers indicate significant (P< 0.05) differences among stand types, lower case letters that differ within same stand type indicate significant (P< 0.05) differences among soil layers.

      Table 5.  Soil enzyme activities in different stand types

    • 相关性分析结果(表6)表明:SOC、SOCS、EOC和CPMI与4种土壤酶均呈显著或极显著正相关,DOC与土壤多酚氧化酶和β-葡萄糖苷酶呈显著或极显著正相关,MBC与土壤蔗糖酶、多酚氧化酶和β-葡萄糖苷酶呈显著或极显著正相关。

      指标
      Index
      蔗糖酶活性
      Invertase activity
      过氧化物酶活性
      Peroxidase activity
      多酚氧化酶活性
      Polyphenol oxidase activity
      β-葡萄糖苷酶活性
      β-Glucosidase activity
      有机碳含量 SOC0.376**0.326*0.479**0.427**
      有机碳储量 SOCS0.376**0.379**0.387**0.484**
      易氧化有机碳 EOC0.418**0.382**0.564**0.461**
      可溶性有机碳 DOC0.2420.1940.327*0.383**
      微生物生物量碳 MBC0.284*0.0430.434**0.331**
      碳库管理指数 CPMI0.432**0.338**0.401**0.389**
      注:**表示极显著相关(P<0.01),*表示显著相关(P<0.05)。
        Note: **P<0.01, * P<0.05。

      Table 6.  Pearson correlations between characteristics of soil organic carbon pools and soil enzyme activity

    • 图4表明:在有机碳及活性组分和CPMI与环境因子的RDA中,第一轴和第二轴特征值分别为0.64和0.04,可累积解释其信息量67.31%,方差累积贡献率为99.88%。碳氮比和细根生物量对土壤有机碳及活性组分和CPMI的解释率分别为50.8%(P=0.002)和10.4%(P=0.004),表明碳氮比和细根生物量是土壤有机碳及活性组分和CPMI的显著影响因素。RDA中变量夹角的余弦值表示二者之间的相关性,因此,碳氮比与土壤有机碳及活性组分和CPMI呈负相关;细根生物量与土壤有机碳及活性组分和CPMI呈正相关。

      Figure 4.  The RDA analysis of characteristics of soil organic carbon pools and environmental factors

    4.   讨论
    • 营造人工林16 a后,与对照相比,平原沙土区3种林分类型增加了各土层的SOC,与Kukuls等[24]的结果一致。这主要归因于营造人工林增加了地表凋落物数量(表1),为土壤有机质积累提供丰富的来源。3种林分中杨树纯林的土壤SOCS最高。土壤SOCS的变化取决于地上地下凋落物、根瘤菌固定等有机质输入和有机质分解、淋溶及侵蚀等碳损失的平衡[25]。杨树是典型速生树种,适应能力强,提供了更多的凋落物和细根生物量(表1),直接增加了土壤有机质的输入源,促进杨树纯林土壤积累更多SOCS。

      各林分类型SOC和SOCS都具有明显的“表聚效应”,这与沈芳芳等[26]研究结果一致,这可能是因为凋落物分解输入的有机质集中在土壤表层,且植被根系主要分布于土壤表层[27]。有机质是土壤酶促底物的主要供源,本研究中土壤SOC和SOCS与4种酶活性呈极显著正相关(表6),表土层更高的酶活性(表5)证明了这一效应。与其他林分类型相比,20~80 cm土层,杨树纯林累积SOCS随土层加深逐渐升高。杨树具有发达的根系,提高了各土层有机质来源,也可能促进表层的DOC向下迁移[28],使其SOCS累积量逐渐升高。

    • DOC主要来源于根系的分泌物、植物凋落物的渗透物,从而易受土壤淋溶作用[29]。本研究中,3种林分类型有较多地表凋落物和发达根系,使0~20 cm土层的DOC显著高于对照。另外,沙质土壤因为缺乏对输入有机碳的物理保护作用[30],会导致土壤中DOC淋失,而表土层的有机质输入可以抵消这种淋失作用,因此,本研究中3种林分类型的DOC仅在表土层与对照差异显著。然而,各土层DOC在不同林分间无显著差异,有可能是因为营造人工林在提高了有机质输入和增加DOC含量的同时,也提高了酶活性(表5),使DOC经过土壤酶转化为MBC,从而降低了DOC,使得DOC在林分类型间差异不显著。

      本研究发现,造林可以提高土壤的MBC,这与Wang等[31]研究结果一致。在营造人工林后,一方面提高了凋落物数量和质量,增加了土壤SOC,为微生物提供了可直接利用的有机碳源[29];另一方面降低了土壤碳氮比,促进土壤微生物的生长,增加土壤MBC(表2图4)。另外,MBC的增加与土壤蔗糖酶和多酚氧化酶活性增加有关(表56),因为土壤酶是微生物活动的产物,其活性可以表征SOC分解转化为MBC的速率[32]。杨树纯林的MBC在表土层显著高于杨柳混交林,这是因为杨树纯林在造林16 a 后增加有机碳来源的同时,改善了林地光照和土壤通气性,通过更多的凋落物归还和较发达根系及其分泌物分解诱导形成的微生物区系[33],促进了表层土壤MBC的累积。随着土层深度增加,根系减少,土壤通气性下降,林分类型对表层以下土壤MBC影响降低,使得20~80 cm土层的MBC在林分间差异不显著。

      与对照相比,营造人工林后土壤EOC显著增加(表4)。人工林可以通过增加林冠截留和地表凋落物覆盖(表1),降低雨滴击溅侵蚀和地表径流冲刷,减少表层土壤扰动,避免EOC的分解转化,且造林后有机质的增加提高了团聚体的稳定性(表2),使EOC不易分解。杨树纯林土壤EOC较柳树纯林和杨柳混交林的高,但差异不显著,这可能取决于林分结构和树种特性。以往研究表明,凋落物分解速率一般在针叶树和阔叶树种间差异显著[25],进而影响微生物介导的有机碳循环过程[34]。杨树在凋落物数量上高于柳树(表1),可能在分解速率上无显著差异,导致EOC在林分间无显著差异。

      CPMI是表征SOC总库及其活性组分关系的指标[35],可以反映SOC在土壤中固存和矿化潜力[36]。营造人工林后CPMI值高于100%,说明造林可以提高沙土区SOC固存能力。这可能是因为人工林根系木质化程度更高,在提供根系分泌物和新鲜残体的同时,增加了木质素和纤维素等难降解大分子物质[37],导致非活性SOC的增加,从而提高土壤碳库稳定性。

    5.   结论
    • 在平原沙土区营造人工林可以显著提高0~100 cm土层的SOC和SOCS,且具有明显的“表聚效应”。杨树纯林具有较高的凋落物生物量和细根生物量,直接增加了土壤有机质的输入源,积累了更多SOCS。造林通过改变土壤碳氮比和酶活性显著提高土壤的EOC和MBC,但并未显著影响DOC。各林分类型土壤CPMI显著高于100%,表明营造人工林显著提高了土壤有机碳固存能力。因此,在平原沙土区营造人工林可以提高土壤有机碳及活性组分和有机碳库稳定性,杨树纯林提高土壤有机碳储量效果最好。

Reference (37)

Catalog

    /

    DownLoad:  Full-Size Img  PowerPoint
    Return
    Return