• 中国中文核心期刊
  • 中国科学引文数据库(CSCD)核心库来源期刊
  • 中国科技论文统计源期刊(CJCR)
  • 第二届国家期刊奖提名奖
Volume 31 Issue 1
Jul.  2019
Article Contents
Turn off MathJax

Citation:

Top Height Estimation for Mixed Spruce-fir-deciduous Over-logged Forests

  • Received Date: 2017-10-16
  • Objective The study aims to compare different top height estimation methods for site quality assessment with mixed spruce-fir-broadleaved over-logged forests as an example. Method Data were collected from 53 temporary sample plots in Jingouling Forest Farm, Wangqing Forestry Bureau, Jilin Province. The area of each circular plot is 600 m2. The height and age were measured for 6 dominant or co-dominant coniferous and broadleaved trees in a plot. Four top height estimation methods were examined which including the mean height of dominant coniferous trees (H1), the mean height of dominant broadleaved trees (H2), the mean height of six dominant trees (H3), and the mean height weighted by basal area proportion of coniferous and broadleaved tree species (H4). The correlations between top height estimations and stand variables including stand density, age, volume and productivity were analyzed. Result There were significant correlations among four top height estimations with the coefficients from 0.434 to 0.980. Significant differences were found between the pairs of H1-H2 and H3-H4, and H3 was very close to H4. All the top height estimations had medium correlation with stand volume (the correlation coefficients range from 0.358 to 0.577), but not significant with stand age and productivity. Stand density effects on top heights were also showed. Conclusion Top height estimations tested in the study is not an effective indicator of site productivity in mixed spruce-fir-deciduous over-logged forests. It is necessary to further find and validate new indices for site productivity assessment.
  • 加载中
  • [1]

    Skovsgaard J P, Vanclay J K. Forest site productivity:a review of the evolution of dendrometric concepts for even-aged stands[J]. Forestry, 2008, 81:13-31. doi: 10.1093/forestry/cpm041
    [2]

    Weiskittel A R, Hann D W, Kershaw Jr J A, et al. Forest Growth and Yield Modeling[M]. John Wiley & Sons.2011.
    [3]

    Helms J A. The Dictionary of Forestry[M]. Society of American Foresters.1998.
    [4]

    Sharma M, Amateis R L, Burkhart H E. Top height definition and its effect on site index determination in thinned and unthinned loblolly pine plantations[J]. Forest Ecology and Management, 2002, 168:163-175. doi: 10.1016/S0378-1127(01)00737-X
    [5] 孟宪宇.测树学[M].北京:中国林业出版社, 2013.

    [6]

    García O. Estimating top height with variable plot size[J]. Canadian Journal of Forest Research. 1998, 28:1509-1517 doi: 10.1139/x98-128
    [7]

    García O, Batho A. Top height estimation in Lodgepole Pine sample plots[J]. Western Journal of Applied Forestry, 2005, 20:64-68
    [8]

    Ritchie M, Zhang J, Hamilton T. Effects of stand density on top height estimation for Ponderosa pine[J]. Western Journal of Applied Forestry, 2012, 27:18-24.
    [9]

    Rennolls K. Top height:its definition and estimation[J]. The Commonwealth Forestry Review, 1978, 57:215-219.
    [10]

    Ochal W, Socha J, Pierzchalski M. The effect of the calculation method, plotsize, and stand density on the accuracy of top height estimation in Norway spruce stands[J].Forest, 2017, 10:498-505.
    [11] 赵美丽, 王才旺.林分优势高测定方法的探讨[J].内蒙古林业调查设计, 1994, 17(2):10-16.

    [12] 娄明华.吉林天然栎类阔叶混交林的立地生产力基础模型研究[D].北京: 中国林业科学研究院.2016.

    [13]

    Garet J, Raulier F, Pothier D, et al. Forest age class structures as indicators of sustainability in boreal forest:are we measuring them correctly?[J]. Ecol Indic, 2012, 23:202-210. doi: 10.1016/j.ecolind.2012.03.032
    [14]

    Bontemps J D, Bouriaud O. Predictive approaches to forest site productivity:recent trends, challenges and future perspective[J]. Forestry, 2014, 87(1):109-128. doi: 10.1093/forestry/cpt034
    [15]

    Del Río M, Pretzsch H, Alberdi I, et al. Characterization of the structure, dynamics, and productivity of mixed-species stands:review and perspectives[J]. European Journal of Forest Research, 2016, 135(1):23-49. doi: 10.1007/s10342-015-0927-6
    [16]

    Nigh G D. The geometric mean regression line:a method for developing site index conversion equations for species in mixed stands[J]. For Sci, 1995, 41:84-98.
  • 加载中
通讯作者: 陈斌, bchen63@163.com
  • 1. 

    沈阳化工大学材料科学与工程学院 沈阳 110142

  1. 本站搜索
  2. 百度学术搜索
  3. 万方数据库搜索
  4. CNKI搜索

Figures(3) / Tables(2)

Article views(4454) PDF downloads(642) Cited by()

Proportional views

Top Height Estimation for Mixed Spruce-fir-deciduous Over-logged Forests

  • 1. Research Institute of Forest Resource Information Techniques, Chinese Academy of Forestry, Beijing 100091, China
  • 2. Central South University of Forestry and Technology, Changsha 410004, Hu'nan, China

Abstract:  Objective The study aims to compare different top height estimation methods for site quality assessment with mixed spruce-fir-broadleaved over-logged forests as an example. Method Data were collected from 53 temporary sample plots in Jingouling Forest Farm, Wangqing Forestry Bureau, Jilin Province. The area of each circular plot is 600 m2. The height and age were measured for 6 dominant or co-dominant coniferous and broadleaved trees in a plot. Four top height estimation methods were examined which including the mean height of dominant coniferous trees (H1), the mean height of dominant broadleaved trees (H2), the mean height of six dominant trees (H3), and the mean height weighted by basal area proportion of coniferous and broadleaved tree species (H4). The correlations between top height estimations and stand variables including stand density, age, volume and productivity were analyzed. Result There were significant correlations among four top height estimations with the coefficients from 0.434 to 0.980. Significant differences were found between the pairs of H1-H2 and H3-H4, and H3 was very close to H4. All the top height estimations had medium correlation with stand volume (the correlation coefficients range from 0.358 to 0.577), but not significant with stand age and productivity. Stand density effects on top heights were also showed. Conclusion Top height estimations tested in the study is not an effective indicator of site productivity in mixed spruce-fir-deciduous over-logged forests. It is necessary to further find and validate new indices for site productivity assessment.

  • 林分优势高是一个重要的林学参数,它可用于计算地位指数进行立地质量评价、生长收获预估及划分森林发展阶段等[1-2]。但关于林分优势高的定义及测定标准并不一致,如美国定义为优势或亚优势木的平均高,实际中采用每公顷100株最粗的树木的平均高来表示,欧洲采用每公顷100株最粗的树木或林分中20%的最粗树木的平均高[3-4]。我国的森林资源调查中不含林分优势高的内容,在《测树学》中给出的定义为林分中所有优势或亚优势木高度的算术平均数,调查时可以选择3~5株最高或胸径最大的立木的树高的算术平均值[5]。一般基于单位面积的一定数量(每公顷100株)的最粗或最高的树木树高的平均值来表示。对于同龄林,通常认为林分优势高的生长受林分密度的影响很小。但研究也发现它受到样地大小、计算方法和密度的影响[4, 6-11]。异龄混交林已经成为一种重要的营林体制,但混交林的立地生产力仍然面临许多挑战。关于混交林优势高的估计研究较少[12],缺少其用于立地质量评价的检验与验证。本研究以东北过伐林区云冷杉阔叶混交林为对象,基于实测样地调查数据,比较分析不同的林分优势高计算方法,检验他们和林分生产力的关系,为混交林的立地质量评价提供参考。

1.   研究地点概况
  • 研究区位于吉林省汪清林业局金沟岭林场(130°05′~130°20′ E,43°17′~43°25′ N)。属长白山系老爷岭山脉雪岭支脉,海拔550~1 100 m。该研究区地处北温带季风区,属大陆性季风型气候,全年平均气温约3.9℃,1月份气温最低,平均在-32℃左右;7月份气温最高,平均在32℃左右。年降水量600~700 mm,且多集中在7月份;植物生长期为120 d左右;山地土壤类型以暗棕壤为主。是过伐林的一个典型代表。

2.   数据与方法
  • 样地调查于2014年9月在云冷杉阔叶混交林进行。在林场范围内,选择不同立地条件和密度的林分作为调查对象。样地为圆形,面积600 m2,共调查样地60个。样地调查因子包括:地理位置、海拔、坡向、坡度、坡位、胸径5 cm以上树木的胸径、林木分级、郁闭度。在每个样地,选择6株优势木或亚优势木,用超声波测高器测定树高,并用生长锥在胸径处取样,查数每株树的年龄。其中优势木或亚优势样木株数在不同树种的分配根据树种组成确定,但每个样地都需包括云冷杉和阔叶树。对于比较均质、地势平坦的林分,在样地内选择最高的优势木和平均木;对于坡度较大、地形起伏的样地,要在上、中、下坡分别选取2株样木。最终选择符合云冷杉针阔混交林(针叶和阔叶组成都不到65%)并删除年龄测量误差较大的样地,共得到有效样地53个,测高和年龄样木318株。林分组成树种有臭冷杉(Abies nephrolepis(Trautv.) Maxim.)、鱼鳞云杉(Picea jezoensisvar. microsperma(Lindl.)Cheng et L.K.Fu)、红松(Pinus koraiensis Siebold et Zuccarini)、红皮云杉(Picea koraiensis Nakai)、长白落叶松(Larix olgensis Henry)、大青杨(Populu sussuriensis Kom.)、白桦(Betula platyphylla Suk.)、枫桦(Betula costata Trautv.)、紫椴(Tilia amurensis Rupr.)、色木(Acer mono Maxim.)、黄菠萝(Phellodendron amurense Rupr.)、水曲柳(Fraxinus mandschurica Rupr.)和榆树(Ulmus pumila Linn.)等。样地基本统计量见表 1

    因子Stand variable 平均值
    Mean
    最大值
    Max
    最小值
    Min
    标准差
    SD
    林分断面积BA/(m2·hm-2)
    Basal area
    33.4 46.1 19.6 5.9
    林分株数N/(株·hm-2)
    Stem number
    991 1 533 400 263
    林分密度指数SDI/(株·hm-2)
    Stand density index
    730 990 434 122
    样木高/m
    Sample tree height
    25.6 33.8 17.8 2.7
    样木年龄/a
    Sample tree age
    63 165 30 20
    林分生产力/(m3·hm-2·a-1)
    Stand productivity
    4.6 7.2 2.9 1.0

    Table 1.  Summary statistics of sample plots

  • 采用以下4种方法估算林分优势高:

    (1) 针叶树优势木或亚优势木高的平均值(H1)

    (2) 阔叶树优势木或亚优势木高的平均值(H2)

    (3) 6株样木的算术平均值(H3)

    (4) 6株样木的断面积加权林分优势高平均值(H4)

    h1ih2i分别为云冷杉和阔叶树的优势或亚优势木样木的树高,n1n2分别为云冷杉和阔叶树的样木株数,n1+n2=6,w1w2分别为云冷杉和阔叶树的断面积权重。

    林分优势高用于计算地位指数的前提主要包括与林分蓄积的强相关性、受林分密度的影响较小等,因此本研究主要通过4种方法得到优势高间的相关性、与林分优势年龄的关系、是否受林分密度的影响来进行比较分析。为了比较4种方法的优势高差异,以断面积加权林分优势高H4为基准,计算其它3种方法与H4的差值。由于在异龄林中,林分年龄常常用优势木的平均年龄来表示[13],本研究中的林分生产力采用林分蓄积量与优势年龄的比来计算。

3.   结果与分析
  • 从数据的分布来看(图 1),4种不同林分优势高的中位数有一定差异,除H1外,其它3种林分优势高的分布更加集中;且H2H3中出现了异常值。相关分析结果表明(表 2),4种不同的林分优势高有显著的相关性,相关系数在0.434~0.980,最小的是H1-H2,最大的是H3-H4。其它3种方法得到的林分优势高与H4的差值在-3.75~4.62 m之间(图 2),H2与其它3种的差别最大,H3H4的值最接近。另外从单木优势高的分布看,针叶树树高的分布更加分散,针叶树和阔叶树的中位数和平均值比较接近,前者均值略大于后者。

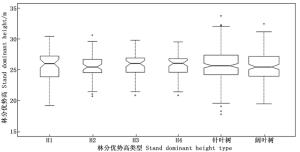
    Figure 1.  Boxplot of top height estimations

    变量Variable H1 H2 H3 H4 V SDI N BA SP
    H1 1 0.434(**) 0.918(**) 0.929(**) 0.545(**) 0.268 -0.306(*) 0.430(**) 0.181
    H2 0.434(**) 1 0.741(**) 0.691(**) 0.358(**) 0.221 -0.218 0.326(*) 0.242
    H3 0.918(**) 0.741(**) 1 0.980(**) 0.555(**) 0.296(*) -0.313(*) 0.458(**) 0.234
    H4 0.929(**) 0.691(**) 0.980(**) 1 0.577(**) 0.295(*) -0.334(*) 0.468(**) 0.232
    V 0.545(**) 0.358(**) 0.555(**) 0.577(**) 1 0.855(**) 0.080 0.965(**) 0.664(**)
    SDI 0.268 0.221 0.296(*) 0.295(*) 0.855(**) 1 0.572(**) 0.956(**) 0.657(**)
    N -0.306(*) -0.218 -0.313(*) -0.334(*) 0.080 0.572(**) 1 0.308(*) 0.199
    BA 0.430(**) 0.326(*) 0.458(**) 0.468(**) 0.965(**) 0.956(**) 0.308(*) 1 0.692(**)
    **P<0.01, *P<0.05。

    Table 2.  Correlation coefficients of top height estimations and stand variables

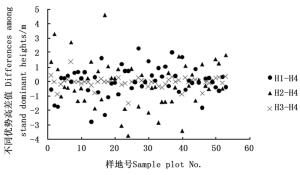
    Figure 2.  Differences among alternative stand dominant heights

  • 4种不同林分优势高与林分蓄积量(V)都有极显著的中等相关性(表 2),最小的是H2,最大的为H4,但H1H3H4与林分蓄积量的相关性非常接近。4种不同林分优势高与林分生产力(SP)的关系不显著。

  • 通常认为,同龄林的优势高(生长)不受林分密度的影响。本研究中的云冷杉异龄林,三类林分密度指标对优势高的影响表现并不一致(表 2)。对于林分株数,除H2外,其它3种林分优势高均与其呈现显著负相关,即林分优势高随林分株数的增加而降低,但相关程度较弱,相关系数在-0.306~-0.334;对于林分密度指数,只有H3H4与其呈现显著正相关,即林分优势高随林分密度指数的增加而增加,相关程度同样较弱,相关系数分别为0.296和0.295;对于林分断面积,4种林分优势高与其呈显著正相关,即林分优势高随林分断面积的增加而增加,相关系数在0.326~0.468之间。

  • 由于林分优势高与年龄的关系是地位指数的基础,本研究也检验了4种林分优势高与林分优势年龄的关系。从图 3可以看出,林分优势高与林分年龄的关系很弱,用常用的生长方程(单分子方程、Gompertz方程、Richards方程和Logistic方程等)进行拟合,发现决定系数R2均小于0.15。进一步检验针叶和阔叶单株优势木高与年龄的关系(h1-age1, h2-age2),结果类似。因此,高与年龄表现出较弱的相关性。

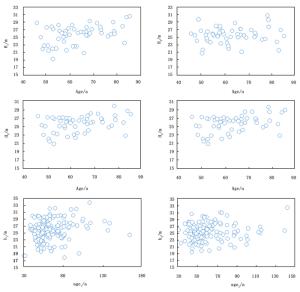
    Figure 3.  Scatterplots of top height estimations and ages

4.   讨论
  • 基于林分优势高的地位指数,已经成为评价同龄林立地质量的一种主流方法。应用该方法的前提主要包括林分优势高与蓄积的高度相关性、优势高的生长受林分密度的影响很小等[1]。虽然也有研究发现林分优势高受到密度的影响[10, 14],尤其是喜光树种,但地位指数仍是一种广泛应用的方法。按固定比例选择一定数量的优势木来估计优势高成为一种通用的做法,但也由于“抽样效应”和“空间自相关效应”而产生偏差[6]。Sharma等[4]比较了7种不同的林分优势高定义对火炬松(Pinus taeda Linn.)人工林地位指数的影响,发现采用在林分整个生命过程中一直为优势或亚优势木的个体的平均高来估计地位指数最为准确。

    对于异龄混交林的林分优势高目前尚无统一的定义和方法,已有的研究包括采用不分树种的优势木、考虑树种的断面积计算优势高[15]等。实际上,在复杂的林分中,很难给出可操作的定义。本研究以云冷杉阔叶混交林为对象,按每公顷100株优势或亚优势木的标准分别针、阔叶树实测6株样木,比较了4种估计方法,发现4种方法得到的林分优势高有显著的相关性,但单用针叶或阔叶得到的优势高与二者平均高的差别较大,算术及加权平均方法的结果非常接近。4种方法得到的林分优势高与林分蓄积量具有中等的相关性,但受到林分密度的显著影响,这与同龄林的部分结果一致[4]。娄明华[12]比较了蒙古栎(Quercus mongolica Fisch.ex Ledeb.)阔叶混交林按不同树种数和平均方法产生的8种林分优势高的差异,发现不分树种优势木算术平均高与分树种算术平均高之间的差异大于分树种断面积加权优势平均高间的差异。本研究中林分优势高与年龄的关系很弱,可能的原因包括:(1)年龄和树高的测量误差;(2)由于采用临时样地,选择的优势或亚优势样木并不一直处于优势或亚优势状态,一些耐荫树种如云冷杉等可能在幼龄时处于被压状态;(3)不同立地类型下优势高的生长过程不同。林分优势高与林分生产力无显著相关性,可能是由于生产力采用林分蓄积量与林分优势年龄的比值。虽然也有学者指出对于混交林可以分树种计算地位指数或树种间地位指数转换方法[16],但对于2个以上的多树种混交林存在确定优势木、测定年龄等耗费时间调查等诸多问题,如本研究中部分样地最多的组成树种为10个,很难对每个树种采用这种方法。且混交林中优势木的生长与纯林中的并不一致,这种方法往往忽略了树种间的混交效应。实际上,随着林分的发育和演替,以前受压的树种会超过其它树种成为上层木。受数据所限,本研究并未能检验不同样地大小、不同树种个数的优势木对林分优势高的影响。但总的来说,对于混交林的立地生产力评价仍然是一个挑战。理想的立地生产力指标应该满足以下3个原则[16]:(1)与年龄或年龄结构无关;(2)能描述立地特征;(3)与总的生物量相关且能反映混交效应即与树种组成相关。本研究中虽然都是云冷杉和阔叶树种组成的针阔混交林,但各树种的成数差别较大,因此如何划分相对同质的混交林类型,使其具有相对一致的生长过程是下一步要做的工作。

5.   结论
  • 对53块云冷杉阔叶混交林样地的4种优势高估计方法的分析表明,4种方法得到的林分优势高有显著的相关性,但单用针叶或阔叶得到的优势高与二者平均高的差别较大,算术及加权平均方法的林分优势高非常接近;4种方法得到的林分优势高与林分蓄积量具有中等的相关性,但受到林分密度的显著影响;林分优势高与年龄和生产力的关系很弱,与林分蓄积量有中等的显著相关性。因此,从立地质量评价的角度,对于云冷杉阔叶异龄混交林,林分优势高可能不是一个合适的立地生产力指标,但仍需要更多的验证并发展新的混交林立地质量评价指标。

Reference (16)

Catalog

    /

    DownLoad:  Full-Size Img  PowerPoint
    Return
    Return