• 中国中文核心期刊
  • 中国科学引文数据库(CSCD)核心库来源期刊
  • 中国科技论文统计源期刊(CJCR)
  • 第二届国家期刊奖提名奖
Volume 31 Issue 2
Jul.  2019
Article Contents
Turn off MathJax

Citation:

Height-Diameter Models of Main Tree Species in Broadleaf-Conifer Mixed Forest in Jiaohe, Jilin, China

  • Objective The aim of this study is to establish the relationships between height and diameter at breast height (DBH) of main tree species under different competitive density in mixed broadleaf-conifer forests in Jiaohe of Jilin province. Method Based on the data of four tree species sampled from a 42 hm2 permanent mature forest plot, the relationships between height and DBH were simulated by four empirical models, Chapman-Richards, Logistic, Korf and Weibull model, to select the optimization model. Result (1) Among 12 groups of samples, 7 groups were best modeled by Weibull model, 4 groups were best modeled by Chapman-Richards model, and only 1 group was best modeled by Korf model. (2) The optimization models simulated by individuals under low and high competitive density were different. (3) The optimization model worked well when examined by independent samples. Conclusion The height-DBH relationships of 4 tree species under different competitive density can be well simulated by Weibull model, which is suitable for height-DBH relationships in mixed broadleaf-conifer forest. In addition, the relationships are affected by competitive density. The predictive ability will be improved by grouping individuals according to the competitive density.
  • 加载中
  • [1]

    Molto Q, Hérault B, Boreux J J, et al. Predicting tree heights for biomass estimates in tropical forests-a test from French Guiana[J].Biogeosciences, 2014, 11(12):3121-3130. doi: 10.5194/bg-11-3121-2014
    [2]

    Lei X, Yu L, Hong L. Climate-sensitive integrated stand growth model (CS-ISGM) of Changbai larch (Larix olgensis) plantations[J].Forest Ecology & Management, 2016, 376:265-275.
    [3]

    Colbert K C, Larsen D R, Lootens J R. Height-diameter equations for thirteen midwestern bottomland hardwood species[J].Northern Journal of Applied Forestry, 2002, 19(4):171-176.
    [4]

    Huang S M, Price D, Titus S J. Development of ecoregion-based height-diameter models for white spruce in boreal forests[J].Forest Ecology & Management, 2000, 129(1):125-141.
    [5] 惠刚盈, 盛炜彤.Sloboda树高生长模型及其在杉木人工林中的应用[J].林业科学研究, 1996, 9(1):37-40.

    [6]

    Fang Z, Bailey R L. Height-diameter models for tropical forests on Hainan Island in southern China[J].Forest Ecology & Management, 1998, 110(1-3):315-327.
    [7]

    Fekedulegn D, Siurtain M P M, Fekedulegn J J C, et al. Parameter estimation of nonlinear growth models in forestry[J]. Silva Fennica, 1999, 33(4):327-336.
    [8]

    Temesgen H, Gadow K V. Generalized height-diameter models-an application for major tree species in complex stands of interior British Columbia[J].European Journal of Forest Research, 2004, 123(1):45-51. doi: 10.1007/s10342-004-0020-z
    [9] 卢军, 张会儒, 雷相东, 等.长白山云冷杉针阔混交林幼树树高——胸径模型[J].北京林业大学学报, 2015, 37(11):10-25.

    [10]

    Lappi J. A longitudinal analysis of height/diameter curves[J].Forest Science, 1997, 43(4):555-570.
    [11]

    Eerikäinen K. Predicting the height-diameter pattern of planted Pinus kesiya, stands in Zambia and Zimbabwe[J].Forest Ecology & Management, 2003, 175(1-3):355-366.
    [12]

    Temesgen H, Zhang C H, Zhao X H. Modelling tree height-diameter relationships in multi-species and multi-layered forests:A large observational study from Northeast China[J].Forest Ecology & Management, 2014, 316(316):78-89.
    [13]

    Moore J A, Zhang L, Stuck D. Height-diameter equations for ten tree species in the inland Northwest[J].Western Journal of Applied Forestry, 1996, 11(4):132-137.
    [14]

    Peng C H. Nonlinear height-diameter models for nine boreal forest tree species in Ontario[R].Forest Research Report Ontario Forest Research Institute, 1999.
    [15]

    Ariasrodil M, Diéguezaranda U, Puerta F R, et al. Modelling and localizing a stem taper function for Pinus radiata in Spain[J].Canadian Journal of Forest Research, 2015, 45(6):647-658. doi: 10.1139/cjfr-2014-0276
    [16] 史元春, 赵成章, 宋清华, 等.兰州北山侧柏株高与冠幅、胸径异速生长关系的坡向差异性[J].生态学杂志, 2015, 34(7):1879-1885.

    [17]

    Canham C D, Papaik M J, Uriarte M, et al. Neighborhood analyses of canopy tree competition along environmental gradients in New England forests[J].Ecological Applications, 2006, 16(2):540-54. doi: 10.1890/1051-0761(2006)016[0540:NAOCTC]2.0.CO;2
    [18]

    Biging G S, Dobbertin M. A comparison of distance-dependent competition measures for height and basal area growth of individual conifer trees[J].Forest Science, 1992, 38(3):695-720.
    [19]

    Fredericksen T S, Zedaker S M, Seiler J R. Interference interactions in simulated pine-hardwood seedling stands[J].Forest Science, 1993, 39(2):383-395.
    [20] 张跃西.邻体干扰模型的改进及其在营林中的应用[J].植物生态学与地植物学学报, 1993, 17(4):352-357. doi: 10.3321/j.issn:1005-264X.1993.04.005

    [21] 黄小波, 刘万德, 苏建荣, 等.云南松天然林的种内和种间竞争[J].林业科学研究, 2016, 29(2):209-215. doi: 10.3969/j.issn.1001-1498.2016.02.009

    [22] 赵俊卉, 亢新刚, 张慧东, 等.长白山主要针叶树种胸径和树高变异系数与竞争因子的关系[J].应用生态学报, 2009, 20(8):1832-1837.

    [23] 姜俊, 张春雨, 赵秀海.吉林蛟河42hm2针阔混交林样地植物种-面积关系[J].植物生态学报, 2012, 36(1):30-38.

    [24] 马履一, 王希群, MALu-yi, 等.生长空间竞争指数及其在油松、侧柏种内竞争中的应用研究[J].生态科学, 2006, 25(5):385-389. doi: 10.3969/j.issn.1008-8873.2006.05.001

    [25]

    Hegyi F. A simulation model for managing jack-pine stands[M]//Fries J. Growth Models for Tree and Stand Simulation. Stockholm: Royal College of Forestry, 1974: 74-90.
    [26]

    Richards F J. A flexible growth function for empirical use[J].Journal of Experimental Botany, 1959, 10(2):290-301. doi: 10.1093/jxb/10.2.290
    [27]

    Chapman D G. Statistical problems in dynamics of exploited fisheries populations[M]//Newman J. Mathematical Statistics and Probability. University of California Press Berkeley pp, 1961: 153-168.
    [28]

    Zeide B. Analysis of growth equations[J].Forest Science, 1993, 39(3):594-616. doi: 10.1093/forestscience/39.3.594
    [29]

    Stage A R. A mathematical approach to polymorphic site index curves for grand fir[J].Forest Science, 1963, 9(2):167-180.
    [30]

    Zeide B. Accuracy of equations describing diameter growth[J].Canadian Journal of Forest Research, 1989, 19(19):1283-1286.
    [31]

    Yang R C, Kozak A, Smith J H G. The potential of Weibull-type functions as flexible growth curves[J].Canadian Journal of Forest Research, 1978, 8(4):424-431. doi: 10.1139/x78-062
    [32] 曾伟生, 骆期邦, 贺东北.论加权回归与建模[J].林业科学, 1999, 35(5):5-11. doi: 10.3321/j.issn:1001-7488.1999.05.002

    [33]

    Krisnawati H, Wang Y, Ades P K. Generalized height-diameter models for Acacia mangium Willd. plantations in south sumatra[J].Praxis, 2010, 98(21):1219-24.
    [34] 符利勇, 孙华.基于混合效应模型的杉木单木冠幅预测模型[J].林业科学, 2013, 49(8):65-74.

    [35]

    Peng C, Zhang L, Liu J. Developing and validating nonlinear height-diameter models for major tree species of Ontario's boreal forests[J].Northern Journal of Applied Forestry, 2001, 18(3):87-94.
    [36] 李海奎, 法蕾.基于分级的全国主要树种树高-胸径曲线模型[J].林业科学, 2011, 47(10):83-90. doi: 10.11707/j.1001-7488.20111013

    [37]

    Zeide B, Vanderschaaf C. The effect of density on the height-diameter relationship[C]//Outcalt K W. Proceedings of the 11th Biennial Southern Silvicultural Research Conference. General Technical Report SRS-48, Knoxville, Mar 19-22, 2002: 463-466.
    [38] 庄崇洋, 黄清麟, 马志波, 等.典型中亚热带天然阔叶林各林层树高胸径关系研究[J].林业科学研究, 2017, 30(3):479-485.

    [39]

    Wang X, Fang J, Tang Z, et al. Climatic control of primary forest structure and DBH——height allometry in Northeast China[J].Forest Ecology & Management, 2006, 234(1):264-274.
  • 加载中
通讯作者: 陈斌, bchen63@163.com
  • 1. 

    沈阳化工大学材料科学与工程学院 沈阳 110142

  1. 本站搜索
  2. 百度学术搜索
  3. 万方数据库搜索
  4. CNKI搜索

Figures(2) / Tables(5)

Article views(4254) PDF downloads(597) Cited by()

Proportional views

Height-Diameter Models of Main Tree Species in Broadleaf-Conifer Mixed Forest in Jiaohe, Jilin, China

    Corresponding author: ZHAO Xiu-hai, zhaoxh@bjfu.edu.cn
  • Key Laboratory for Forest Resources & Ecosystem Processes of Beijing, Beijing Forestry University, Beijing 100083, China

Abstract:  Objective The aim of this study is to establish the relationships between height and diameter at breast height (DBH) of main tree species under different competitive density in mixed broadleaf-conifer forests in Jiaohe of Jilin province. Method Based on the data of four tree species sampled from a 42 hm2 permanent mature forest plot, the relationships between height and DBH were simulated by four empirical models, Chapman-Richards, Logistic, Korf and Weibull model, to select the optimization model. Result (1) Among 12 groups of samples, 7 groups were best modeled by Weibull model, 4 groups were best modeled by Chapman-Richards model, and only 1 group was best modeled by Korf model. (2) The optimization models simulated by individuals under low and high competitive density were different. (3) The optimization model worked well when examined by independent samples. Conclusion The height-DBH relationships of 4 tree species under different competitive density can be well simulated by Weibull model, which is suitable for height-DBH relationships in mixed broadleaf-conifer forest. In addition, the relationships are affected by competitive density. The predictive ability will be improved by grouping individuals according to the competitive density.

  • 在林木生长、材积和林分动态变化研究中,单木的树高和胸径都是极其重要的测量要素[1-2]。其中胸径的测量比较容易并且成本较低,而对树高的测量由于受到测量时间的限制、林冠的阻碍和测量误差的影响[3],使得其相对困难并且成本较高。因此,通过量化树高和胸径之间的关系来利用胸径预测树高,是一个降低立木调查难度和成本的重要途径[4]。迄今为止,在林业研究中已经有了大量的树高曲线模型,并且被广泛使用于各个地区和不同树种[5-9]。在不同林分中,树高和胸径的关系往往不同,即使在同一个林分中,二者之间的关系也可能随时间的推移而变化[10-11]。在天然林中,树木个体可能具有不同的年龄、树冠类型和耐阴性,相对于年龄结构简单,林层单一或者纯林来说,其树高-胸径关系更为多变[12]。树高和胸径之间的关系在成熟林中往往是非线性的,因此通常用非线性模型来描述树高-胸径之间的关系[13-15]

    研究者们从不同的角度研究树高-胸径关系的差异,认为树木的树高-胸径关系与其所在的生境类型和林分密度相关[12],也与其所处的坡向相关[16]。这些差异可以帮助我们理解植物是如何适应它们所处的生活环境或如何竞争资源的[17]。竞争作用的实质是对资源的掠夺[18],并借此扩大自身的生长空间,进一步增强占有资源的能力[19-21]。因此,竞争作用对林分中树木胸径和树高的变化有重要影响[22]。而现有的研究中,很少有研究探讨竞争作用强度对混交林树高-胸径关系的影响。本研究据此提出假设,竞争作用的强度会影响树木的树高-胸径关系,因此竞争强度不同的个体的模型拟合结果可能不同,并且对不同竞争强度的个体分别建立树高-胸径模型来提高模型的精度和预测能力。

    本研究以吉林蛟河针阔混交林为研究对象,选择目前应用广泛且拟合优度较高的4个树高-胸径模型,对样地内主要树种的全部个体、低竞争强度个体和高竞争强度个体分别建立非线性模型来描述各树种的树高-胸径关系,筛选各树种的最优模型,并验证上述假设,以期为天然混交林经营提供依据和资料。

1.   研究区概况
  • 研究地点位于吉林省蛟河林业试验区管理局林场,位于吉林省蛟河市前进乡境内,属长白山系张广才岭山脉,地理坐标为43°57.524′~43°58.042′ N,127°44.111′~127°44.667′ E。属于温带大陆性季风气候,年平均气温为3.8 ℃,无霜期约120~130 d,7月份的平均气温为21.7 ℃,1月份的平均气温为-18.6 ℃,年平均降水量695.9 mm。该区域以低山缓坡为主,海拔459~517 m。土壤类型为山地暗棕色森林土壤,土层平均厚度为20~100 cm。

    该地域植被属于长白山植物区系,主要植被类型为次生针阔混交林,植物种类较为丰富,成熟林中乔木树种主要包括红松(Pinus koraiensis Siebold & Zucc.)、色木槭(Acer pictum subsp. mono (Maxim.) Ohashi)、白牛槭(Acer mandshuricum Maxim.)、紫椴(Tilia amurensis Rupr.)、千金榆(Carpinus cordata Blume)、水曲柳(Fraxinus mandshurica Rupr.)、胡桃楸(Juglans mandshurica Maxim.)等,灌木主要包括毛榛(Corylus sieboldiana var. mandshurica (Maxim.) C.K.Schneid.)、暴马丁香(Syringa reticulata subsp. amurensis (Rupr.) P.S.Green & M.C.Chang)和瘤枝卫矛(Euonymus verrucosus Scop.)等。

2.   材料与方法
  • 本研究的数据是森林长期定位监测研究的一部分,获取自吉林省蛟河林业试验区管理局林场内于2010年建立的42 hm2(840 m×500 m)成熟林固定监测样地。样地被划分为1 050个20 m×20 m的样方,调查记录样方内所有胸径大于1 cm的木本植物个体种名、胸径、树高和坐标。为了获得稳定的参数估计,选取了样地中优势度最高的4个树种,分别为色木槭、红松、水曲柳和紫椴[23]

  • 本研究采用Hegyi[25]提出的方法来计算竞争指数,将竞争指数取平均即可得到平均竞争指数,用来代表竞争强度。每一优势树种设置3个组别,分别为该树种的全部个体,低竞争强度的个体(竞争指数小于或等于该树种平均竞争指数)和高竞争强度的个体(竞争指数大于该树种平均竞争指数)。在建立和检验树高-胸径关系模型时,将每组数据随机分成2个部分,其中80%为建模样本,20%为检验样本(表 1表 2)。本研究运用R3.2.2统计软件进行数据处理,包括统计、随机抽样、模型参数估计、模型检验和作图。

    树种
    Species
    色木槭
    A. mono
    水曲柳
    F. mandschurica
    红松
    P. koraiensis
    紫椴
    T. amurensis
    组别Groups A1 B1 C1 A1 B1 C1 A1 B1 C1 A1 B1 C1
    样本数Number of stems 5 266 3 333 1 933 1 435 990 446 1 561 1 098 471 1 478 1 102 376
    平均竞争指数Average of CI 19.8 8.0 40.5 4.2 2.3 8.7 8.6 3.1 21.2 8.9 3.7 25.3
    平均胸径Mean Diameter/cm 12.0 17.0 3.3 27.7 32.6 16.1 25.3 33.1 6.5 23.1 27.7 11.3
    最小胸径Minimum Diameter/cm 1.0 1.0 1.0 1.6 9.3 1.6 1.0 1.7 1.0 1.1 2.2 1.1
    最大胸径Maximum Diameter/cm 71.8 71.8 35.2 88.0 86.6 46.1 86.0 78.0 48.2 69.0 73.2 45.7
    胸径标准差Standard deviation of Diameter/cm 12.8 13.5 2.2 13.6 12.1 7.2 18.4 15.6 4.7 13.6 12.7 8.5
    平均树高Mean Height/m 9.6 12.3 4.8 18.2 19.5 15.1 13.7 17.3 5.6 15.3 17.2 10.6
    最小树高Minimum Height/m 0.7 1.4 0.7 2.3 8.5 2.3 1.2 2.8 1.2 1.2 3.4 1.2
    最大树高Maximum Height/m 29.0 29.0 24.0 29.4 28.5 28.8 29.7 29.7 25.0 30.0 30.0 26.0
    树高标准差Standard deviation of Height/m 5.9 5.5 2.3 4.3 3.3 4.5 7.2 5.4 3.7 5.4 4.3 5.5

    Table 1.  Data of model establishment

    树种
    Species
    色木槭
    A. mono
    水曲柳
    F. mandschurica
    红松
    P. koraiensis
    紫椴
    T. amurensis
    组别Groups A1 B1 C1 A1 B1 C1 A1 B1 C1 A1 B1 C1
    样本数Number of stems 1 316 833 483 359 247 111 391 275 106 370 276 94
    竞争指数Average of CI 20.4 8.0 40.0 4.2 2.2 7.7 8.4 3.0 23.2 11.3 4.1 27.2
    平均胸径Mean Diameter/cm 11.8 17.0 3.3 26.8 33.0 16.6 25.4 34.3 6.3 23.9 26.2 9.7
    最小胸径Minimum Diameter/cm 1.0 1.5 1.0 2.5 9.8 2.5 1.1 1.2 1.0 1.3 6.7 1.4
    最大胸径Maximum Diameter/cm 90.0 90.0 28.5 69.9 88.0 44.1 71.0 86.0 35.0 73.2 64.8 35.3
    胸径标准差Standard deviation of Diameter/cm 12.7 14.0 2.3 12.6 12.9 7.7 18.1 16.8 5.6 14.4 12.6 7.5
    平均树高Mean Height/m 9.4 12.3 4.8 18.1 19.7 15.1 13.9 16.9 6.1 15.7 16.7 9.2
    最小树高Minimum Height/m 1.0 1.0 1.3 4.2 7.2 3.3 1.7 2.2 1.7 2.2 6.0 2.3
    最大树高Maximum Height/m 28.2 26.5 14.0 28.2 28.2 23.6 29.0 27.0 22.0 27.5 25.0 21.5
    树高标准差Standard deviation of Height/m 5.8 5.6 2.1 4.2 3.3 4.0 7.4 5.2 4.2 5.6 4.0 4.8

    Table 2.  Data of model testing

  • 本研究基于揭示树高和胸径关系的散点图,观察二者关系的特征,并结合前人所做的研究,选择了被广泛使用的4个非线性树高-胸径模型形式对林木树高-胸径关系进行拟合,包括Chapman-Richards模型、Logistic模型、Korf模型和Weibull模型[26-31](表 3)。为了消除异方差在建模中的影响,取树高的自然对数为响应变量,以模型本身的倒数的平方为权函数[32],采用非线性加权最小二乘的方法进行拟合。依据均方根误差(RMSE)评价和比较各模型的拟合效果,并参考平均误差(MR),从各参数均通过检验的模型(p < 0.05)中选择各树种的最优模型[12, 33]。计算公式为:

    模型编号
    Model No.
    模型名称
    Model Name
    表达式
    Equation
    M1 Chapman-Richards $\hat{h}=b_{0}\left(1-e^{b_{1} d}\right)^{b_{2}} $
    M2 Logistic $ \hat{h}=b_{0} /\left(1+e^{b_{1}-b_{2} d}\right)$
    M3 Korf $\hat h = {b_0}{e^{ - {b_1}/d^b{_2}}} $
    M4 Weibull $ \hat{h}=b_{0}\left(1-e^{-b_{1} d^{b} 2}\right)$

    Table 3.  Referenced models of height-diameter function

    式中:hi为第i个个体的树高;$ \hat{h}_{i}$为第i个个体的预测树高;n为样本数量。

  • 利用原始数据中随机选取的20%未用于建模的独立样本数据,绘制模型预测值与模型残差值的散点图进行视图分析[15, 34],并通过均方根误差和平均误差进行统计检验。

  • 基于各树种的最优模型对3种竞争强度水平的显著性进行方差分析。

3.   结果与分析
  • 建模数据如表 1所示,胸径跨度从1 cm到88.0 cm,树高跨度从0.7 m到30 m,水曲柳、红松和紫椴的平均胸径较大,色木槭的平均胸径较小,只有12 cm,但色木槭的数量很大,可见幼树在色木槭中占有较大比例。水曲柳的平均竞争指数最小,为4.2,而色木槭的平均竞争指数最大,达到了19.8。表 2为模型检验数据统计情况。

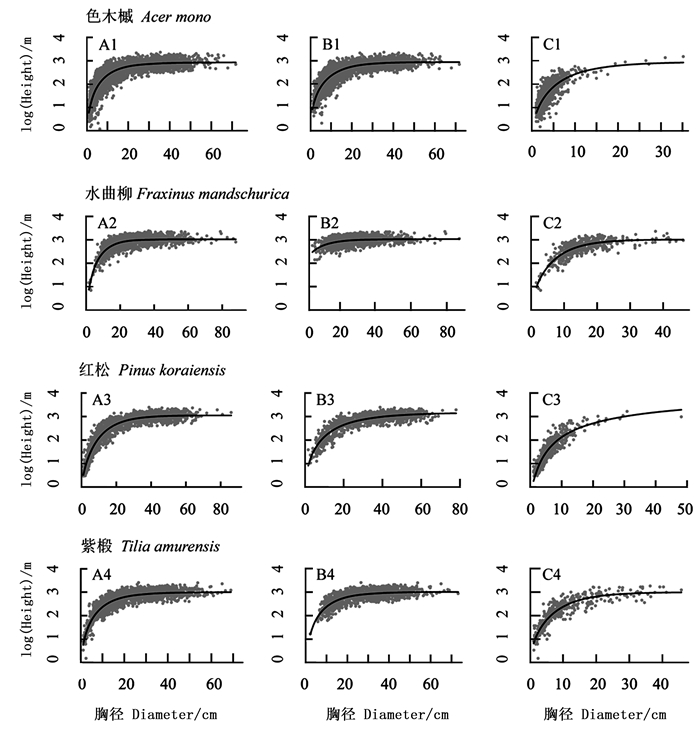
  • 色木槭、水曲柳、红松和紫椴的树高-胸径模型的参数估计与统计检验结果包括了模型的参数估计值、均方根误差和平均误差(表 4)。色木槭A1和C1组模型4(Weibull)的均方根误差最小,平均误差也较小,而B1组中均方根误差最小的是模型1(Chapman-Richards)。水曲柳A2和C2组均方根误差最小的是模型4(Weibull),而B2组的最优拟合模型是均方根误差最小的模型1。对于红松而言,A3、B3和C3组的最优模型分别为模型1、模型4和模型3(Korf)。紫椴A4和B4组拟合效果最好的是模型4而C4组的是模型1(表 4)。各树种的最优树高-胸径拟合曲线如图 1所示。

    树种
    Species
    组别
    Groups
    模型
    Models
    b0 b1 b2 RMSE MR
    色木槭 A1 1 2.89*** 0.14*** 0.62*** 0.241 08 0.000
    Acer mono 2 2.77*** 0.92*** 0.33*** 0.258 83 0.002
    3 3.70*** 1.65*** 0.55*** 0.241 63 0.000
    4 2.93*** 0.31*** 0.73*** 0.240 00 0.000
    B1 1 2.95*** 0.10*** 0.49*** 0.226 92 0.000
    2 2.87*** 0.45*** 0.21*** 0.231 15 0.000
    3 3.70*** 1.57*** 0.53*** 0.230 25 0.000
    4 3.00*** 0.35*** 0.65*** 0.227 06 0.000
    C1 1 2.83*** 0.16*** 0.67*** 0.234 97 0.003
    2 2.31*** 1.08*** 0.55*** 0.422 17 0.233
    3 6.87*** 2.20*** 0.33*** 0.391 90 -0.208
    4 2.96*** 0.30*** 0.75*** 0.231 04 -0.031
    水曲柳 A2 1 3.01*** 0.15*** 0.78*** 0.180 99 0.000
    Fraxinus mandschurica 2 2.98*** 0.82*** 0.23*** 0.183 36 0.000
    3 3.39*** 1.81*** 0.76*** 0.188 61 0.002
    4 3.02*** 0.22*** 0.78*** 0.180 92 0.000
    B2 1 3.02*** 0.11*** 0.46*** 0.159 38 0.000
    2 3.02*** -0.36 0.13*** 0.159 42 0.000
    3 3.07*** 10.42 1.71*** 0.159 40 0.000
    4 3.03*** 0.32*** 0.74*** 0.159 36 0.000
    C2 1 3.01*** 0.13*** 0.70*** 0.207 92 0.000
    2 2.92*** 0.79*** 0.24*** 0.209 50 0.000
    3 3.25*** 3.35*** 1.08*** 0.212 69 0.003
    4 3.04*** 0.25*** 0.81*** 0.208 12 0.000
    红松 A3 1 3.05*** 0.09*** 0.72*** 0.209 80 0.001
    Pinus koraiensis 2 2.93*** 1.30*** 0.24*** 0.228 06 0.002
    3 3.38*** 3.53*** 0.90*** 0.222 79 0.015
    4 3.09*** 0.18*** 0.80*** 0.210 03 0.001
    B3 1 3.11*** 0.07*** 0.53*** 0.224 92 -0.043
    2 3.02*** 0.62*** 0.14*** 0.244 25 -0.050
    3 3.28*** 5.40*** 1.10*** 0.253 89 0.046
    4 3.18*** 0.24*** 0.67*** 0.224 21 -0.043
    C3 1 3.40*** 0.07*** 0.72*** 0.291 30 -0.148
    2 2.50*** 1.46*** 0.35*** 0.395 10 0.235
    3 4.36*** 2.83*** 0.60*** 0.267 93 -0.105
    4 3.65*** 0.15*** 0.77*** 0.343 24 -0.194
    紫椴 A4 1 2.97*** 0.12*** 0.64*** 0.202 01 0.000
    Tilia amurensis 2 2.91*** 0.79*** 0.23*** 0.209 58 0.000
    3 3.23*** 2.56*** 0.93*** 0.205 32 0.004
    4 3.00*** 0.27*** 0.76*** 0.201 71 0.000
    B4 1 2.99*** 0.11*** 0.55*** 0.201 83 -0.012
    2 2.97*** 0.18* 0.15*** 0.217 58 -0.026
    3 3.12*** 4.57*** 1.23*** 0.226 91 0.018
    4 3.01*** 0.28*** 0.74*** 0.201 09 -0.010
    C4 1 3.00*** 0.11*** 0.61*** 0.201 67 -0.017
    2 2.78*** 0.95*** 0.30*** 0.233 34 0.050
    3 3.57*** 2.00*** 0.69*** 0.208 14 -0.031
    4 3.08*** 0.28*** 0.72*** 0.203 69 -0.028
    注:*,0.01 < p < 0.05. **,0.001 < p < 0.01. ***,p < 0.001.

    Table 4.  Parameter estimations and goodness-of-fit statistics of models

    Figure 1.  Height-diameter distribution and fitting curves of different tree species

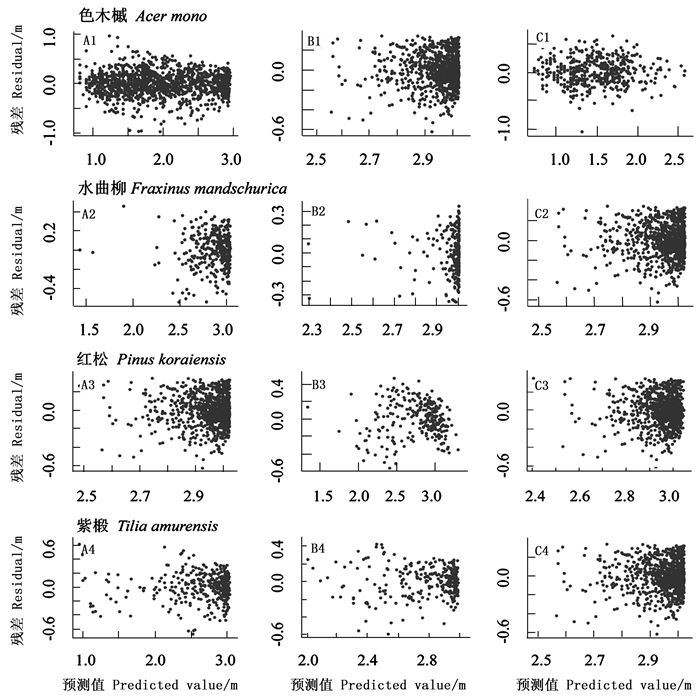
  • 本研究的12组个体中有7个组的最佳模型形式是Weibull模型,4个组的最优模型形式为Chapman-Richards模型,只有1组为Korf模型。不同树种最优拟合模型并不完全一致,同一树种不同竞争强度的个体的最佳模型也会有不同。分别将低、高竞争强度个体与相应树种全部个体的模型拟合结果相比较,除了红松和高竞争强度的水曲柳以外,其他各组最优模型的均方根误差均比全部个体最优模型的均方根误差小,说明模型的拟合效果更好。运用最优拟合模型预测树高的残差分布如图 2所示,各组的残差分布比较均匀,模型拟合效果良好。表 5列出了统计检验的结果。基于各树种的最优模型对3种竞争强度水平的显著性进行方差分析发现,同一树种的不同竞争强度水平之间差异极显著(P < 0.01)。

    Figure 2.  The residual distribution of different species

    树种
    Species
    组别
    Groups
    最优模型
    Optimization Models
    RMSE MR
    色木槭 A1 4 0.236 0.000
    Acer mono B1 1 0.226 0.000
    C1 4 0.223 0.000
    水曲柳 A2 4 0.179 0.000
    Fraxinus mandschurica B2 4 0.146 0.000
    C2 1 0.193 0.000
    红松 A3 1 0.207 0.000
    Pinus koraiensis B3 4 0.201 0.005
    C3 3 0.253 0.011
    紫椴 A4 4 0.201 0.000
    Tilia amurensis B4 4 0.169 0.000
    C4 1 0.200 0.000

    Table 5.  Validation of Models

4.   讨论
  • 本研究中各模型的拟合和检验结果显示,这4种模型形式均有较好的预测效果。Peng等[35]对加拿大森林中9个主要树种的研究结果和Krisnawati等[32]在印度尼西亚森林中的研究结果同样显示了这些经验模型的预测能力没有很大差别。本研究综合表现最好的是Weibull模型。李海奎等[36]采用树高分级的方法模拟6个全国主要树种的树高-胸径关系时得到的最优模型是Weibull模型,而Peng等[35]得到的最佳模型是Chapman-Richards模型。这表明在不同地区对于不同树种的树高-胸径关系的拟合结果存在差异,这是由于胸径-树高关系的影响因素很多。环境中的资源状况,植物适应环境的途径以及树木对资源的竞争,都会造成树高-胸径关系的多样[17]

    在胸径相等的情况下,高密度林分中的树木由于受到更强的竞争作用影响,其树高可能会高于低密度林分中树木的树高[37]。而Temesgen等[12]在天然老龄林中建立树高-胸径模型时试图用大于目标树的个体的胸高断面积和林分胸高断面积代表林分中的竞争作用加入常规使用的模型中,结果并未对模型的预测能力有所提升。但是这并不意味着竞争作用对于树高-胸径关系没有影响,可能是由于天然林的林分结构比较复杂,林分水平的指标并不能描述每个个体的竞争与资源利用状况。本研究依然使用经验上表现良好的模型,采用平均竞争指数表示竞争强度,将样本据此进行分类,分别进行树高-胸径曲线的拟合。按竞争强度分类后,8组中有4组最优模型形式发生改变,5组模型的均方根误差有所减少。这说明竞争作用确实影响着树高-胸径关系,并且竞争强度相近的个体的树高-胸径关系更加趋于一致。庄崇洋[38]在探讨天然阔叶林树高-胸径关系时采用了分林层拟合的方法,同样降低了模型估计的误差。这表明在对复杂的天然林进行研究时,将树木分组进行模型拟合是一个能够提高预测能力的可行思路。

    本研究采用将样本个体按竞争强度分类后分别建立树高-胸径模型的方法,可为提高天然混交林中不同树种的树高预测能力提供参考依据。Weibull模型具有良好的预测能力,可以利用树木的胸径来计算树高,并且如果能够在模拟时考虑到竞争作用的强度,将会提高树高-胸径关系模型的精度。本研究空间尺度和环境梯度较小,但是在环境梯度较大时胸径-树高关系会随气候、立地条件的改变而有规律地变化[39]。因此如果将气候因子和立地条件等加入到树高-胸径关系曲线研究中,或许可以进一步提高模型的精度和适用性。

5.   结论
  • 利用Chapman-Richards模型、Logistic模型、Korf模型和Weibull模型这4种经验模型对蛟河针阔混交林色木槭、水曲柳、红松和紫椴的树高-胸径进行拟合发现,Weibull模型能够很好地拟合其树高-胸径关系,能够适用于本地区针阔混交林的树高-胸径模拟。此外,竞争强度会影响树高-胸径关系,竞争强度相近的植株的树高-胸径关系更加趋于一致,因此将各竞争强度个体分别进行树高-胸径拟合可以提高模型的预测能力。

Reference (39)

Catalog

    /

    DownLoad:  Full-Size Img  PowerPoint
    Return
    Return