

-
木本植物叶片因所处空间位置和分布状态以及比表面积,通常是树冠火中最先着火单元,其热量释放直接影响树冠火蔓延行为。针对木本植物叶片热值的研究可以为科学评估其火灾危险性以及相应产生火行为提供基础数据[1-2]。因其可观的年生长量,木本植物可以作为生物质能源材料的来源,叶片热值是能源植物遴选的重要依据[3]。
除少量挥发性较强的浸提物外,植物叶片可燃组分有半纤维素、纤维素、木质素以及微量粗脂肪和粗蛋白等[2, 4-5]。以往研究表明[4-5],燃烧过程中植物经历水分蒸发、可燃性挥发分析出以及焦炭形成,产生的挥发分和焦炭则分别以气相有焰燃烧和固相表面氧化方式释放热量。生物质热值通常是指每千克干燥植物燃料在空气大气压下完全燃烧后产生的热量,即干基高位热值HHVd (Higher heating value on air-dried basis) [6]。干基高位热值由弹筒量热仪测得的弹筒发热量计算得到(GB/T 30727-2014) [7]。据文献报道,不同种类植物燃料的干基高位热值范围在14~23 MJ·kg-1之间,主要包括麦秸等农林废弃物以及树皮和木材等[8-10]。植物叶片热值的实验报道亦颇多[10-12],但迄今没有针对木本植物叶片较系统和深入的研究。
为增进测试数据的普适性,很早就有学者检讨生物质热值与其自身属性的关系[10, 13-15]。1975年Susott等[10]探讨了生物质热值与挥发分和固定碳含量之间的联系。根据各元素组成对热值的贡献,Demirbas[15]将植物的干基高位热值与元素含量进行关联。后续研究给出了不同形式的热值计算式[9, 13]。面对众多的经验计算式,Yin[8]利用44种植物燃料的测试结果对若干经验式适用性进行验证和比较,发现这些经验式对同一组实验数据的预测优劣度存在较大差异,其中平均绝对误差(AAE)在4.0%~6.7%之间,而平均固有误差(ABE)的范围则为(3.7%~3.8%。探索植物可燃物热值与属性参数间相关性的内在本质,可以为热值计算经验式的可靠性和适用性评估提供依据。
本研究致力于研究木本植物叶片热值的分布状况及其成因。选取27种不同科属的木本植物叶片为研究对象,系统开展工业分析、元素分析及热值测试。通过分析干基高位热值与样品属性参数间相关性,揭示植物叶片热值分布规律和物理化学本质。在此基础上,构建针对木本植物叶片热值的经验计算式,从而为科学评估其火灾危险性以及能源利用提供关键基础数据和工程计算方法。
HTML
-
测试样品涉及20科27种木本植物叶片,主要为针阔叶树种及少量灌木。采集地点为云南省玉溪市易门县龙泉国家森林公园、广东省广州市华南植物园和广东树木园等地。植株均为5年生以上。由较粗枝干上取样,叶片连着枝在低温下(5 ℃左右)密封保存。
工业分析由Sundy SDTGA5000工业分析仪完成;将样品充分破碎后称取约1.0 g左右进行测试,质量变化分辨率为0.000 1 g。元素分析结果由Elementar Vario Macro Cube元素分析仪测试获得;测试前将样品充分研磨成粉末,用锡纸杯称取约10 mg进行测试,确定样品C、H、O、N和S元素含量,其分析精度≤0.2%。
植物样品热值由Sundy SDC 5051型量热仪测定。该设备的温度分辨率可达0.000 1 K,所用氧气纯度为99.995%。将样品烘干去除水分后,充分研磨成粉末状,称量出0.5~1.0 g样品进行测试。结合工业分析和元素分析结果,可由测得的弹筒发热量推算出不同质量基准的高位发热量(GB/T 30727-2014)[7]。弹筒发热量为每千克样品在弹筒高压纯氧环境中完全燃烧产生的热量,燃烧产物的最终规定温度为25 ℃。在此条件下,植物燃料燃烧生成的水分以液态形式存在,燃烧产生的NOx和SOx则溶于水中转化为HNO3和H2SO4并伴随热量释放。在大气压空气条件下,植物燃烧产物中元素N和S实质以气态氧化物形式逸出。因此,样品干基高位热值是指将测得弹筒发热量减去气态燃烧产物转变为HNO3和H2SO4生成热后的结果[7]。
-
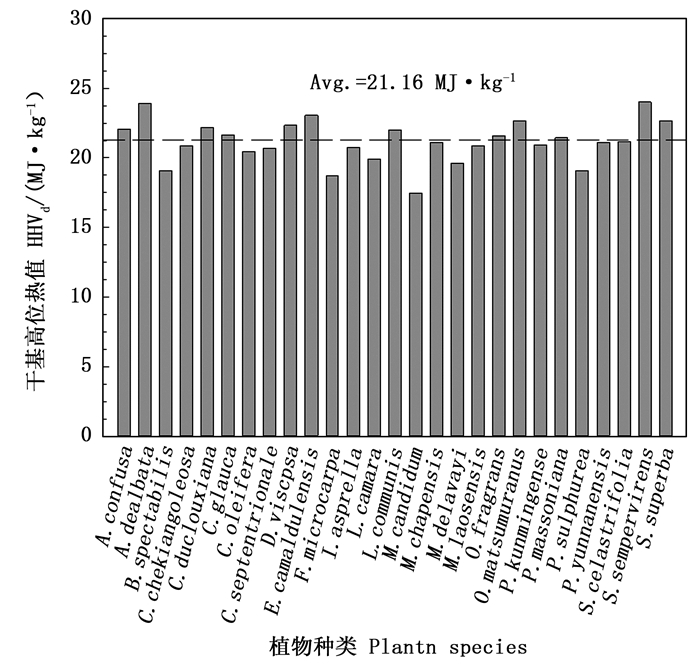
不同种类植物叶片样品收到基工业分析和元素分析测试结果见表 1。可以看出,不同种类植物叶片含水量在较大范围内波动,灰分含量则一般不超过样品总量的5%。收到基样品基本由C、H和O元素组成,N元素含量很低(约1%),S元素含量近乎为零。图 1展示27种木本植物叶片干基高位热值HHVd分布状况。不同种类植物叶片干基高位热值波动范围为17.48~24.01 MJ·kg-1,平均值为21.16 MJ·kg-1;其中野牡丹科野牡丹(Melastoma candidum D. Don)热值最低,而杉科北美红杉(Sequoia sempervirens(Lamb.) Endl.)叶片热值最大。同科的木本植物叶片热值通常较为接近,如松科马尾松(Pinus massoniana Lamb.)和云南松(Pinus yunnanensis Franch.)。Yin[8]报道了麦秸、米糠等44种农林废弃物的HHVd范围在13~23 MJ·kg-1之间。可见,针对木本植物叶片的测试结果与其它种类生物质的变化范围相符合,体现不同类型生物质燃料化学组成的相似性[4-5]。
% 科属Family 样品Species MC VM FC ASH C H O N S 冬青科Aquifoliaceae 梅叶冬青Ilex asprella var. asprella 74.10 19.17 4.64 2.09 12.84 1.49 8.90 0.52 0.06 柏科Cupressaceae 冲天柏Cupressus duclouxiana Hichel 35.90 46.97 13.26 3.87 34.26 3.67 20.87 1.06 0.38 壳斗科Fagaceae 青冈栎Cyclobalanopsis glauca(Thunb.) Oerst. 67.55 24.33 6.07 2.05 16.67 1.87 11.34 0.42 0.09 金缕梅科Hamamelidaceae 米老排Mytilaria laosensis Lec. 74.29 19.42 5.08 1.21 13.23 1.49 9.35 0.42 0.01 樟科Lauraceae 大叶香樟Cinnamomum septentrionale Hand.-Mazz 57.76 31.39 7.71 3.13 20.69 2.37 15.03 0.85 0.16 香叶树Lindera communis Hemsl. 45.70 40.10 12.29 1.91 29.08 3.17 19.14 0.82 0.18 木兰科Magnoliaceae 白花山玉兰Magnolia delavayi Franch. 60.15 29.85 7.41 2.59 19.42 2.26 14.66 0.84 0.09 乐昌含笑Michelia chapensis Dandy 65.56 25.80 6.11 2.53 17.35 1.96 11.56 0.85 0.18 野牡丹科Melastomataceae 野牡丹Melastoma candidum D. Don 71.40 21.06 4.73 2.81 13.30 1.63 10.39 0.42 0.05 含羞草科Mimosaceae 相思树Acacia confusa Merr. 58.01 30.37 9.82 1.79 22.24 2.43 14.36 1.02 0.15 银荆Acacia dealbata Link 47.98 37.40 11.58 3.04 28.07 2.98 16.61 1.15 0.18 桑科Moraceae 榕树Ficus microcarpa Linn. f. 58.25 29.64 7.51 4.60 19.34 2.33 14.58 0.81 0.08 桃金娘科Myrtaceae 赤桉Eucalyptus camaldulensis Dehnh. 63.71 26.91 8.07 1.31 20.09 2.11 12.16 0.57 0.05 紫茉莉科Nyctaginaceae 叶子花Bougainvillea spectabilis Willd. 76.04 16.68 3.90 3.37 10.98 1.29 7.39 0.79 0.14 木犀科Oleaceae 桂花Osmanthus fragrans (Thunb.) Lour. 47.91 39.95 9.73 2.41 26.99 3.14 18.74 0.75 0.06 牛矢果Osmanthus matsumuranus Hayata 49.64 38.69 9.85 1.82 27.46 2.88 17.18 0.97 0.05 松科Pinaceae 马尾松Pinus massoniana Lamb 65.57 26.80 6.96 0.67 18.39 2.13 13.21 0.29 0.02 云南松Pinus yunnanensis Franch. 56.68 32.47 9.75 1.10 22.60 2.57 16.13 0.83 0.09 海桐花科Pittosporaceae 昆明海桐Pittosporum kunmingense Chang et Yan 62.28 27.86 7.10 2.76 19.40 2.10 12.84 0.54 0.07 禾本科Poaceae 金竹Phyllostachys sulphurea(Carr.) A. 38.69 44.07 9.99 7.25 28.10 3.35 21.02 1.35 0.25 无患子科Sapindaceae 车桑子Dodonaea viscosa(L.) Jacq. 64.56 26.58 7.04 1.82 19.04 2.04 11.76 0.68 0.10 肋果茶科Sladeniaceae 肋果茶Sladenia celastrifolia Kurz 63.90 24.98 8.26 2.86 18.45 2.04 11.97 0.50 0.27 杉科Taxodiaceae 北美红杉Sequoia sempervirens(Lamb.) Endl. 51.80 34.83 11.57 1.80 26.41 2.82 16.40 0.66 0.12 山茶科Theaceae 红花油茶Camellia chekiangoleosa Hu 58.04 31.43 8.82 1.71 21.59 2.41 15.30 0.90 0.06 油茶Camellia oleifera Abel. 60.99 28.95 8.06 2.01 20.00 2.22 14.07 0.67 0.05 木荷Schima superba Gardn 48.01 39.71 10.70 1.57 28.46 3.03 18.15 0.70 0.07 马鞭草科Verbenaceae 马樱丹Lantana camara L. 78.10 15.77 3.98 2.15 10.42 1.23 7.30 0.75 0.05 Table 1. Proximate and ultimate analyses of 27 species of woody plant foliage as received

Figure 1. Distribution of higher heating values of different species of woody plant foliage on air-dried basis
结合工业分析结果,可以由样品干基高位热值推算出叶片中可燃组分的燃烧热值,即有HHVd/(1-ASHd)。根据表 1中样品收到基结果,刨去水分后叶片干基灰分含量ASHd一般不超过10%,平均值为5.67%。植物叶片中可燃组分燃烧热值的波动范围较窄,平均值为22.56 MJ·kg-1。比较可燃组分热值与对应HHVd可知,两者数值偏差通常不超过2 MJ·kg-1,其平均偏差为1.40 MJ·kg-1。可见,ASHd对样品干基高位热值HHVd的量阶影响几乎可以忽略。
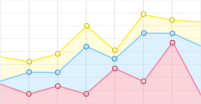
图 2展示干基叶片样品中挥发分含量VMd和固定碳FCd含量以及对应的干基高位热值HHVd分布状况。由于去除水分,植物叶片VMd和FCd的变化范围分别为69%~78%和16%~24%。作为生物质热解产物,挥发分或固定碳的含量波动与植物叶片主要组成及其热解特性有关。研究表明,半纤维素和纤维素的热解产物大部分为气体,是挥发分的主要来源[4-5, 16];样品中木质素热解反应则主要产生固定碳。进一步分析可知,固定碳含量与可燃组分含量比值FCd/(VMd+FCd)在0.18~0.25间变化,与通常植物叶片中木质素含量水平接近(18%~35%) [4, 9]。
Figure 2. Dependence of higher heating values of the samples on air-dried basis to their contents of volatile matter and fix carbon
由图 2展示的结果可知,样品VMd和FCd的波动与干基高位热值的分布特性存在相关性。干基高位热值与VMd和FCd的关系可以表示为:HHVd= VMd×ΔHVM+FCd×ΔHFC,其中ΔHVM和ΔHFC分别为挥发分和固定碳的燃烧热值。假定挥发分燃烧热值ΔHVM和固定碳燃烧热值ΔHFC的波动较小,可以将HHVd与VMd和FCd进行拟合,获得的对应系数则可分别视为ΔHVM和ΔHFC的平均值[9, 13]。
表 2将本研究结果与文献中报道的若干类型生物质热值拟合结果进行对比。本研究给出植物叶片热值经验式的系数与文献中所报道生物质的在量阶上具有高度一致性。进一步观察可知,ΔHVM平均值在15~20 MJ·kg-1之间,与半纤维素、纤维素的热值(约18.6 MJ·kg-1)接近;ΔHFC对应范围为24~37 MJ·kg-1,介于木质素热值(23.3~25.6 MJ·kg-1)和单质碳热值(约32 MJ·kg-1)之间[9, 13, 17]。
作者Author 经验式Correlation 植物种类和样本数
Plant types and sampling number平均固有误差①
Average Bias Error / %平均绝对误差②
Average Absolute Error / %Demirbas, 1997[15] HHVd=0.153 4VMd+0.312 0FCd 农林废弃物,6种; 6 types of forest wastes and agriculture residues -6.79 7.69 Cordero et al., 2001[20] HHVd =0.170 8VMd +0.354 3FCd 农林废弃物,7种; 7 types of forest wastes and agriculture wastes 4.26 5.68 Yin, 2011[8] HHVd=0.190 5VMd +0.252 1FCd 农林废弃物,43种; 43 types of forest wastes and agriculture wastes 0.67 5.49 Phichai et al., 2013[21] HHVd=0.199 3VMd+0.241 3FCd 农林废弃物,13种; 13 types of forest wastes and agriculture wastes 0.25 6.74 Tao et al., 2016[3] HHVd=0.170 8VMd+0.319 8FCd 森林地表可燃物,18种; 18 types of surface fuels -4.20 6.11 本文作者Current workers HHVd=0.189 3VMd+0.369 5FCd 木本植物叶片,27种; 27 types of foliage fuels 0.44 3.61 ①预测结果与实验数据间相对误差的平均值The average of the relative errors between the predicted results and the experiment data;
②预测结果与实验数据间相对误差绝对值的平均值The average of the absolute relative errors between the predicted results and the experiment dataTable 2. Comparison of the correlations for predicting the higher heating values on air-dried basis of various plant fuels based on the proximate analysis parameters proposed by the previous workers and the current workers
植物叶片的挥发分热值ΔHVM总是低于对应固定碳热值ΔHFC。这与植物叶片的基本化学组成及其热解特性相吻合。植物热解过程中含氧官能团几乎均以气态形式逸出,挥发分中通常含有酮类、醇类等小分子化合物,甚至CO2和H2O,而固相残留物中有机元素主要为碳元素[5, 16]。因此,相比于挥发分热值ΔHVM,固定碳热值ΔHFC会更加接近单质碳热值的量阶[5, 17]。本研究针对植物叶片的经验拟合结果所呈现出的可靠性,从侧面佐证了ΔHVM和ΔHFC波动较小假设的合理性。
毫无疑问,不同经验式中对应系数在数值上展示出的差异应与植物可燃物的化学组成及其热解和氧化特性差异有关。植物叶片中挥发性较强乙醚浸提物的含量相对较高[2],并且因其相对热值较高导致样品的挥发分热值比大部分农林废弃物稍高[9]。研究表明[18-19],农作物废弃物所含无机盐对其焦化反应有催化作用并使得相应固相残留物的燃烧热值降低。这应为导致文献报道的农作物废弃物等燃料热值经验式中FCd前系数相对较小的原因。
-
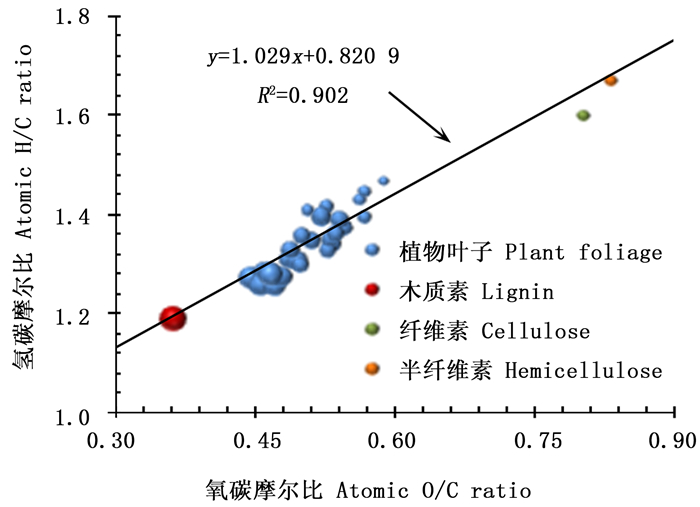
图 3展示了叶片干基高位热值与样品可燃组分中氧碳摩尔比RO/C和氢碳摩尔比RH/C的相关性,其中数据点尺寸代表干基高位热值的相对量阶。植物叶片的氧碳摩尔比RO/C和氢碳摩尔比RH/C范围分别为0.44~0.59和1.26~1.47。植物叶片干基高位热值介于纤维素和木质素之间,并且基本随着氧碳摩尔比和氢碳摩尔比增大而降低。这可从叶片的化学组成及其性质上找到原因。
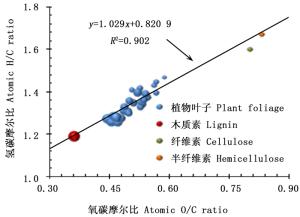
Figure 3. Higher heating values of the leaf samples on air-dried basis as a function of the atomic H/C ratio and the atomic O/C ratio, where the bubble sizes specify the relative magnitudes of the higher heating values of these samples
叶片可燃组分中C元素含量最高,O元素含量次之,H元素含量较低,而N元素和S元素含量则属微量,可以忽略不计(见表 1)。可以确认,植物燃料在完全燃烧条件下产物主要为CO2和H2O;相应地,植物叶片燃烧现象基本可以视为碳元素和氢元素的氧化放热过程。有机化合物的燃烧热值主要取决于每千克样品完全燃烧时所消耗O2的质量[22-23]。燃料中氧碳摩尔比RO/C越大,势必导致其燃烧消耗氧气质量越小;与此同时,由于氢元素的原子相对质量较小,氢碳摩尔比RH/C越大,实际燃烧消耗氧气质量则越大。由此可见,随着氢碳摩尔比RH/C增加或氧碳摩尔比RO/C减小,样品干基高位热值会相应提高。
植物叶片中氧碳摩尔比RO/C和氢碳摩尔比RH/C表现出高度正线性关系,与叶片可燃组成的基本构成密切相关。植物中半纤维素和纤维素的元素摩尔比恒定且数值接近,其RO/C分别为0.83和0.80,而RH/C分别为1.67和1.60;木质素的元素摩尔比稍有波动,平均值为RO/C=0.36和RH/C=1.19 [6, 9]。树叶中浸提物一般不超过5%,可燃组分主要为半纤维素、纤维素和木质素[2]。样品中浸提物的影响可以忽略,其可燃物质的元素摩尔比主要来自于半纤维素、纤维素和木质素含量的贡献。最直接的证据是:图 3中针对植物叶片的拟合直线与半纤维、纤维素和木质素的元素摩尔比高度贴合,并且植物叶片的元素摩尔比均介于三大组成元素摩尔比的数值之间。进一步而言,植物叶片中氧碳摩尔比RO/C和氢碳摩尔比RH/C越高,意味着其可燃组分中木质素含量越低。由于木质素热值远超过样品中半纤维素和纤维素的,叶样干基高位热值随RO/C增加而降低。
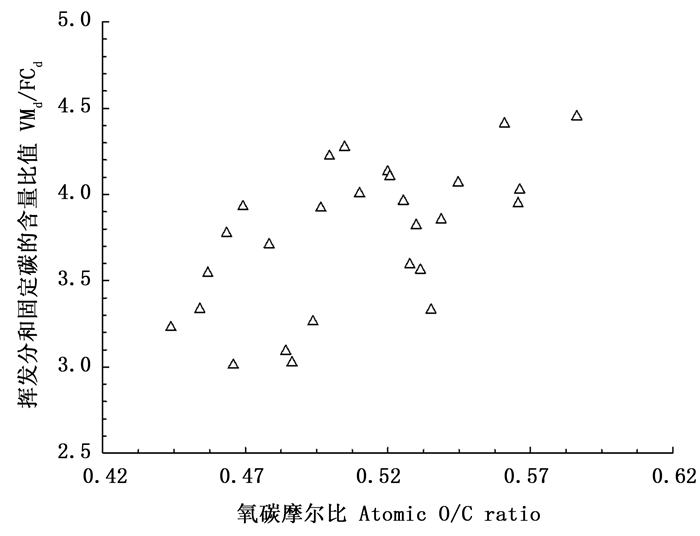
由图 4观察到,样品挥发分和固定碳含量比值VMd/FCd与植物叶片中氧碳摩尔比RO/C存在关联。VMd/FCd随RO/C的增加基本呈增大趋势。RO/C越高意味着其木质素含量相对较低,使得其热解生成的固定碳含量减少,相应导致VMd/FCd增加。这与图 2和图 3中干基高位热值变化规律相符合:由于ΔHVM < < ΔHFC,HHVd必然会随着VMd/FCd增加而呈下降趋势。以北美红杉和野牡丹样品为例,其VMd/FCd分别为3.01和4.45,对应HHVd则分别为24.01 MJ·kg-1和17.48 MJ·kg-1。

Figure 4. Dependence of the ratio of the content of volatile matter to that of the fixed carbon of various plant foliage to their atomic O/C ratio
上述分析还表明,元素分析结果间接反映了叶片所含可燃组分的化学组成及其相对含量;相应地,干基高位热值HHVd同样可以表示为C、H和O元素含量的函数。将若干样品干基高位热值与其C、H和O元素含量进行非线性拟合获得经验式:
式(1)中元素C和H系数为正值,表明C和H元素对放热反应的贡献是正面的;元素O前系数为负值,则意味着该元素对燃烧放热有抑制作用[9, 15, 23-24]。
以往报道的针对农林废弃物等生物质材料热值经验式中Cd前系数在0.2~0.4之间变化,Hd前系数范围在0.9~1.6之间,而Od前对应系数在0.07~0.15范围内变化[8, 16, 22]。经验式(1)中3个系数取值与文献报道结果在量阶上高度一致。
客观来说,虽然不同种类植物中三大组分的元素组成和热值相对稳定,但它们的热解产物会因种类不同而有所变化。这导致不同种类样品的挥发分热值和固定碳热值会稍许波动。换句话说,当不同植物样品生成的挥发分和固定碳的热值存在差异时,基于工业分析结果的热值计算经验式的拟合度会降低。相比之下,元素分析结果直接反映叶片中化学组成含量,不涉及燃烧反应过程中的植物热解特性,保证了基于元素分析结果的经验式可以更加精准地预测植物叶片的热值[13, 16]。正因如此,即使将HHVd单独与样品碳元素含量Cd进行线性拟合也可以获得较好拟合度,这在文献中已有报道[9-10, 13]。
根据样品干基高位热值可以直接计算收到基热值,具体算式为LHVar=HHVd×(1-MC)-Lw×(MC+ 9Har),其中Lw为水分蒸发潜热(2.3 MJ·kg-1)。由图 5可知,由于新鲜植物叶片含水量较高,收到基低位热值较低,变化范围在2~13 MJ·kg-1间,与文献中报道的木材和农林废弃物的低位热值(12~17 MJ·kg-1)相比低许多[25-26]。样品干基高位热值越低或其含水量越高,则其收到基低位热值越低。考虑到植物叶片氢元素含量Har较低,加上HHVd波动不大,叶片收到基低位热值LHVar随含水量增加呈线性降低,并且其变化速率主要取决于干基高位热值的量阶。
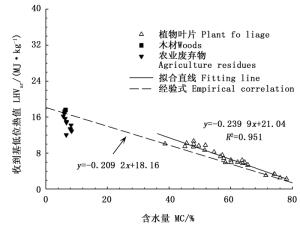
在实际火灾场合,植物自身水分及燃烧生成水分均以气态形式逸出,因此植物的火灾危险性通常可以与收到基低位热值相关联[1, 16]。由图 5可知,与文献报道的木材和农林废弃物相比(LHVar=12~17 MJ·kg-1) [25-26],新鲜树叶收到基低位热值要低很多,其火灾危险性相应很低。树冠叶片的收到基低位热值越低,意味着树冠火蔓延过程中需要吸收更多能量以蒸发树叶持有的水分,这会导致树冠火蔓延难以维持甚至自动熄灭[2]。对于凋落的植物叶片而言,在干燥季节其含水量急剧下降,导致地表火危险性显著增加;由图 5中拟合公式可知,MC=10%时,LHVar → 18.6 MJ·kg-1。
以往的认识表明,决定特定植物可燃物火蔓延的临界含水量与其干基高位热值密切相关[27],而木本植物叶片干基高位热值平均值高于现有林火蔓延计算模型中设定值(即18.62 MJ·kg-1)[27-28]。据此可以推测,其火蔓延临界含水量相对于通常疏松可燃物会较低。与大部分农林废弃物相比[1, 5],干基木本植物叶片中氧碳摩尔比和氢碳摩尔比均较小,其高位热值较高,表明木本植物叶片(尤其是处于凋零状态的)具有潜在能源利用价值。
2.1. 植物叶片属性和热值测试结果

2.2. 样品热值与植物叶片属性内在联系分析

-
选取了27种不同科属的木本植物叶片,开展工业分析、元素分析及热值测试。测试结果表明,木本植物叶片的干基高位热值HHVd在17.48~24.01 MJ·kg-1间变化,平均值为21.16 MJ·kg-1。其中,同科属的木本植物叶片热值一般较为接近。干基高位热值受样品自身灰分含量的影响可以忽略。
分析表明,叶样干基高位热值波动与其挥发分和固定碳含量比值密切相关。叶片中挥发分和固定碳含量比值随着叶片中氧碳摩尔比增加而增大,并且可燃组分中固定碳相对含量与其木质素含量一致。随着氧碳摩尔比和氢碳摩尔比增加,木质素含量降低,导致样品成炭率降低以及干基高位热值相应减小。对于所涉木本植物叶片来说,其干基高位热值可以分别由经验式HHVd=0.189 3VMd +0.369 5FCd和HHVd=0.447 8Cd+1.407 2Hd-0.283 7Od准确计算得到,相应还可以根据具体算法确定收到基样品热值。
 DownLoad: