• 中国中文核心期刊
  • 中国科学引文数据库(CSCD)核心库来源期刊
  • 中国科技论文统计源期刊(CJCR)
  • 第二届国家期刊奖提名奖
Volume 31 Issue 5
Jul.  2019
Article Contents
Turn off MathJax

Citation:

Correlation Between Sample Size and Obolodiplosis robiniae Genetic Diversity Index Based on Microsatellite DNA Data

  • Corresponding author: YAO Yan-xia, yaoyx@caf.ac.cn
  • Received Date: 2017-07-14
    Accepted Date: 2017-10-16
  • Objective To obtain proper sample size for determining the genetic structure of a population of black locust gall midge Obolodiplosis robiniae (Haldemann) (Diptera, Cecidomyiidae). Method The sample sizes with 12 gradients and 11 polymorphic microsatellite loci were used to assess five O. robiniae populations. Result The results revealed that the sample size took significantly positive correlation with the number of alleles per locus (Na), and moderately positive correlation with the effective number of alleles per locus (Ne), but had moderately negative correlation with observed heterozygosity, however little influence was found on the expected heterozygosity, Nei's genetic diversity and polymorphism information content. When the sample size < 25, the number of alleles per locus increased rapidly and observed heterozygosity greatly changed, but they changed gently when the sample size>30. Conclusion Concerning the genetic diversity analysis for populations of O. robiniae with microsatellite DNA markers, the optimum sample size appears to be 25~30, and the optimum parameters are the expected heterozygosity, Nei's genetic diversity and polymorphism information content. The results of this study are helpful to microsatellite marker-based analyses of the genetic structure of populations of other invasive dipteran pests.
  • 加载中
  • [1]

    Haldeman S S. Description of several new and interesting animals[J]. American Journal of Agricultural Science, 1847, 6:191-194.
    [2]

    KodoiF, Lee H S, Uechi N, et al. Occurrence of Obolodiplosis robiniae (Diptera:Cecidomyiidae) in Japan and South Korea[J]. Esakia, 2003, 43:35-41.
    [3]

    Navone P, Tavella L. Obolodiplosis robiniae, fitofago della robinia[J]. Informatore Agrario, 2004, 60:57-58.
    [4]

    Duso C, Fontana P, Tirello P. Spread of the gall midge Obolodiplosis robiniae (Haldeman) injurious to black locust in Italy and Europe[J]. Informatore Fitopatologico, 2005, 55:30-33.
    [5]

    Skuhravá M, Skuhrav V. Do the gall midge Obolodiplosis robiniae occur in England?[J] Cecidology, 2005, 20:34-35.
    [6]

    Csoka G. The first occurrence of the gall midge Obolodiplosis robiniae (Haldeman, 1847) in Hungary[J]. Novenyvedelem, 2006, 42:663-664.
    [7] 杨忠岐, 乔秀荣, 卜文俊, 等.我国新发现一种重要外来入侵害虫-刺槐叶瘿蚊[J].昆虫学报, 2006, 49(6):1050-1053. doi: 10.3321/j.issn:0454-6296.2006.06.024

    [8]

    Amouroux P, Normand F, Nibouche S, et al.Invasivemango blossom gall midge, Procontarinia mangiferae (Felt) (Diptera:Cecidomyiidae) in Reunion Island:ecological plasticity, permanent and structured populations[J]. Biological Invasions, 2013, 15:1677-1693.
    [9]

    Horst C P, Lau J A. Genetic variation in invasive species response to direct and indirect species interactions[J]. Biological Invasions, 2015, 17:651-659.
    [10]

    Shang X P, Yao Y X, Huai W X, et al. Population genetic differentiation of the black locust gall midge Obolodiplosis robiniae (Haldeman) (Diptera:Cecidomyiidae):a North American pest invading Asia[J]. Bulletin of Entomological Research, 2015, 105(6):736-742.
    [11]

    Yao Y X, Zhao W X, Shang X P. Development of polymorphic microsatellite markers of Obolodiplosis robiniae (Diptera:Cecidomyiidae), a North American pest invading Asia[J]. Journal of Insect Science, 2015, 15(1):127-132.
    [12]

    Khemakhem M M, Vanlerberghe M F, Makni M, et al. Development of microsatellite markers for the barley stem gall midge, Mayetiola hordei (Diptera:Cecidomyiidae)[J]. Molecular Ecology Notes, 2010, 6(2):377-378.
    [13]

    Khemakhem M M, Bouktila D, Casse N, et al. Development of new polymorphic microsatellite loci for the barley stem gall midge, Mayetiola hordei (Diptera:Cecidomyiidae) from an Enriched Library[J]. International Journal of Molecular Sciences, 2012, 13(11):14446-14450.
    [14]

    Hinomoto M, Higaki T, Abe J, et al. Development and characterization of 21 polymorphic microsatellite loci in the aphidophagous gall midge, Aphidoletes aphidimyza, (Diptera:Cecidomyiidae)[J]. Applied Entomology and Zoology, 2012, 47(2):165-171.
    [15]

    Kirk H, Dorn S, Mazzil D. Molecular genetics and genomics generate new insights into invertebrate pest invasions[J]. Evolutionary Applications, 2013, 6(5):842-856.
    [16]

    Parker P G, Snow A A, Schug M D, et al. What molecules can tell us about populations:choosing and using a molecular marker[J].Ecology, 1998, 79(2):361-382.
    [17]

    Goldstein D B, Pollock D D. Launching microsatl1ites:a review of mutation processes and methods of phylogenetic inference[J]. Journal of Heredity, 1997, 88:335-342.
    [18] 闫路娜, 张德兴.种群微卫星DNA分析中样本量对各种遗传多样性度量指标的影响[J].动物学报, 2004, 50(2):279-290.

    [19] 高雅, 李生斌. STR遗传多态性研究中样本数量对等位基因检出数量的影响[J].遗传, 2008, 30(3):313-320. doi: 10.3321/j.issn:0253-9772.2008.03.011

    [20] 包文斌, 束婧婷, 许盛海, 等.样本量和性比对微卫星分析中群体遗传多样性指标的影响[J].中国畜牧杂志, 2007, 43(1):6-9. doi: 10.3969/j.issn.0258-7033.2007.01.002

    [21] 李鸥, 赵莹莹, 郭娜, 等.草鱼种群SSR分析中样本量及标记数量对遗传多度的影响[J].动物学研究, 2009, 30(2):121-130.

    [22] 牛东红, 陈慧, 林国文, 等.缢蛏群体微卫星分析中样本量对遗传多样性指标的影响[J].海洋科学进展, 2010, 28(4):203-208.

    [23] 尚兴朴, 赵文霞, 淮稳霞, 等.刺槐叶瘿蚊群体微卫星分析中样本量对遗传多样性指标的影响[J].植物检疫, 2016, 30(1):32-35.

    [24] 周志湘, 万方浩, 张桂芬, 等.烟粉虱基因组DNA快速提取方法[J].植物保护, 2007, 33(5):131-133. doi: 10.3969/j.issn.0529-1542.2007.05.034

    [25] 吉亚杰.我国棉铃虫主要种群的遗传结构、种群动态和相互关系的初步研究[D].北京: 中国科学院研究生院, 2003.

    [26]

    Sun M. Effects of population size, mating system, and evolutionary origin on genetic diversity in Spiranthes sinensis and S. Hongkongensis[J]. Conservation Biology, 1996, 10(3):785-795.
    [27]

    Schmidt K, Jensen K. Genetic structure and AFLP variation of remnant populations in the rare plant Pedicularis palustris (Scrophulariaceae) and its relation to population size and reproductive components[J]. American Journal of Botany, 2000, 87(5):678-689. doi: 10.2307/2656854
    [28]

    Paschke M, Abs C, Schmid B. Effects of population size and pollen diversity on reproductive success and offspring size in the narrow endemic Cochlearia bavarica (Brassicaceae)[J]. American Journal of Botany, 2002, 89(8), 1250-1259. doi: 10.3732/ajb.89.8.1250
    [29]

    Botstiein D, White R L, Skolnick M. et al. Construction of a genetic linkage map in man using restriction fragment length polymorphisms[J]. American Journal of Human Genetics, 1980, 32(3):314-331.
  • 加载中
通讯作者: 陈斌, bchen63@163.com
  • 1. 

    沈阳化工大学材料科学与工程学院 沈阳 110142

  1. 本站搜索
  2. 百度学术搜索
  3. 万方数据库搜索
  4. CNKI搜索

Figures(6) / Tables(2)

Article views(4221) PDF downloads(414) Cited by()

Proportional views

Correlation Between Sample Size and Obolodiplosis robiniae Genetic Diversity Index Based on Microsatellite DNA Data

    Corresponding author: YAO Yan-xia, yaoyx@caf.ac.cn
  • 1. Key Laboratory of State Forestry Administration on Forest Protection, Research Institute of Forest Ecology, Environment and Protection, Chinese Academy of Forestry, Beijing 100091, China
  • 2. China National Traditional Chinese Medicine Corporation, Beijing 100195, China

Abstract:  Objective To obtain proper sample size for determining the genetic structure of a population of black locust gall midge Obolodiplosis robiniae (Haldemann) (Diptera, Cecidomyiidae). Method The sample sizes with 12 gradients and 11 polymorphic microsatellite loci were used to assess five O. robiniae populations. Result The results revealed that the sample size took significantly positive correlation with the number of alleles per locus (Na), and moderately positive correlation with the effective number of alleles per locus (Ne), but had moderately negative correlation with observed heterozygosity, however little influence was found on the expected heterozygosity, Nei's genetic diversity and polymorphism information content. When the sample size < 25, the number of alleles per locus increased rapidly and observed heterozygosity greatly changed, but they changed gently when the sample size>30. Conclusion Concerning the genetic diversity analysis for populations of O. robiniae with microsatellite DNA markers, the optimum sample size appears to be 25~30, and the optimum parameters are the expected heterozygosity, Nei's genetic diversity and polymorphism information content. The results of this study are helpful to microsatellite marker-based analyses of the genetic structure of populations of other invasive dipteran pests.

  • 刺槐叶瘿蚊(Obolodiplosis robiniae(Haldemann))隶属双翅目(Diptera)瘿蚊科(Cecidomyiidae),原产于北美洲东部[1],但近十多年来迅速扩散到欧亚地区[2-6]。在国内,2004年该瘿蚊于河北省秦皇岛市首次被发现,2006年经南开大学卜文俊先生鉴定并由杨忠岐先生首次发表报道[7]

    遗传变异被认为是入侵种定殖扩散的一种重要因素[8-11],其中分子标记作为研究种群遗传结构有效的手段,尤其是微卫星DNA标记,已经广泛应用于入侵性害虫的种群结构的研究探讨中[8, 10-15],原因在于微卫星DNA标记可以有效地分析出样本的多态性和特异性,并能获得丰富的、高质量的遗传信息,且实验过程简洁、方便,可重复性强,等位基因在各个位点的分布频率也比较均匀。另外,微卫星DNA简单重复序列标记遵循孟德尔的共显性遗传特征[16-17]

    然而,在微卫星DNA标记实验过程中,为满足实验需求,首先要确定所试样本量的大小。此外,能否得到足够的样本量还受到野外采集客观因素的限制。因此,应该最大限度地提取每一个样本的有效信息,确定样本量的大小。虽然不少科研工作者在这个问题上做过相关研究,但至今尚无统一的定论。迄今为止,在动物和部分昆虫方面已有利用微卫星DNA标记探讨不同样本量与种群遗传多样性指数的影响分析的相关报道,如蝗虫、棉铃虫、草鱼、缢蛏、鸡、镜鲤等[18-28],并且得出了各生物种类相应的研究结论,体现出各生物类群之间存在着一定的差异。而在双翅目入侵昆虫的相关研究中,尚兴朴等[23]设置了12个样本量梯度对我国刺槐叶瘿蚊1个种群开展了样本量对遗传多样性指数影响的分析。本文在尚兴朴等[23]的研究基础上新增加了4个种群,更加详细地探讨了样本量与遗传多样性指数之间的关系。这5个种群(秦皇岛、北京、西安、泰安、武汉)之间距离较远,相互之间影响较小,在地理区域方面具有一定的代表性(华北沿海地区、华北内陆地区、华中地区、华东地区和中南地区)。新增4个种群之后,得出的数据更加可靠,降低了数据分析的偶然性,相比一个种群更具有说服力。该结论可为我们后续进一步开展我国刺槐叶瘿蚊种群遗传多样性研究工作提供科学依据,同时为其他双翅目入侵害虫的微卫星DNA标记研究提供样本量参考。

1.   材料与方法
  • 设置12个刺槐叶瘿蚊成虫样本量梯度5、10、15、20、25、30、35、40、45、50、55、60头,利用11对微卫星引物进行样本量和遗传多样性指数的相关性分析[11]。5个种群成虫分别采集于北京市(2013-05-22,40°00.184′ N,116°14.363′ E)、河北省秦皇岛市(2013-05-27,39°56.161′ N,119°35. 411′ E)、陕西省西安市(2014-06-04,34°15.474′ N,108°58.938′ E)、山东省泰安市(2013-06-23,36°12.225′ N,117°07.104′ E)和湖北省武汉市(2014-06,30°36.733′ N,114°17.772′ E)。每个地区以公园及绿化带为主要采集目标,在东、西、南、北4个方位共设置4个采样点,每个采样点也尽可能在这4个方位的寄主上采集被刺槐叶瘿蚊危害的卷曲叶片,并记录采集地的经纬度与海拔。但是,从我们野外采集情况来看,由于刺槐叶瘿蚊在自然状态下呈聚集分布,同时受寄主植物有无的影响,有时并不能得到以上全部采集地的样本。

    将采集到的受害刺槐叶片放入广口瓶(30 cm×14 cm)中,瓶口覆盖纱布,用橡皮筋扎紧,防止虫体羽化后逃出,在恒温恒湿条件下由专门工作人员管理。待刺槐叶瘿蚊羽化后用小毛笔将羽化出的成虫浸泡于装有无水乙醇的2 mL离心管中,置于-20℃保存备用。所有样品均来自于中国林业科学研究院森林生态与环境保护研究所植物检疫与外来有害生物实验室。微卫星引物由上海生工公司合成(表 1)。由表 1看出,P值均大于0.05,满足哈迪温伯格定律,且各位点之间都是相互独立的。

    位点
    Locus
    引物序列
    Primer sequences(5′-3′)
    退火温度
    Annealing temperature/℃
    哈温平衡(P值)
    HWE (P value)
    W3(KP260518) F: CGTCATATCGCAGTAGCAAT
    R: CGCCGCATTTAAAATATACAT
    5646touchdown 0.534 6
    W5(KP260519) F: ACCGGCGAAAAACAATTAT
    R: AGTTGATGAATGCGTTGTGTT
    5646touchdown 0.523 3
    W6(KP260520) F: AAATCGTGGAGCAAACACTT
    R: ACACTGCTTGAAATATGACGAA
    5646touchdown 0.886 9
    W8(KP260521) F: TTGAAGCGAAGCACTTGGA
    R: AGCAACGAAAAGAAACACAGAG
    5646touchdown 0.287 4
    W31(KP260523) F: CACGCAGAAACCAATCATTATC
    R: AGCCAAACTCAATGACGAACA
    56 0.687 0
    W33(KP260524) F: CCTTCGCGTACATTTGCA
    R: AACGCGTCTGATAAGCTGAA
    56 0.210 2
    W82(KP260528) F: GCACATTCACTCACGAAACG
    R: TTGCACACGAAATGCATCAT
    56 0.819 5
    W83(KP260529) F: AAAGACTCAGCGTTTTTGCAG
    R: ACACACATACACACGCAAACA
    56 0.702 3
    W107(KP260530) F: TTTCCTGTTGTTTGTCGTTTTC
    R: CTTGCCGCTGTTCTCTAACAA
    56 0.703 8
    W126(KP260532) F: GGACGGGTTGGCTGATGTA
    R: ATTGCTCTGGCTGTAAAGTGG
    56 0.508 2
    W132(KP260533) F: TTTGCGTGAACAAAAGTCAGA
    R: ACACGACCTAAATACATGGCA
    56 0.205 9
    注:5646 touchdown:指第一个循环56℃,每一循环降低1℃,10个循环降低到47℃;然后46℃退火35个循环。
    Note:56-46 touchdown: 56℃ for the first cycle, then reduce 1℃ per cycle to 47℃; Finally 46℃ for 35 cycles.

    Table 1.  Characteristic of 11 microsatellite loci of O.robiniae

  • 每个种群选取60头完整的刺槐叶瘿蚊成虫,DNA提取方法参照周志湘改进的SDS提取法[24],提取完成后置于-20℃保存备用。扩增体系(15 μL):微卫星引物(5 mol·L-1)1 μL,TP-M13(5 mol·L-1)荧光引物0.8 μL,2×Taq PCR Master Mix 7.5 μL,DNA模版1 μL,最后ddH2O 4.7 μL;PCR扩增程序为:95℃预变性15 min,94℃变性30 s,56℃(-1℃/cycle)退火45 s,72℃延伸45 s,共10个循环;然后94℃变性30 s,46℃退火45 s,72℃延伸45 s,共35个循环,最后72℃延伸12 min,16℃保存。PCR产物通过2%琼脂糖凝胶电泳检测,片段大小≥200 bp的个体利用ABI PRISM 3730x1型基因分析仪(Applied Biosystems)进行检测。

  • 原始数据通过Genemarker 2.2.0软件(SoftGenetics)进一步分析;利用Genepop 4.3.0软件(Laboratiore de Genetique et Environment)统计分析平均等位基因数(Na)、有效等位基因数(Ne)、期望杂合度(He)、观测杂合度(Ho)、Nei’s遗传多样性指数(H)、哈迪温伯格平衡等;通过Cervus3.0软件(Field Genetics)计算多态信息含量;利用JMP Pro 11.0软件(SAS Institute)对样本量和各遗传多样性指数进行相关性分析和曲线拟合。

2.   结果与分析
  • 通过11对微卫星引物对5个刺槐叶瘿蚊种群12个样本量梯度共300个个体的遗传多样性指数进行统计分析(表 2)。结果表明,样本量的大小与平均等位基因数(Na)呈显著正相关,与有效等位基因数(Ne)呈中度正相关,与观测杂合度(Ho)呈负相关,而与期望杂合度(He)、Nei’s遗传多样性指数(H)和多态信息含量(PIC)没有明显相关性。当样本量小于25时,有效等位基因数(Ne)增幅明显,观测杂合度(Ho)起伏变化较大,但当样本量大于30时,随着样本量的增加,上述两个指数增(降)幅度平缓,因此,最适样本量应为25~30,最适指数为期望杂合度(He)、Nei’s遗传多样性指数(H)和多态信息含量(PIC)。

    样本量
    Sample size
    平均等位基因数Na 标准偏差SD 平均有效等位基因数Ne 标准偏差SD 平均观测杂合度Ho 标准偏差SD 平均期望杂合度He 标准偏差SD Nei’s遗传多样性指数H 标准偏差SD 多态信息含量PIC 标准偏差SD
    5 2.734 6 0.309 4 2.137 2 0.282 5 0.564 4 0.077 4 0.526 5 0.056 3 0.496 3 0.031 6 0.458 6 0.061 0
    10 3.098 7 0.373 1 2.339 1 0.225 2 0.545 6 0.054 8 0.541 9 0.034 7 0.514 8 0.033 0 0.485 7 0.021 0
    15 3.407 7 0.328 0 2.325 3 0.236 0 0.531 9 0.050 0 0.529 5 0.033 9 0.511 9 0.032 8 0.483 3 0.025 3
    20 3.577 8 0.196 4 2.392 8 0.150 9 0.528 6 0.065 5 0.529 9 0.030 1 0.516 6 0.029 3 0.491 2 0.020 6
    25 3.755 7 0.158 7 2.452 6 0.148 1 0.508 7 0.076 6 0.530 6 0.034 1 0.520 0 0.033 5 0.500 1 0.011 2
    30 3.795 7 0.166 1 2.454 5 0.114 5 0.491 8 0.074 5 0.528 2 0.026 1 0.519 4 0.025 7 0.499 7 0.015 2
    35 3.916 1 0.318 9 2.433 4 0.119 0 0.489 4 0.074 0 0.525 3 0.029 4 0.517 8 0.029 0 0.499 4 0.016 8
    40 3.934 3 0.321 0 2.375 8 0.151 0 0.483 1 0.067 4 0.515 8 0.031 3 0.509 3 0.030 9 0.493 1 0.016 4
    45 4.171 8 0.422 3 2.446 9 0.192 5 0.478 0 0.068 6 0.520 9 0.037 8 0.515 1 0.037 4 0.502 8 0.026 9
    50 4.308 2 0.424 9 2.485 9 0.225 6 0.469 4 0.066 9 0.523 5 0.043 4 0.518 3 0.042 9 0.508 5 0.033 3
    55 4.350 4 0.455 6 2.522 4 0.244 4 0.467 0 0.064 8 0.523 5 0.045 7 0.518 7 0.045 3 0.510 3 0.037 0
    60 4.388 6 0.494 2 2.531 7 0.277 7 0.461 9 0.064 0 0.520 4 0.049 4 0.516 0 0.049 1 0.509 5 0.037 8
    Note: Na: Number of alleles per locus; SD: Standard deviation; Ne: Effective number of allele per loci; Ho: Observed hererozygosity; He: Expected heterozygosity; H: Nei's genetic diversity; PIC: Polymorphism information content.

    Table 2.  Genetic diversity index of 11 Microsatellite loci of O.robiniae

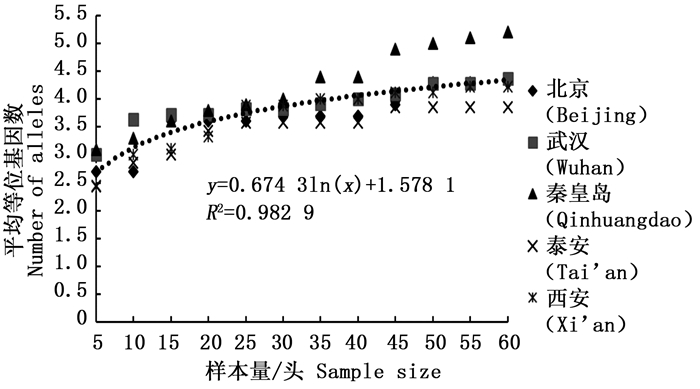
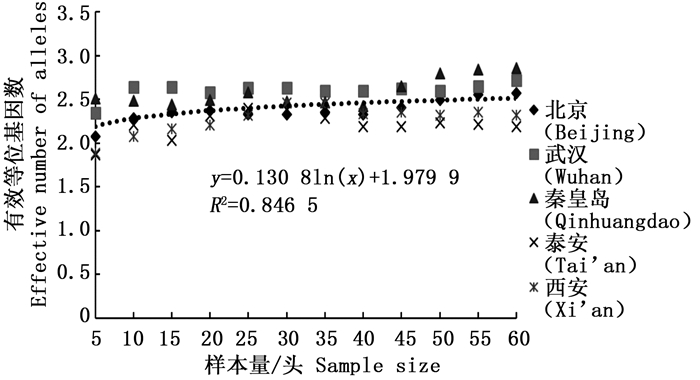
  • 经检测后的每个位点等位基因数在2~10个之间,有效等位基因数在1.280 0~5.161 3之间。由图 1可以看出平均等位基因数随着样本量的增加显著增大,特别是当样本量小于25时,5个种群的平均等位基因数量陡增(表 2),随后逐渐趋于平缓;有效等位基因数则不同于平均等位基因数,当样本量小于25的时候,有效等位基因数随着样本量的增加有轻微的上升趋势,当大于30的时候,拟合曲线非常平缓(图 2),从5个种群的平均值来看(表 2),当样本量小于30时,平均等位基因数量变动幅度明显,但当样本量大于30时,变化较小。

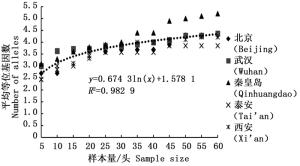
    Figure 1.  Correlation between sample size and number of allele (Na)

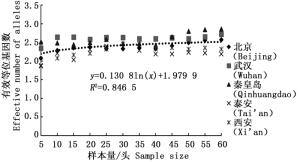
    Figure 2.  Correlation between sample size and effective number of allele (Ne)

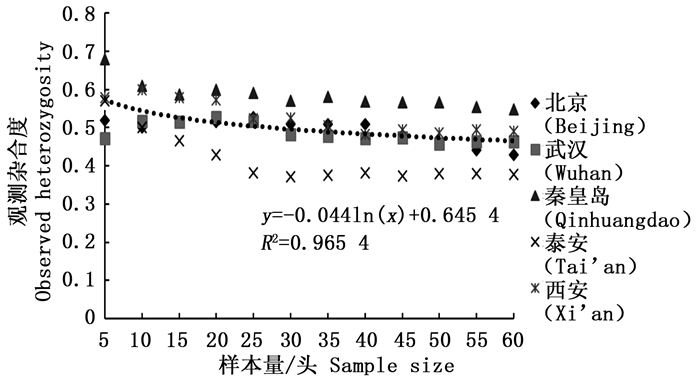
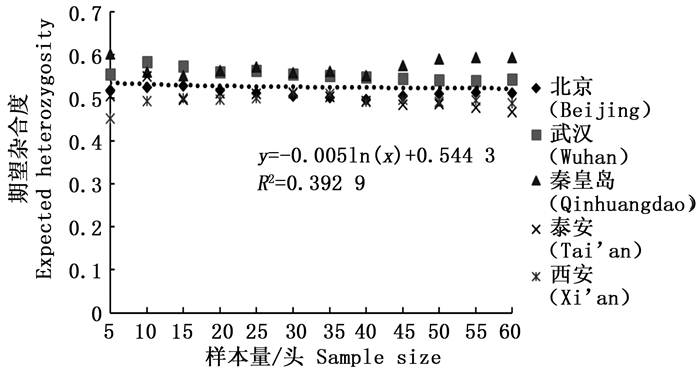
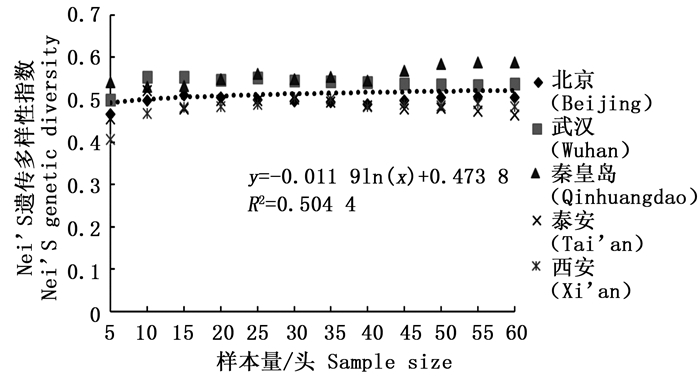
  • 分析结果显示,样本量的大小与观测杂合度(图 3)呈负相关,而与期望杂合度(图 4)、Nei’s遗传多样性指数(图 5)和多态信息含量(图 6)没有显著相关性。当样本量在5~25之间时,观测杂合度和期望杂合度变动幅度分别为0.055 7和0.015 4,当样本量大于30时,随着样本量增大,观测杂合度缓慢降低,而期望杂合度变化不大,从5个种群平均期望杂合度来看,随着样本量的增大,变化幅度小于0.01。Nei’s遗传多样性指数也是同样的情况,当样本量大于30时,随着样本量增大,该指数基本不变,5个种群平均Nei’s遗传多样性指数增幅同样小于0.01。多态信息含量随着样本量的增加变化不明显,从5个种群平均多态信息含量来看,当样本量为5时,PIC=0.458 6,大于5时,在0.483 3~0.510 3之间变化,当样本量大于30时,增幅小于0.02,没有出现大的波动。

    Figure 3.  Correlation between sample size and observed hererozygosity (Ho)

    Figure 4.  Correlation between sample size and expected heterozygosity (He)

    Figure 5.  Correlation between sample size and Nei's genetic diversity (H)

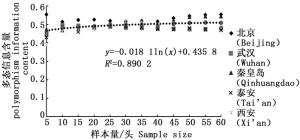
    Figure 6.  Correlation between sample size and polymorphism information (PIC)

3.   讨论
  • 本研究探讨了我国刺槐叶瘿蚊5个种群样本量与遗传多样性指数之间的相关性,在11对微卫星引物的统计分析中表明,样本量的大小与平均等位基因数、有效等位基因数和观测杂合度呈现一定的相关性,而与期望杂合度、Nei’s遗传多样性指数没有明显相关性,该结论与前人结果一致[18, 25-28]。等位基因数随着样本量的增加而增加,这反映了该种群的遗传多样性并揭示了许多稀有基因的存在。另外,随着样本量的增加,最初有效等位基因数增加,之后略微下降,最终呈平稳状态,出现平台期,并且稀有基因也被检测出来。观测杂合度决定了两个等位基因在随机样本中不相同的概率,而期望杂合度主要反映了在一定种群中优势等位基因所占的分布频率。Nei’s遗传多样性指数基本不受样本量大小的影响,并且它更加倾向于等位基因的分布频率而非个数。本研究通过微卫星DNA标记对刺槐叶瘿蚊遗传多样性研究,同样发现期望杂合度和Nei’s遗传多样性指数基本不受样本量的影响,几乎稳定不变,所以最适遗传多样性指数为期望杂合度和Nei’s遗传多样性指数。

    此外,本研究增加了多态信息含量(PIC)指数分析,并且认为PIC也是刺槐叶瘿蚊微卫星DNA标记研究中的最适指数。PIC常用来衡量基因变异程度,是分析种群遗传分化程度的重要指数。根据Botstein[29],当PIC值>0.5时,表明该位点为高度多态性;当0.25<PIC<0.5时,表明中度多态性;当PIC<0.25时,则为低度多态性。理想的多态性位点应具有较大的多态信息含量,较低的遗传相似性和较高的特异性。在本研究中,5个种群的平均PIC值在0.458 6~0.510 3之间,表明11个位点具有中度到高度的多态性,且当样本量大于30时,增幅小于0.02,样本量的大小与多态信息含量的相关性并不明显,这可能是因为样本量越大,虽然检出的等位基因数量越大,但与基因变异程度无直接关系。采用微卫星标记开展种群遗传多样性研究中,最小样本量在不同的类群中得出的结果也存在一定的差异,在棉铃虫微卫星多样性研究中表明,当样本量大于15时,遗传多样性与样本量之间没有显著相关性[25]。分析缢蛏的遗传多样性指数和样本量相关性结果表明,当样本量小于20时,样本量对杂合度和Nei’s遗传多样性指数呈显著相关;当样本量大于30时,则趋于稳定[22]。关于鸡的样本量与遗传多样性指数相关性研究中,最适指数为期望杂合度,最适样本量为20~25[20]。在蝗虫的遗传多样性分析中,最适样本量为30~50之间[18]。本研究对5个种群刺槐叶瘿蚊不同样本量的遗传多样性指数进行统计分析,最终认为在运用微卫星标记研究刺槐叶瘿蚊种群遗传多样性时,最适样本量应为25~30,这与尚兴朴等的结论(最小样本量为20)稍有差异,可能是因为基于一个种群所得出的数据偶然性较大,不具有代表性,此外,对于期望杂合度和Nei’s遗传多样性指数而言,样本量的差异并没有表现出对其具有明显的影响。同时本研究增加了多态信息含量(PIC)指数分析,研究结论更为可靠,进一步验证了该类群的在运用微卫星标记研究中的最适样本量和最适分析指数。另外,从上述拟合曲线可以看出,在采用微卫星标记开展刺槐叶瘿蚊种群遗传多样性研究中,样本量在20、25、30…时,有些指数的曲线变化不明显,如多态信息含量、期望杂合度和Nei’s遗传多样性指数,但对于观测杂合度而言,当样本量大于30时,虽然表现出较为平缓的变化趋势(图 3),但是从5个种群的平均观测杂合度来看(表 2),观测杂合度仍然处于下降趋势,这可能是因为样本量越大,随机抽取的2个样本等位基因不相同的概率就越小,观测杂合度也就越小。因此与期望杂合度不同,观测杂合度受样本量大小的变化而出现明显差异,在遗传多样性探讨中需要慎重。

4.   结论
  • 本研究通过利用11对微卫星引物对我国刺槐叶瘿蚊5个种群样本量与遗传多样性指数之间进行了研究,结果表明,样本量的大小与平均等位基因数(Na)、有效等位基因数(Ne)和观测杂合度(Ho)呈现一定的相关性,而与期望杂合度(He)、Nei’s遗传多样性指数(H)和多态信息含量(PIC)没有明显相关性;在利用微卫星DNA标记对我国刺槐叶瘿蚊种群的遗传多样性研究中,选取的最适样本量应为25~30,分析的最适遗传多样性指数为期望杂合度(He)、Nei’s遗传多样性指数(H)和多态信息含量(PIC)。该结论将有助于其他入侵种群遗传结构的研究,同时在样本量选取方面也为其他双翅目昆虫的遗传多样性研究提供参考。

Reference (29)

Catalog

    /

    DownLoad:  Full-Size Img  PowerPoint
    Return
    Return