


-
作为生态过程中不可或缺的组成部分,林木枯损被认为是森林生态系统中极其关键,却又知之甚少的森林动态过程[1]。单木枯损模型能够对每株树木的生长状况进行模拟,诸多学者利用多种数据和方法构建了大量的单木枯损模型。传统的经验方程,如指数方程和Weibull方程等,主要是通过建立枯损与协变量的回归方程来预测未来树木的枯损概率[2-3]。由于每株树木只包括枯损和存活两种结局,是典型的二分类数据,上述传统的经验方程在估计枯损时效果并不理想。而Logistic回归方法对于二分类数据具有先天的优势,与传统的经验方程相比,模拟林木的枯损有较好的适用性,已经被广泛应用[4-5]。
在构建单木枯损模型时,以往基于Logistic回归方法的枯损模型只反映枯损林木总体的平均变化规律,忽略了样地之间及林木个体之间的差异,也没有考虑数据间的时空序列相关性,势必会对模型的准确性造成影响[6]。混合效应模型由固定效应和随机效应两部分组成,既可以反映总体的平均变化趋势,又可以提供数据方差、协方差等多种信息来反映个体之间的差异。另外,在处理连续观测数据存在的序列相关性等问题时具有其他模型无法比拟的优势[7]。因此一些学者开始尝试利用广义线性混合效应模型来构建单木枯损模型[7-9]。研究结果表明:与传统的Logistic回归方法相比,基于广义线性混合效应模型方法的枯损模型明显提高了模拟和预测精度。
影响单木枯损的因素很多,主要包括单木因子、林分因子、立地因子、气象因子以及这些因子的交互作用。单木因子主要包括林木本身的生长和遗传特性。林分因子方面,主要包括林分密度、竞争指数、林分生产力及林分结构等,多数情况下被同时考虑或考虑其中几个因子[10-13]。立地因子,主要考虑坡度、坡向、海拔及其数学变化形式对枯损的影响[8]。气象因子方面,主要考虑温度、降水量、霜冻及干旱等对枯损的影响[1, 14-16]。在实际情况中,树木的枯损可能会由于多种原因同时发生,例如林分因子、立地因子及气象因子的相互作用等[17]。
蒙古栎(Quercus mongolica Fisch. ex Ledeb)是我国东北林区中主要的天然树种[18]。研究蒙古栎林的枯损和存活状态,构建蒙古栎林的单木枯损模型对于构建林分生长和收获模型具有重要意义。马武等[19]以蒙古栎天然林为研究对象,基于吉林省汪清林业局195块固定样地数据,采用二分类的Logistic回归方法建立了蒙古栎天然林的单木枯损模型,但没有考虑枯损数据存在的样地和个体之间的差异和多次测量的时间序列相关性。本研究以吉林省东南部地区的295块蒙古栎林固定样地多次观测数据为研究对象,把数据分成两部分,一部分为模拟数据(约80%),共计236块样地38 096条单木记录,一部分为验证数据(约20%),共计59块样地9 674条单木记录。基于Logistic回归及广义线性混合效应模型方法,考虑单木和林分因子,立地因子和气象因子的影响,构建单木枯损模型,并与不考虑随机效应的传统方法进行比较,然后采用验证数据进行精度验证。
HTML
-
本研究选择吉林省295块蒙古栎样地数据,样地大小为0.06 hm2。样地中蒙古栎为优势树种,其他主要树种还包括云杉(Picea jazoensis Nakai)、白桦(Betula platyphylla Suk.)、红松(Pinus koraiensis Sieb. et Zucc.)、水曲柳(Fraxinus mandshurica Rupr.)和冷杉(Abies nephrolepis (Trautv.) Maxim)等。调查的样地因子主要包括起源、优势树种、平均林龄、平均树高、郁闭度、海拔、坡度、坡向及坡位等因子。单木因子包括对胸径大于5 cm的树木进行每木检尺,枯损木的标记和记录。外业调查结束后进行林分公顷株数、公顷断面积、大于对象木断面积等指标的计算。建模数据采用1999年和2009年观测的林分因子数据。枯损树木的记录分别是1999年观测(没有枯损)—2004年观测(枯损)和2009年观测(没有枯损)—2014年观测(枯损)的数据。而验证数据采用的是2004年观测数据。具体的单木因子、样地因子及立地因子见表1。气象因子利用ClimateAP v2.10软件[20],通过输入各样地的空间位置坐标和海拔,然后获取各样地每年的各类气象因子变量,最后对每5年的变量进行平均计算。气象因子分别对应的是1999—2004年和2009—2014年平均数据,具体因子见表2。
影响因子
Effect factors统计指标
Statistics indicator平均值 Mean
(标准差 Standard error)最大值
Max value最小值
Min value单木和林分因子
Stand and tree factor1999 胸径 D/cm 12.7(7.5) 82.7 5.0 林分平均直径 Dg/cm 15.3(4.2) 30.9 6.3 公顷断面积 Basal area/(m2·hm−2) 22.9(9.4) 57.7 3.0 公顷株数 Number of stems/(stems . hm−2) 1343(621) 3317 250 郁闭度 Canopy density 0.9(0.2) 1.0 0.5 平均林龄 Mean age/a 60(25) 154 14 公顷枯损株数 Number of mortality stems/(stems·hm−2) 88(78) 367 17 2004 胸径 D/cm 12.9(7.6) 83.6 5.0 林分平均直径 Dg/cm 15.7(4.1) 31.3 6.3 公顷断面积 Basal area/(m2·hm−2) 24.1(8.8) 59.7 3.8 公顷株数 Number of mortality stems/(stems·hm−2) 1370(618) 3250 350 郁闭度 Canopy density 0.9(0.1) 1.0 0.6 平均林龄 Mean age/a 61(24) 159 19 公顷枯损株数 Number of mortality stems/(stems·hm−2) 117(97) 600 17 2009 胸径 D/cm 13.5(8.0) 84.9 5.0 林分平均直径 Dg/cm 16.5(4.1) 32.6 6.6 公顷断面积 Basal area/(m2·hm−2) 26.2(8.5) 61.2 7.3 公顷株数 Number of mortality stems/(stems·hm−2) 1347(584) 3550 367 郁闭度 Canopy density 0.9(0.1) 1.0 0.6 平均林龄 Mean age/a 65(24) 164 19 公顷枯损株数 Number of mortality stems/(stems·hm−2) 127(95) 650 17 立地因子
site factor海拔 Elevator/m 596(196) 1280 100 坡度 Slope/(º) 21(9) 45 0 坡向 Aspect 按方位角从0~360度,共分成9个坡向 Table 1. The statistics of plot factors
气象因子 Climate factors 最小 Min 最大 Max 平均 Mean 年平均温度(MAT) Mean annual temperature/℃ 1.3 6.6 3.9 最暖月平均气温(MWMT) Mean warmest month temperature/℃ 18.3 23.6 20.9 最冷月平均气温(MCMT) Mean coldest month temperature/℃ −19.0 −11.5 −16.1 年平均降水量(MAP) Mean annual precipitation/mm 499 1139 676 年平均夏季(5—9月)降水量(MSP) Mean annual summer (May to Sept.) precipitation/mm 390 884 527 无霜期天数(NFFD) The number of frost-free days 155 197 175 上一年8月至当年7月的降雪量(PAS) Precipitation as snowbetween August in previous year and July in current year/mm 35 155 68 Table 2. The statistical table of main climate variables
-
首先把单木、样地、立地和气象等因子加入到模型中,逐步剔除差异不显著(
$p > 0.05$ )以及存在多重共线性问题(方差膨胀因子 > 5)的影响因子。本研究主要的候选因子包括单木初始胸径、单木初始胸径的自然对数、单木初始胸径的平方、单木初始胸径与林分平均胸径的比值、大于对象木断面积、林分算术平均直径、林分平方平均直径、林分公顷断面积、林分公顷株数、平均年龄、郁闭度、坡度(slope)、坡向(aspect)、海拔(elevation)、SIC值(SIC = tan(slope) × cos(aspect))、CE值(CE = cos(aspect) × ln (elevation))、年平均温度(MAT)、最暖月平均气温(MWMT)、最冷月平均气温(MCMT)、年平均降水量(MAP)、年平均夏季(5—9月)降水量(MSP)、无霜期天数(NFFD)和上一年8月至当年7月的降雪量(PAS)等23个影响因子。 -
广义线性混合效应模型(GLMM)通过在线性预测部分引入随机效应参数而推广的广义线性模型(GLM)[21]。本研究基于Logistic回归的广义线性混合效应模型在截距和参数系数上考虑随机效应,利用SAS 9.4 的PROC NLMIXED 模块来估计广义线性混合效应模型的待估参数。
AIC信息准则、BIC信息准则和−2*对数似然值(−2LogL)这3个值经常被用来比较不同模型之间的拟合效果,这3个值越小,说明模型的模拟效果越好[22]。似然比卡方检验(LRT)被用来比较模型之间的差异显著程度[23]。
AUC值是ROC曲线下面的面积,能够描述Logistic回归模型的辨别能力,被广泛用来评价单木枯损模型的特异性和敏感性。AUC值越大,说明模型的特异性和敏感性越好,具体计算方法见Fielding and Bell[24]。
-
在利用枯损模型来判断林木是否枯损前需要科学合理的确定阈值。确定阈值的主要方法包括传统阈值、随机阈值、错误分类率(MCR)最低阈值和割点阈值等[9, 25]。传统阈值通常选择0.5,该值仅适用于枯损木与存活木相近的情况,实际上枯损是小概率事件;随机阈值选择灵敏度与特异度曲线交叉时的阈值为最佳阈值;割点阈值选取林分各个样地枯损率的平均值作为最佳阈值[26]。本研究选择了随机阈值、错误分类率最低阈值和割点阈值等3种阈值确定方法,来确定最佳阈值。
2.1. 主要影响因子选择

2.2. 广义线性混合效应模型及评价方法
2.3. 阈值确定
-
通过筛选,最后单木初始胸径、大于对象木断面积、林分公顷断面积、林分公顷株数和林分平均年龄,气象因子中的年平均温度(MAT)、年平均夏季(5—9月)降水量(MSP)、上一年8月至当年7月的降雪量(PAS)等因子,被保留在基础模型中。
在Logistic模型的基础上,考虑样地水平、单木水平及两水平(样地内嵌套单木水平)的随机效应(分随机截距效应和随机系数效应两种情况)。在考虑单木水平时只有在截距上收敛,但是其AIC、BIC和−2LogL值分别是18 559、18 639和18 539,远远高于固定效应模型。在考虑两水平效应时,无论什么情况,模型均不能够收敛。在考虑样地水平随机系数效应时,3个参数以上的随机效应均不收敛,考虑2个参数时,只有两种情况收敛,第一种是同时在截距和胸径两个参数上考虑随机效应,第二种是同时在截距和大于对象木断面积时,模型能够收敛。具体模拟和计算的AIC、BIC、−2
LogL、LRT、AUC值和参数的估计值见表3。表3中,M1为传统Logistic回归模型,M2为在截距上考虑随机效应的混合效应模型,M3为在截距和胸径变量上同时考虑随机效应的混合效应模型,M4为在截距和大于对象木断面积变量上同时考虑随机效应的混合效应模型。 变量
Variable固定效应
Fixed effects M1随机截距效应
Random effect M2截距 + 胸径随机系数效应
Intercept + D M3截距 + 大于对象木断面积
随机系数效应
Intercept + Bal M4截距 Intercept −3.412 0(0.263 6)*** −5.544 7(0.703 5)*** −4.892 0(0.735 9)*** −6.690 3(0.850 9)*** 单木初始胸径 D 0.074 7(0.009 8)*** 0.032 9(0.011 8)** −0.033 8(0.013 4) −0.001 4(0.013 9) 大于对象木断面积 Bal 4.979 1(0.235 2)*** 4.514 0(0.244 0)*** 3.975 3(3.975 3)*** 4.321 2(0.323 5) *** 公顷断面积 Basal area −0.261 8(0.014 8)*** −0.239 7(0.018 1)*** −0.195 0(0.021 9)*** −0.217 7(0.022 0) *** 公顷株数 N 0.225 3(0.051 1)*** 0.513 9(0.122 6)*** 0.306 8(0.131 3)* 0.617 2(0.141 5) *** 平均林龄 a −0.016 8(0.001 5)*** −0.011 9(0.003 4)*** −0.012 8(0.003 5)*** −0.009 1(0.003 9)* 年平均温度 MAT 0.161 7(0.034 3)*** 0.238 1(0.101 2)* 0.225 8(0.104 5)* 0.354 0(0.116 4)* 年平均夏季(5—9月)降水量 MSP −0.002 8(0.000 4)*** −0.003 9(0.000 6)*** −0.004 3(0.000 6)*** −0.003 1(0.000 7)*** 上一年8月至当年7月的降雪量 PAS 0.023 4(0.001 8)*** 0.051 6(0.003 2)*** 0.053 0(0.003 3)*** 0.053 8(0.003 5)*** AIC 15 347 14 566 14 417 14 433 BIC 15 424 14 601 14 459 14 474 −2LogL 15 329 14 546 14 393 14 409 AUC 0.779 0.838 0.852 0.850 LRT M1/M2(LRT = 783,$p < 0.001$) M2/M3(LRT = 153,$p < 0.001$) M2/M4(LRT = 137,$p < 0.001$) 随机效应方差矩阵 D 0.968 5 $\left[ {{array}{*{20}{c}} {2.905\;0}&{{\rm{ - }}0.165\;3} \\ {{\rm{ - }}0.165\;3}&{0.014\;1} {array}} \right]$ $\left[ {{array}{*{20}{c}} {7.333\;6}&{{\rm{ - }}4.458\;8} \\ {{\rm{ - }}4.458\;8}&{3.139\;5} {array}} \right]$ 注:*为$p < 0.05$;**为$p < 0.01$;***为$p < 0.001$。M1~M4为相对应的模型编号。
Note: *is $p < 0.05$;**is $p < 0.01$;***is $p < 0.001$. M1~M4 is corresponding model number.Table 3. The result of parameter estimate based on generalized linear model and generalized linear mixed model in tree mortality
表3的模拟结果表明,当模型考虑了样地的随机效应后,AIC、BIC、−2
LogL值均比没考虑样地的随机效应值要小,说明在构建单木枯损模型时考虑随机效应的模拟效果要优于不考虑随机效应的模型。利用LRT对不同的模型进行方差分析,考虑样地随机效应后,与固定效应模型相比,差异均达到极显著水平( $p < 0.001$ );当同时考虑截距和随机系数效应后比单独考虑随机截距效应,模型的模拟效果要好,差异也达到极显著($p < 0.001$ )。在胸径和截距上考虑随机效应的AIC、BIC、−2LogL等3个指标值最小,说明M3的模拟效果最好。在本研究中,M3的AUC值等于0.852 > M4(0.850)> M2(0.838)> M1(0.779),也说明M3模型是构建蒙古栎单木枯损模型的最优模型。 -
从表3可知,M1和M2中单木初始胸径值与枯损概率呈正比,而M3和M4中单木初始胸径值与枯损概率呈反比,说明单纯一个胸径因子不足以表述单个林木在林分中的地位和状态。大于对象木断面积与枯损概率呈正比,说明大于对象木断面积值越小,处于竞争的优势,不容易发生枯损,这与林分中现实情况相符。林分公顷断面积与单木枯损概率呈反比,反映了在给定同样公顷株数的林分条件下,随着林分公顷断面积增加,林分内的树木胸径更大,处于竞争的优势,则枯损概率降低。林分平均年龄与单木枯损概率呈反比,说明枯损容易在幼龄林中发生,而随着林分的生长和成熟,林木胸径变大,枯损概率降低,林木也不易发生枯损。林分公顷株数与单木枯损概率呈正比,说明在密度大的林分,林木之间对于光、热、水肥等营养的竞争更加激烈,林木容易发生枯损。
-
在表3的模拟结果中,年平均温度(MAT)、年平均夏季(5—9月)降水量(MSP)、上一年8月至当年7月的降雪量(PAS)对枯损有明显的影响。MAT与单木枯损概率呈正相关,同样PAS也与单木枯损概率呈正相关。而MSP与单木枯损概率呈负相关。气象因子的影响说明,气候变化引起的干旱或霜冻对单木枯损有重要的影响。
-
根据相应的阈值标准,本研究枯损株数与总林木株数的比为0.06,则割点阈值选择为A = 0.06。而传统阈值0.5被舍去。图1列出了随机阈值和错误分类率最小的阈值。其中基础模型(M1)的随机阈值为B = 0.08,而错误分类率最低阈值为C = 0.07(图1(a))。混合模型(M3)的随机阈值为B = 0.07,而错误分类率最低阈值为C = 0.06(图1(b))。
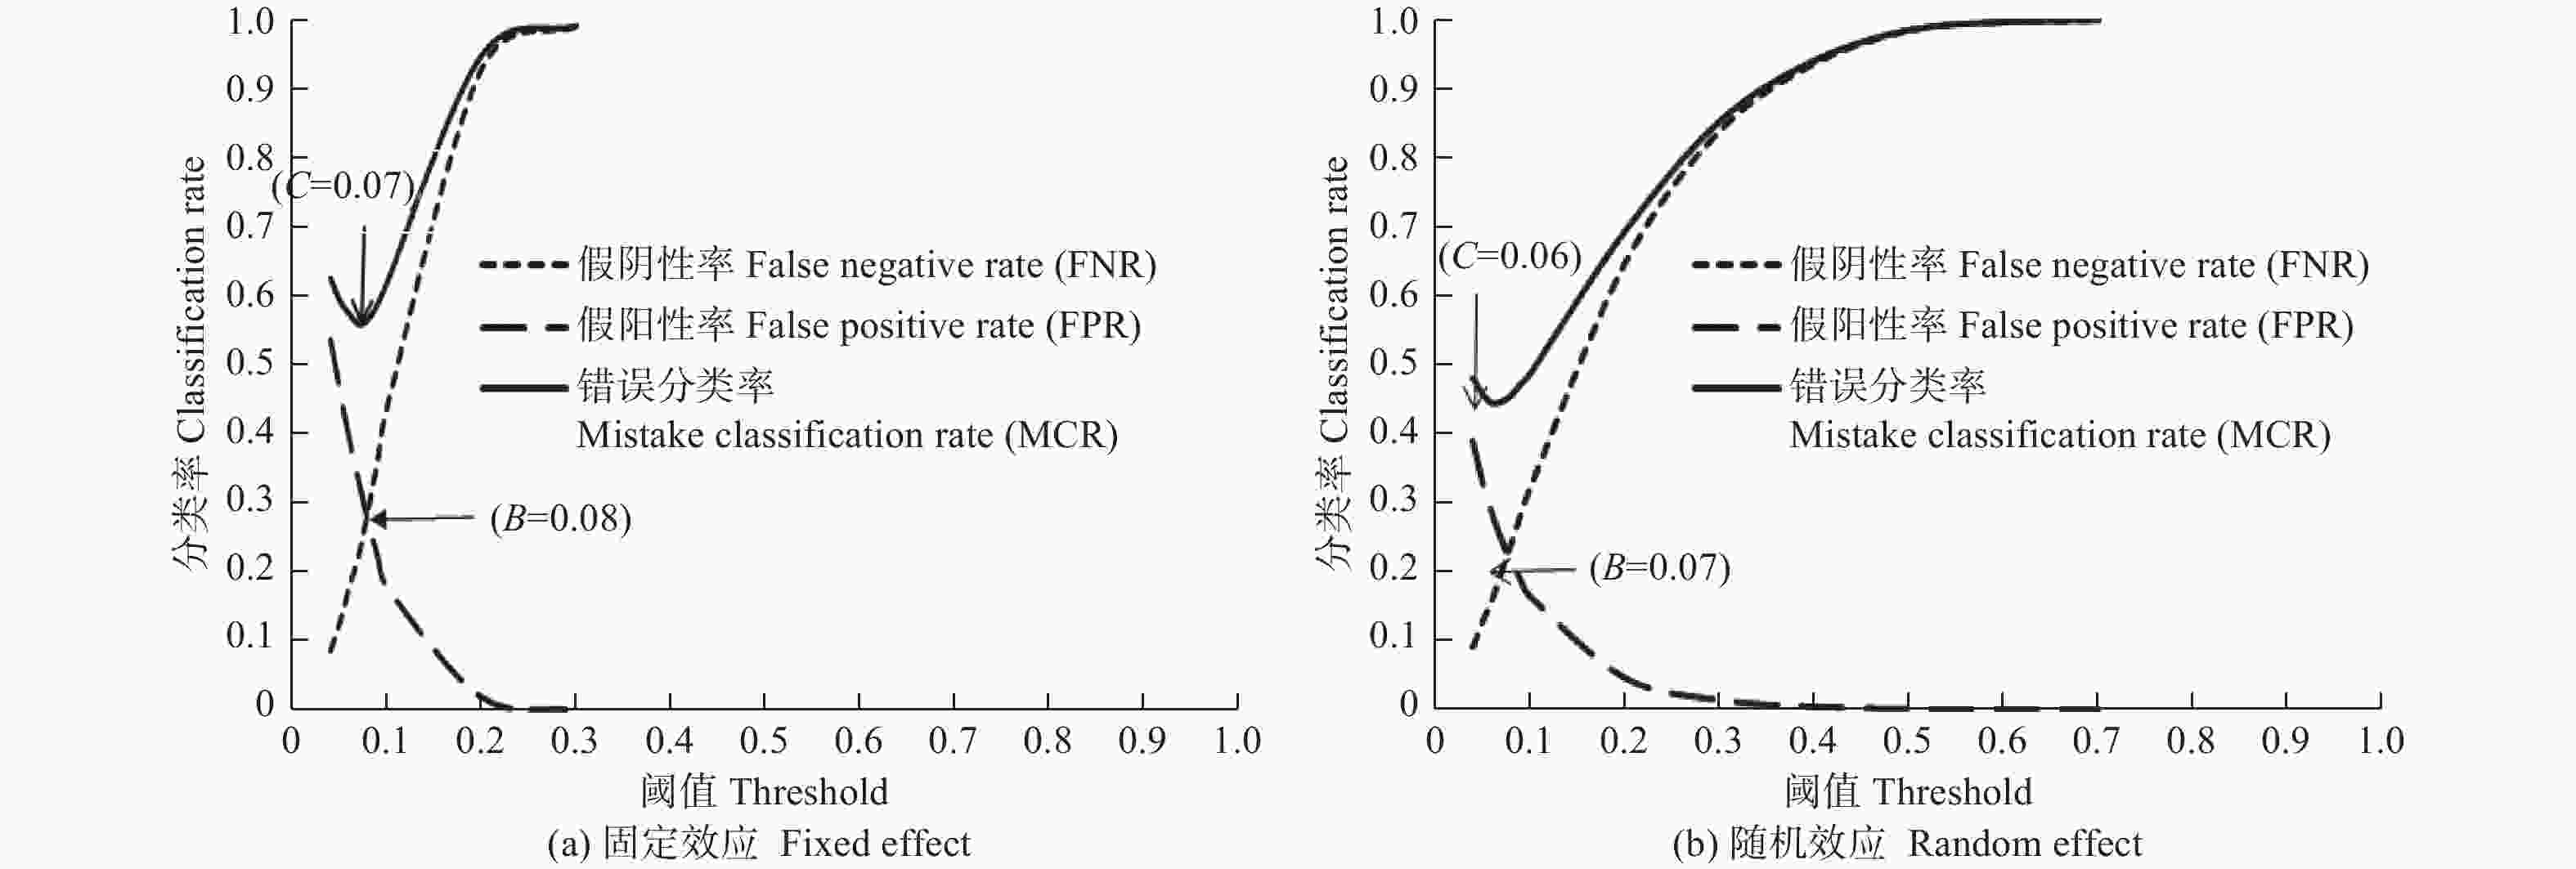
Figure 1. Relationship of classification rate and threshold for the mortality model of Mongolian oak
表4表明,基础模型(M1)中,当阈值为0.06时枯损的准确分类率(TPR)最高,为81.9%,当阈值为0.08时,存活的准确分类率(TNR)最高,为72.7%;混合模型(M3)中,当阈值为0.06时枯损的准确分类率(TPR)最高,为84.1%,当阈值为0.07时,存活的准确分类率(TNR)最高,为75.4%。在考虑混合效应后,无论阈值为0.06、0.07或0.08,枯损和存活的准确分类率均高于基础模型,而枯损和存活的错误分类率均低于基础模型。通过计算总正确分类率(ACR),基础模型阈值为0.08时,总正确分类率最高,为72.6%;混合模型阈值为0.07时,总正确分类率最高,为75.7%。因此可以选择灵敏度与特异度曲线交叉时的阈值(随机阈值)作为最佳阈值。
列联表分析 Confusion matrix analysis 阈值分析结果 The result of threshold Positive1 = 枯损 Dead Negative0 = 存活 Living 预测分类变量
Classification of predicted varietyPositive1 = 枯损 Dead TPR(M1) 81.9%(A = 0.06) FPR(M1) 39.3%(A = 0.06) 70.6%(B = 0.08) 27.3%(B = 0.08) 77.3%(C = 0.07) 33.2%(C = 0.07) TPR(M3) 84.1%(A = C = 0.06) FPR(M3) 28.4%(A = C = 0.06) 80.4%(B = 0.07) 24.6%(B = 0.07) Negative0 = 存活 Living FNR(M1) 18.1%(A = 0.06) TNR(M1) 60.7%(A = 0.06) 29.4%(B = 0.08) 72.7%(B = 0.08) 22.7%(C = 0.07) 66.9%(C = 0.07) FNR(M3) 15.9%(A = C = 0.06) TNR(M3) 71.6%(A = C = 0.06) 20.0%(B = 0.07) 75.4%(B = 0.07) 基础模型 Fixed model(M1) ACR 62.0%(A = 0.06) MCR 57.4%(A = 0.06) 72.6%(B = 0.08) 56.7%(B = 0.08) 67.5%(C = 0.07) 55.7%(C = 0.07) 混合模型 Mixed model(M3) ACR 72.4%(A = C = 0.06) MCR 44.3%(A = C = 0.06) 75.7%(B = 0.07) 44.5%(B = 0.07) Table 4. Confusion matrix result of tree mortality model of Mongolian oak
-
根据表3的模拟结果,分别利用M1和M3模型形式对验证数据每株树木进行枯损概率的计算,最后计算各自的AUC值,并比较各模型的灵敏度。其中,M3的模型形式,由于考虑了样地的随机效应,则首先要求出验证数据中样地的随机效应参数值,然后再计算枯损概率。随机效应参数计算方法可参考Vonesh and Chinchilli[27]。
最后计算出M1模型的AUC值为0.763,M3模型的AUC值为0.766。计算结果表明,在截距和胸径上同时考虑随机效应的M3模型的AUC值高于M1模型的AUC值,说明M3模型的灵敏性和特异性要好于M1模型,这与模拟数据中的结论一致。


3.1. 单木和林分因子对枯损的影响
3.2. 气象因子对枯损的影响
3.3. 阈值分析
3.4. 模拟验证
-
(1)在本研究中,单木枯损模型不仅存在着样地效应,而且还存在着单木水平上的效应。在模型中已经包含了单木的初始胸径,再考虑单木水平的随机效应,通常情况下(经验)精度会有所提高,但在本研究中精度并没有提高,相反还远远降低。造成的主要原因是在模型中已经包含了单木的初始胸径,另外涉及到模型的复杂性问题,不一定能提高精度。因此再考虑单木水平的随机效应,在实际中对于预测并不现实也没有意义。另外,在预测单木枯损概率时,如果有先验信息被利用,则就可以估计随机效应参数值,这样就能够提高模型的估计和预测精度[28]。
(2)一般来讲在一个林分内,胸径大的树木在林分中处于竞争有利的地位,而胸径小的树木处于不利地位,就容易枯损[29]。但是在本研究中,M1和M2模型中单木初始胸径与枯损概率呈正比,M3和M4模型中单木初始胸径与枯损概率呈反比。除了数据本身和统计方面的原因外,也说明单纯一个胸径因子不足以表述单个林木在林分中的地位和状态,例如一个林分内都是胸径小的林木,或者是都是胸径大的林木,则造成个别林木枯损的原因就不是林木本身的大小,而是其他原因,例如病虫害会造成很多大树死亡。大于对象木断面积反映林木的竞争状态,在同一林分内胸径小的树木,大于对象木断面积值就大,处于竞争的劣势。林分公顷断面积把单木大小和密度结合起来,是一个很好的表达林分拥挤程度的指标,能够反映系统性竞争[30]。与林龄类似,林分公顷断面积与单木枯损呈反比,幼、中龄林株数多但断面积小竞争激烈,近熟林以上就已经过了竞争激烈的阶段,林木枯损逐渐变少。林分公顷株数是一个重要的影响因子,在给定年龄和地位指数条件下,林分密度越大,树木越容易枯损[4],这给森林经营者在制定森林采伐方案及时间上提供了很好的科学依据。本研究通过逐步回归方法,林龄保留在模型中,意味着随着林龄的增加枯损率降低,间接的说明枯损极易发生在密度大的幼龄林里,随着林分的生长和稳定,枯损率逐渐降低。
(3)随着全球气候的变化及极端天气的经常出现,气象因子与枯损也具有直接的关系。与林分因子相比,本研究中的3个气象因子对枯损的影响要略微小一些,这可能是由于林木本身的特性及林分密度折中了一部分气象因子的影响。与很多学者的研究结论一致,年平均温度与枯损率呈正比[31-32]。年平均夏季(5—9月)降水量(MSP)与枯损率呈反比,说明随着温度的升高,夏季降水量的降低,容易引起干旱,进而会增加树木枯损的概率。一般情况下,冬季降雪量是一个降水量指标,其值的增加会降低枯损的发生,但本研究中恰好相反,PAS与枯损呈正比,可能的原因是吉林东南部随着冬季降雪量的增加会增加局部冻害发生的概率,增加了树木枯损的概率。
(4)本研究虽然考虑了立地因子的影响,但是在逐步回归过程中,都因为不显著而被移除出模型。不显著的原因可能是数据主要来源于吉林省东南部地区,局部的海拔和坡度差别小。本研究由于没有优势木平均高数据,无法计算地位指数而被舍弃。但是并不能说明地位指数对枯损没有影响。阈值分析是研究枯损时十分重要的工作,能够有效提高模型的判别精度。最佳阈值点并不一定是枯损正确率最高的阈值点,不仅要考虑枯损判断正确率,还要考虑存活树木的判断正确率,否则会有很多实际存活的树木被错误地判断为死亡树木,反之亦然。本研究在确定阈值时,确定灵敏度与特异度的交点为最佳阈值点,这与Chen等[33]的结论一致。本研究中平均枯损率为0.06,与最佳阈值点明显接近,在实际中为了方便也可直接作为最佳阈值点。
-
研究表明,单木初始胸径对枯损的影响比较复杂,要结合具体林龄等因素综合考虑。大于对象木断面积值越小,林分公顷株数越小,林分公顷断面积和林龄越大,单木枯损率越低。年平均温度(MAT)越高,年平均夏季(5—9月)降水量(MSP)越低,上一年8月至当年7月的降雪量(PAS)越大,单木枯损率越高。当模型考虑了样地的随机效应后,AIC、BIC、−2
LogL值均比没考虑样地的随机效应值要小;当同时考虑截距和随机系数效应后比单独考虑随机截距效应模型的模拟效果要好,差异达到极显著( $p < 0.001$ )。在胸径和截距上考虑随机效应的AIC、BIC、−2LogL等3个指标值最小,模型的模拟效果最好,而AUC值最大,达到0.852。验证数据也支持上述结论。最佳阈值的确定能够同时提高树木枯损和存活的预测准确性。

 DownLoad: