• 中国中文核心期刊
  • 中国科学引文数据库(CSCD)核心库来源期刊
  • 中国科技论文统计源期刊(CJCR)
  • 第二届国家期刊奖提名奖
Volume 34 Issue 1
Jan.  2021
Article Contents
Turn off MathJax

Citation:

Quantitative Real-time PCR Analysis of Fokienia hodginsii During Selection of Reference Genes

  • Corresponding author: ZHENG Yu-shan, zys1960@163.com
  • Received Date: 2020-04-10
    Accepted Date: 2020-05-09
  • Objective To Screen the stable internal control genes for fluorescence quantitative PCR analysis in different tissues of Fokienia hodginsii. Method Based on transcriptone data of F. hodginsii, the root, bark and leaf of F. hodginsii were selected as materials, the cDNA mixture of different tissues of F. hodginsii in 5 mass concentrations (0.32, 1.6, 8, 40 and 200ng·μL−1) were established as models, 8 genes (ACT7, UBQ, EF2, CACs, TIP41, UBC2b, RH8 and GAPDH) were selected as the candidate genes. The expression stability of the candidate genes were evaluated by real-time fluorescent quantitative PCR combined with geNorm, NormFinder and BestKeeper software. Stable candidate genes in evaluation results were selected as the internal control genes and their stabilities were verified by analyzing the relative expression of four terpene synthase target genes (FhTPS1, FhTPS2, FhTPS3 and FhTPS4) in different tissues of F. hodginsii. Result The results by analyzing with the three kinds of software showed that the most stable internal control genes in different tissues were ACT7 and UBC2b. The results of fluorescent quantitative PCR analysis showed that ACT7 and UBC2b were stably expressed in different tissues of F. hodginsii. The relative expression levels of the four target genes were different among the tissues of F. hodginsii. The relative expression level of FhTPS1 was the highest in root, FhTPS2 and FhTPS4 were the highest in leaf, FhTPS3 was the highest in bark. Conclusion Of the 8 candidate reference genes, ACT7 and UBC2b are suitable as internal control genes for expression analysis due to they are stably expressed among tissues of F. hodginsii and not affected by the changes of cDNA mass concentration, the combination of two genes is normalized stably and improves the accuracy of quantitative analysis. RH8 is not suitable as internal control gene due to its instability.
  • 加载中
  • [1]

    Luo M, Gao Z, Li H, et al. Selection of reference genes for miRNA qRT-PCR under abiotic stress in grapevine[J]. Scientific Reports, 2018, 8(1): 4444. doi: 10.1038/s41598-018-22743-6.
    [2]

    Artico S, Nardeli S M, Brilhante O, et al. Identification and evaluation of new reference genes in Gossypium hirsutum for accurate normalization of real-time quantitative RT-PCR data[J]. Bmc Plant Biology, 2010, 10(1): 49-56. doi: 10.1186/1471-2229-10-49
    [3]

    Saddhe A A, Malvankar M R, Kumar K. Selection of reference genes for quantitative real-time PCR analysis in halophytic plant Rhizophora apiculata[J]. Peerj, 2018, 6: e5226. doi: 10.7717/peerj.5226. eCollection 2018.
    [4]

    Vanguilder H D, Vrana K E, Freeman W M. Twenty-five years of quantitative PCR for gene expression analysis[J]. Biotechniques, 2008, 44(5): 619-626. doi: 10.2144/000112776
    [5]

    Huis R, Hawkins S, Neutelings G. Selection of reference genes for quantitative gene expression normalization in flax (Linum usitatissimumL.)[J]. Bmc Plant Biology, 2010, 10(1): 71-79. doi: 10.1186/1471-2229-10-71
    [6]

    Xia W, Xiao M, Huang L, et al. Identification of the valid reference genes for quantitative RT-PCR in annual ryegrass (Lolium multiflorum) under salt stress[J]. Molecules, 2009, 20(3): 4833-4847.
    [7]

    Yin Q Y, Chen S F, Guo W, et al. Pronounced genetic differentiation in Fokienia hodginsii revealed by simple sequence repeat markers[J]. Ecology and evolution., 2018, 8(22): 10938-10951. doi: 10.1002/ece3.4560
    [8] 周成城, 徐文达, 陈凌艳, 等. 福建柏种质资源的保护和利用研究进展[J]. 亚热带农业研究, 2019, 15(4):271-278.

    [9]

    Chen X, Chen H, Yuan J S, et al. The rice terpene synthase gene OsTPS19 functions as an (S)-limonene synthase in planta and its overexpression leads to enhanced resistance to the blast fungus Magnaporthe oryzae[J]. Plant Biotechnology Journal, 2018, 16(10): 1778-1787. doi: 10.1111/pbi.12914
    [10]

    Vandesompele J, De Peter K, Pattyn F, et al. Accurate normalization of real-time quantitative RT-PCR data by geometric averaging of multiple internal control genes[J]. Genome Biology, 2002, 3(7): research0034.1.
    [11]

    Andersen C L, Jensen J L, Ørntoft T F. Normalization of real-time quantitative reverse transcription-PCR data: a model-based variance estimation approach to identify genes suited for normalization, applied to bladder and colon cancer data sets[J]. Cancer Research, 2004, 64(15): 5245-5250. doi: 10.1158/0008-5472.CAN-04-0496
    [12]

    Pfaffl M W, Tichopad A, Prgomet C, et al. Determination of stable housekeeping genes, differentially regulated target genes and sample integrity: BestKeeper-Excel-Based tool using pair-wise correlations[J]. Biotechnology Letters, 2004, 26(6): 509-515. doi: 10.1023/B:BILE.0000019559.84305.47
    [13] 叶友杰, 谢德金, 杨德明, 等. 巴戟天实时荧光定量PCR内参基因的选择[J]. 中草药, 2020, 51(4):1060-1068. doi: 10.7501/j.issn.0253-2670.2020.04.033

    [14] 张 颖, 陈婉婷, 陈冉红, 等. 杉木实时荧光定量PCR分析中内参基因的选择[J]. 林业科学研究, 2019, 32(2):65-72.

    [15]

    Wu Y, Tian Q, Huang W, et al. Identification and evaluation of reference genes for quantitative real-time PCR analysis in Passiflora edulis under stem rot condition.[J]. Molecular biology reports, 2020, 47(4): 2951-2962. doi: 10.1007/s11033-020-05385-8
    [16]

    Wei L, Miao H, Zhao R, et al. Identification and testing of reference genes for Sesame gene expression analysis by quantitative real-time PCR[J]. Planta, 2013, 237(3): 873-889. doi: 10.1007/s00425-012-1805-9
    [17] 宋晓波, 常英英, 刘 昊, 等. 核桃不定根发生阶段内参基因筛选与关键基因表达分析[J]. 园艺学报, 2019, 46(10):1907-1918.

    [18] 张燕梅, 王瑞芳, 杨子平, 等. 剑麻内参基因筛选与稳定表达分析[J]. 热带作物学报, 2019, 40(11):2166-2173. doi: 10.3969/j.issn.1000-2561.2019.11.010

    [19] 张 玥, 陈 娟, 谢泰祥, 等. 多花兰实时荧光定量PCR内参基因的筛选[J]. 分子植物育种, 2019, 17(24):8163-8169.

    [20] 晋海军, 王海霞, 刘绍红, 等. 川续断根实时荧光定量PCR内参基因的筛选[J]. 分子植物育种, 2018, 16(24):7998-8004.

    [21] 吝月爱. 玉米在非生物胁迫和激素处理条件下实时荧光定量PCR内参基因的选择[D]. 四川: 四川农业大学, 2012: 42-46.

    [22]

    Deng L, Wu Y, Li J, et al. Screening reliable reference genes for RT-qPCR analysis of gene expression in Moringa oleifera[J]. PLoS One, 2016, 11(8): e0159458. doi: 10.1371/journal.pone.0159458
    [23]

    Nicholls C, Li H, Liu J. GAPDH: A common enzyme with uncommon functions[J]. Clinical Experimental Pharmacology Physiology, 2012, 39(8): 674-679. doi: 10.1111/j.1440-1681.2011.05599.x
    [24]

    Chen C, Chen R, Wu S Y, et al. Genome-wide analysis of Glycine soja ubiquitin (UBQ) genes and functional analysis of GsUBQ10 in response to alkaline stress[J]. Physiologia Plantarum, 2018, 164(3): 268-278. doi: 10.1111/ppl.12719
    [25]

    Fan C, Ma J, Guo Q, et al. Selection of Reference Genes for Quantitative Real-Time PCR in Bamboo (Phyllostachys edulis)[J]. Plos One, 2013, 8(2): e56573. doi: 10.1371/journal.pone.0056573
    [26]

    Cui B, Smooker P M, Rouch D A, et al. Selection of suitable reference genes for gene expression studies in Staphylococcus capitis during growth under erythromycin stress[J]. Molecular Genetics Genomics, 2016, 291(4): 1795-1811. doi: 10.1007/s00438-016-1197-9
    [27]

    Xiao Z, Sun X, Liu X, et al. Selection of reliable reference genes for gene expression studies on Rhododendron molle G. Don[J]. Frontiers in Plant Science, 2016, 7: 1547-1552.
    [28]

    Faccioli P, Ciceri G P, Provero P, et al. A combined strategy of “in silico” transcriptome analysis and web search engine optimization allows an agile identification of reference genes suitable for normalization in gene expression studies[J]. Plant Molecular Biology, 2007, 63(5): 679-688. doi: 10.1007/s11103-006-9116-9
  • 加载中
通讯作者: 陈斌, bchen63@163.com
  • 1. 

    沈阳化工大学材料科学与工程学院 沈阳 110142

  1. 本站搜索
  2. 百度学术搜索
  3. 万方数据库搜索
  4. CNKI搜索

Figures(5) / Tables(4)

Article views(4706) PDF downloads(36) Cited by()

Proportional views

Quantitative Real-time PCR Analysis of Fokienia hodginsii During Selection of Reference Genes

    Corresponding author: ZHENG Yu-shan, zys1960@163.com
  • 1. College of Landscape Architecture, Fujian Agriculture and Forestry University, Fuzhou 350002, Fujian, China
  • 2. College of Forestry, Fujian Agriculture and Forestry University, Fuzhou 350002, Fujian, China

Abstract:  Objective To Screen the stable internal control genes for fluorescence quantitative PCR analysis in different tissues of Fokienia hodginsii. Method Based on transcriptone data of F. hodginsii, the root, bark and leaf of F. hodginsii were selected as materials, the cDNA mixture of different tissues of F. hodginsii in 5 mass concentrations (0.32, 1.6, 8, 40 and 200ng·μL−1) were established as models, 8 genes (ACT7, UBQ, EF2, CACs, TIP41, UBC2b, RH8 and GAPDH) were selected as the candidate genes. The expression stability of the candidate genes were evaluated by real-time fluorescent quantitative PCR combined with geNorm, NormFinder and BestKeeper software. Stable candidate genes in evaluation results were selected as the internal control genes and their stabilities were verified by analyzing the relative expression of four terpene synthase target genes (FhTPS1, FhTPS2, FhTPS3 and FhTPS4) in different tissues of F. hodginsii. Result The results by analyzing with the three kinds of software showed that the most stable internal control genes in different tissues were ACT7 and UBC2b. The results of fluorescent quantitative PCR analysis showed that ACT7 and UBC2b were stably expressed in different tissues of F. hodginsii. The relative expression levels of the four target genes were different among the tissues of F. hodginsii. The relative expression level of FhTPS1 was the highest in root, FhTPS2 and FhTPS4 were the highest in leaf, FhTPS3 was the highest in bark. Conclusion Of the 8 candidate reference genes, ACT7 and UBC2b are suitable as internal control genes for expression analysis due to they are stably expressed among tissues of F. hodginsii and not affected by the changes of cDNA mass concentration, the combination of two genes is normalized stably and improves the accuracy of quantitative analysis. RH8 is not suitable as internal control gene due to its instability.

  • 实时荧光定量PCR(RT-qPCR)指在PCR反应体系中加入荧光基团,利用荧光信号积累实时监测整个PCR进程,最后通过标准曲线对未知模板进行定量分析的方法,具有准确性高、特异性好、试验过程简便等特点[1-2]。荧光定量试验结果的准确性和可靠性取决于特定引物的扩增效率、cDNA的纯度以及内参基因的稳定性等,稳定的内参基因能够使目的基因的定量分析结果准确、特异性好[3-4]。在不同植物间或同一植物不同组织部位间内参基因的表达稳定性有一定差异,通常会选择在植物生命活动全过程或外界环境变化时都能表达相对稳定、受环境影响较小的管家基因(Housekeeper gene),如肌动蛋白(Actin)、泛素蛋白(Ubiquitin)和甘油醛-3-磷酸脱氢酶(GAPDH)等[5-6]

    福建柏(Fokienia hodginsii(Dunn)Henry et Thomas)为柏科福建柏属,为我国特有种属,分布在福建、广东、云南、广西等我国南部省份[7];其树干通直、树型优美、四季常青、适应性强、抗性较好、材性稳定、结构细腻,是我国优良的材用-景观两用型树种之一。不仅如此,福建柏精油中含有多种药用、化工价值的成分,开发利用价值高[8]。但福建柏的研究集中于混交造林、成分分析等方面,随着研究的深入,分子生物学研究必不可少,如功能基因、转录因子的表达分析等研究,均涉及到使用荧光定量PCR技术检测目的基因的相对表达情况。本研究从福建柏转录组中选择了8个管家基因作为候选内参基因,包括肌动蛋白-7(Actin-7,ACT7)、泛素蛋白(Ubiquitin,UBQ)、延长因子-2(Elongation factor-2,EF2)、氯氰菊酯配合物(Clathrin adaptor complexes,CACs)、类Tip41家族蛋白(Tip41-like family protein,TIP41)、泛素结合酶E2(Ubiquitin-conjugating enzyme E2,UBC2b)、读框螺旋酶-8(READ box helicase 8,RH8)、甘油醛-3-磷酸脱氢酶(Glyceraldehyde-3-phosphate dehydrogenase,GAPDH)。通过qRT-PCR试验并结合geNorm、Normfinder和Bestkeeper软件进行分析,筛选出稳定性强的内参基因。选择4个福建柏萜类合成酶基因(FhTPS)作为目的基因,萜类化合物作为福建柏精油及挥发性气体中的主要成分之一,而萜类合成酶基因为萜类合成途径中的关键酶基因,具有重要的研究意义[9]。利用目的基因在福建柏不同组织部位的相对表达水平及模式来验证筛选出的内参基因的稳定性,为后续福建柏RT-qPCR试验的准确性、科学性提供技术支撑。

1.   材料与方法
  • 试验材料为20年生生长良好、无病虫害的福建柏鳞叶、树皮和根,于2019年8月采集于福建省福州市永泰县大湖国有林场的福建柏天然林,使用无菌水把材料清洗干净并用无菌滤纸擦干后,用锡箔纸包裹立即放进干冰中,带回实验室置于−80℃冰箱保存备用。在同一区块内取3棵树龄相近、长势一致的福建柏的鳞叶、树皮和根分别设置3个生物学重复用于总RNA提取、定量分析等试验。针对转录组测序,按以上方式单独采集了植物各部位材料的3次生物学重复用于测序。

  • 总RNA提取试剂盒购于天根生化科技有限公司;反转录试剂盒、TB Green Premix Ex TaqII购于TaKaRa公司;qRT-PCR仪为Applied BiosystemsTM7500;分光光度仪为NanoDrop 2000。

  • 将采集回来的福建柏根、皮和鳞叶3个组织部位的植物材料立即送往武汉迈特维尔生物科技有限公司进行无参转录组测序。按照总RNA提取试剂盒说明书和反转录试剂盒说明书的操作步骤分别提取福建柏3个组织部位的总RNA,并进行浓度测定和琼脂糖凝胶电泳检测。后反转录合成cDNA第一条链。

  • 从福建柏转录组数据筛选出表达量高、表达稳定的TPS基因部分片段,经过NCBI-Blast比对后将匹配的TPS基因用Primer Premier 5.0软件设计4个FhTPS基因的RT-qPCR引物,同时筛选并设计福建柏8个候选内参基因(ACT7UBQEF2CACsTIP41UBC2bRH8GAPDH)的引物(表1),引物由福州铂尚测序公司提供。将设计好的引物用TB Green试剂盒进行RT-qPCR检测特异性(即是否产生二聚体),检测中模板用ddH2O代替,分析各引物的溶解曲线和高表达扩增情况。

    基因名称 Gene引物序列(5′→3′)
    Primer sequence(5′→3′)
    退火温度 Tm/℃扩增长度 Amplification length/bp
    ACT7 F:CTGCAGAGCGAGAAATTGTTCG 60.5 90
    R:TTCCCTTGGCTGTTTCAAGC 59.0
    UBQ F:TGCCGAACCTGAACTTTTGC 59.6 81
    R:TTTTTGCCTGAGTGCAGCTG 59.6
    EF2 F:TTGTACGTGTTGCAGTGCAG 59.3 78
    R:ACTTGGCAAGCCGTTTCAAC 59.9
    CACs F:TGTAGTAGATGCCGGACGTTTG 60.4 79
    R:TGTTCCTGGCATTCGCTTTG 59.4
    TIP41 F:AAATACGAGGGTTGGAGAGCAG 60.1 126
    R:ATGGGTTGCTTGTTGGAGTG 58.7
    UBC2b F:TTGATGCAGCGAAGGAATGG 58.9 76
    R:TGCGATTTCCTGACAATCCG 58.6
    RH8 F:ACTCCAATTTCACGCCCTTC 58.5 80
    R:ACAGGCGCTTGACTTTGAAG 59.1
    GAPDH F:TCGATTCGAAGGCCAGTATAGC 60.0 130
    R:TTGCGAGAACCAACGAATGC 59.8
    FhTPS1 F:TGGTGAACGTGCTGAAAAGC 59.6 139
    R:ATGGCGATCAATTCCAAGGC 59.0
    FhTPS2 F:TCTGAATACCTCGAACGTGTGG 60.1 134
    R:ATTCCGAGGCATTGCAACTC 58.9
    FhTPS3 F:TTGCTCCCAAGTTGCATTCC 58.8 72
    R:AGCCCACTTGTCAAAAGTCC 59.7
    FhTPS4 F:TGGTGTGGATTCTTCTGCAC 58.1 88
    R:TCGGAAATGTTGCCCAATCC 58.8

    Table 1.  Primer of reference genes and TPS genes of Fokienia hodginsii

  • 将福建柏根、树皮和鳞叶反转录得到cDNA稀释至200 ng·μL−1,设置5个质量浓度梯度,以5倍浓度稀释,得到200、40、8、1.6、0.32 ng·μL−1 5个质量浓度的cDNA样品。把各质量浓度3个组织部位稀释好的cDNA混合至一个离心管中,充分混匀后以此为模板。将8个候选基因4个FhTPS基因用TB Green试剂盒进行RT-qPCR实验,反应体系TB Green Premix Ex Taq 10 μL,正反引物各0.8 μL,RoxII 0.4 μL,ddH2O 6 μL。在内参基因筛选中按照5个质量浓度梯度作为cDNA的质量浓度,在FhTPS基因进行验证定量分析中按照TB Green 试剂盒说明书要求以100 ng·μL−1作为cDNA的质量浓度。扩增程序:95℃反应30 s;95℃反应5 s,60℃反应34 s,共40个循环;溶解曲线:95℃反应15 s,60℃反应1 min,95℃反应15 s。每个候选内参基因在不同部位和不同浓度均设置4个重复,后用Ct(2−ΔΔCT)法计算8个候选内参基因和4个FhTPS基因在福建柏根、皮和鳞叶中的相对表达量。

  • 利用3个内参基因稳定性评价软件geNorm[10]、Normfinder[11]和BestKeeper[12],对8个候选内参基因的稳定性进行统计分析,筛选出适合于福建柏各组织的稳定内参基因及组合。

2.   结果与分析
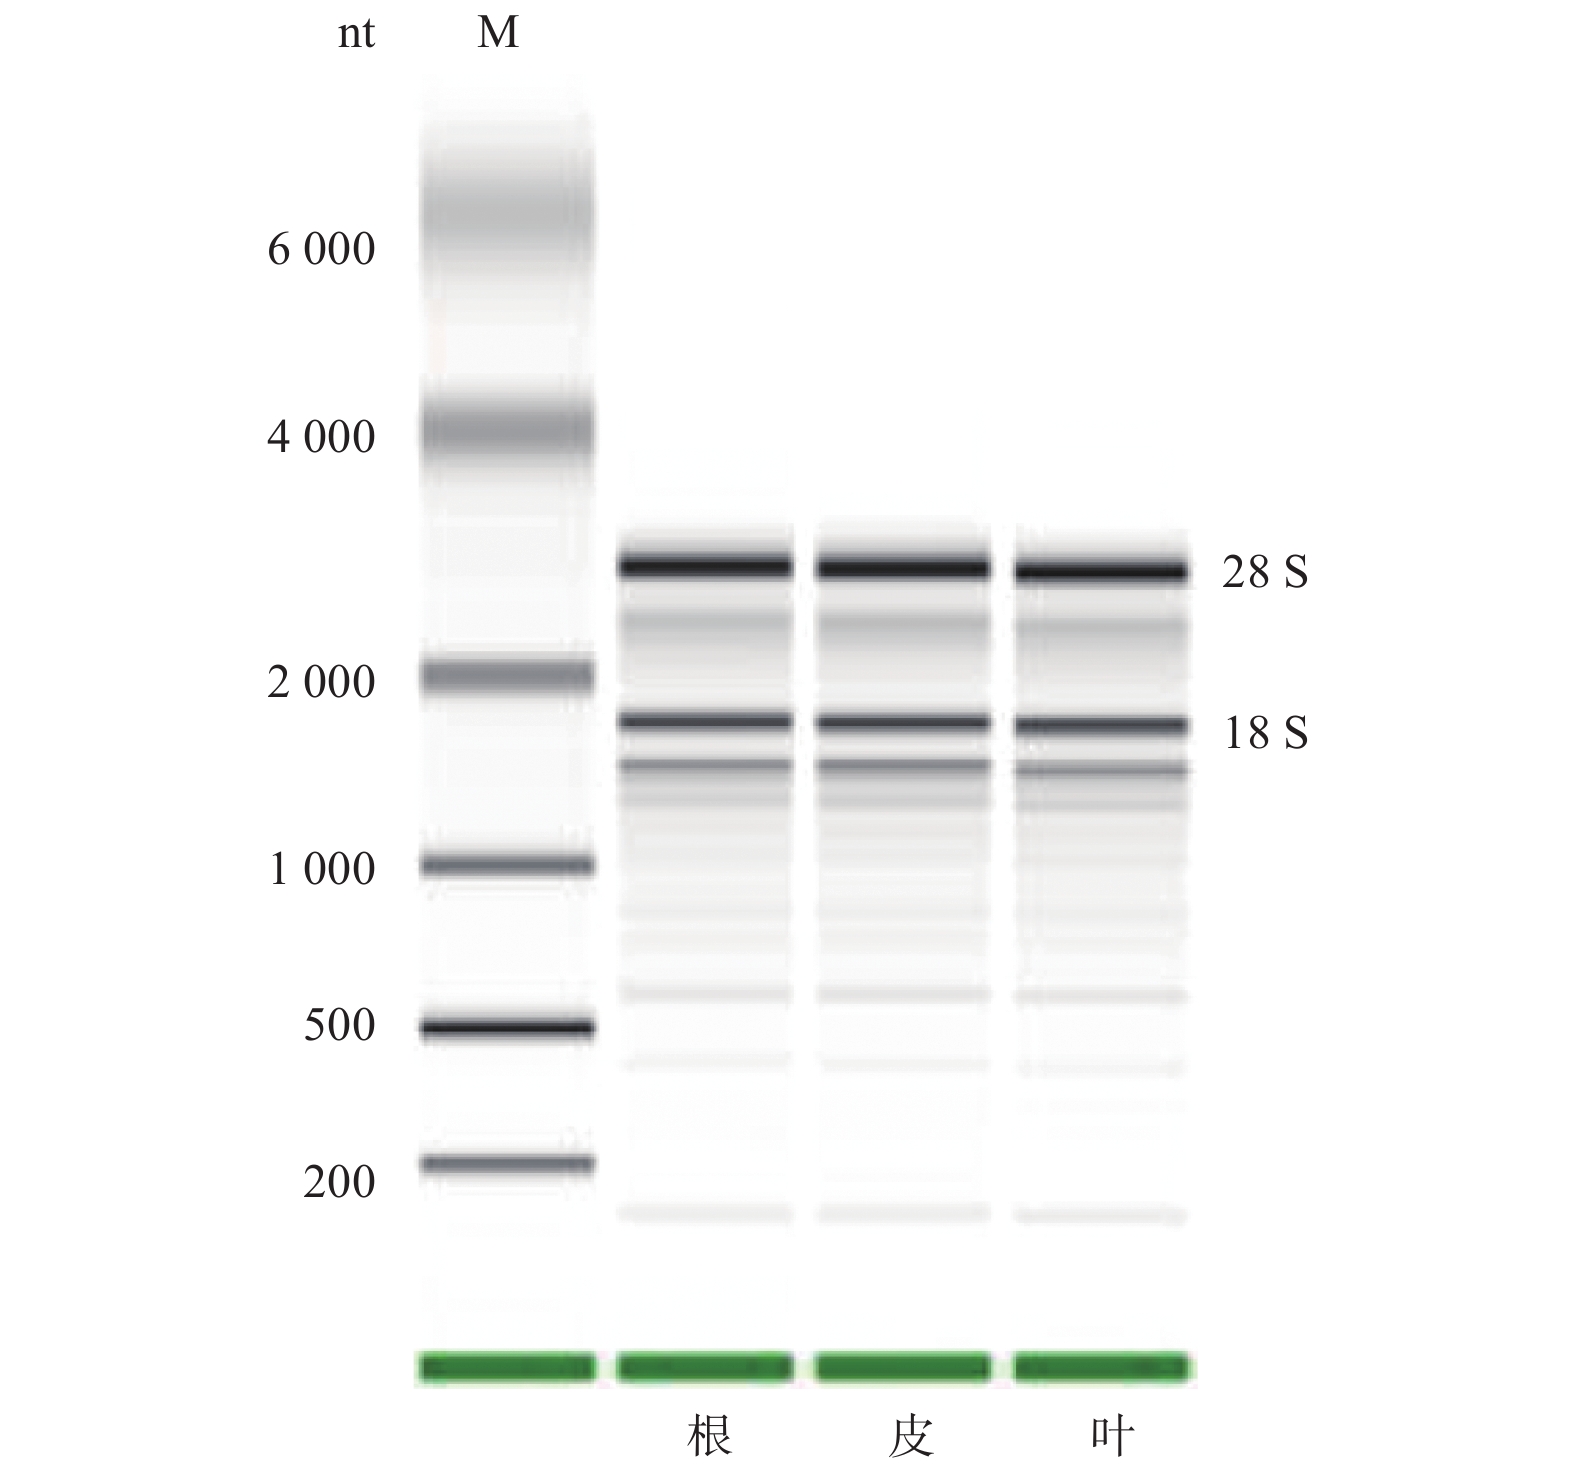
  • 由测序得到的福建柏转录组数据中,通过拼接得到330 521条转录本序列,平均长度为721 bp,可用于后续分析使用。利用1.5%琼脂糖凝胶电泳检测总RNA质量,检测结果条带清晰,28S rRNA比18S rRNA条带更亮。同时利用分光光度仪进行纯度检测,结果显示:A260/A280比值均在1.8~2.0之间。因此,可以说明RNA无降解、完整性良好(图1)。

    Figure 1.  Total RNA agarose gel electrophoresis

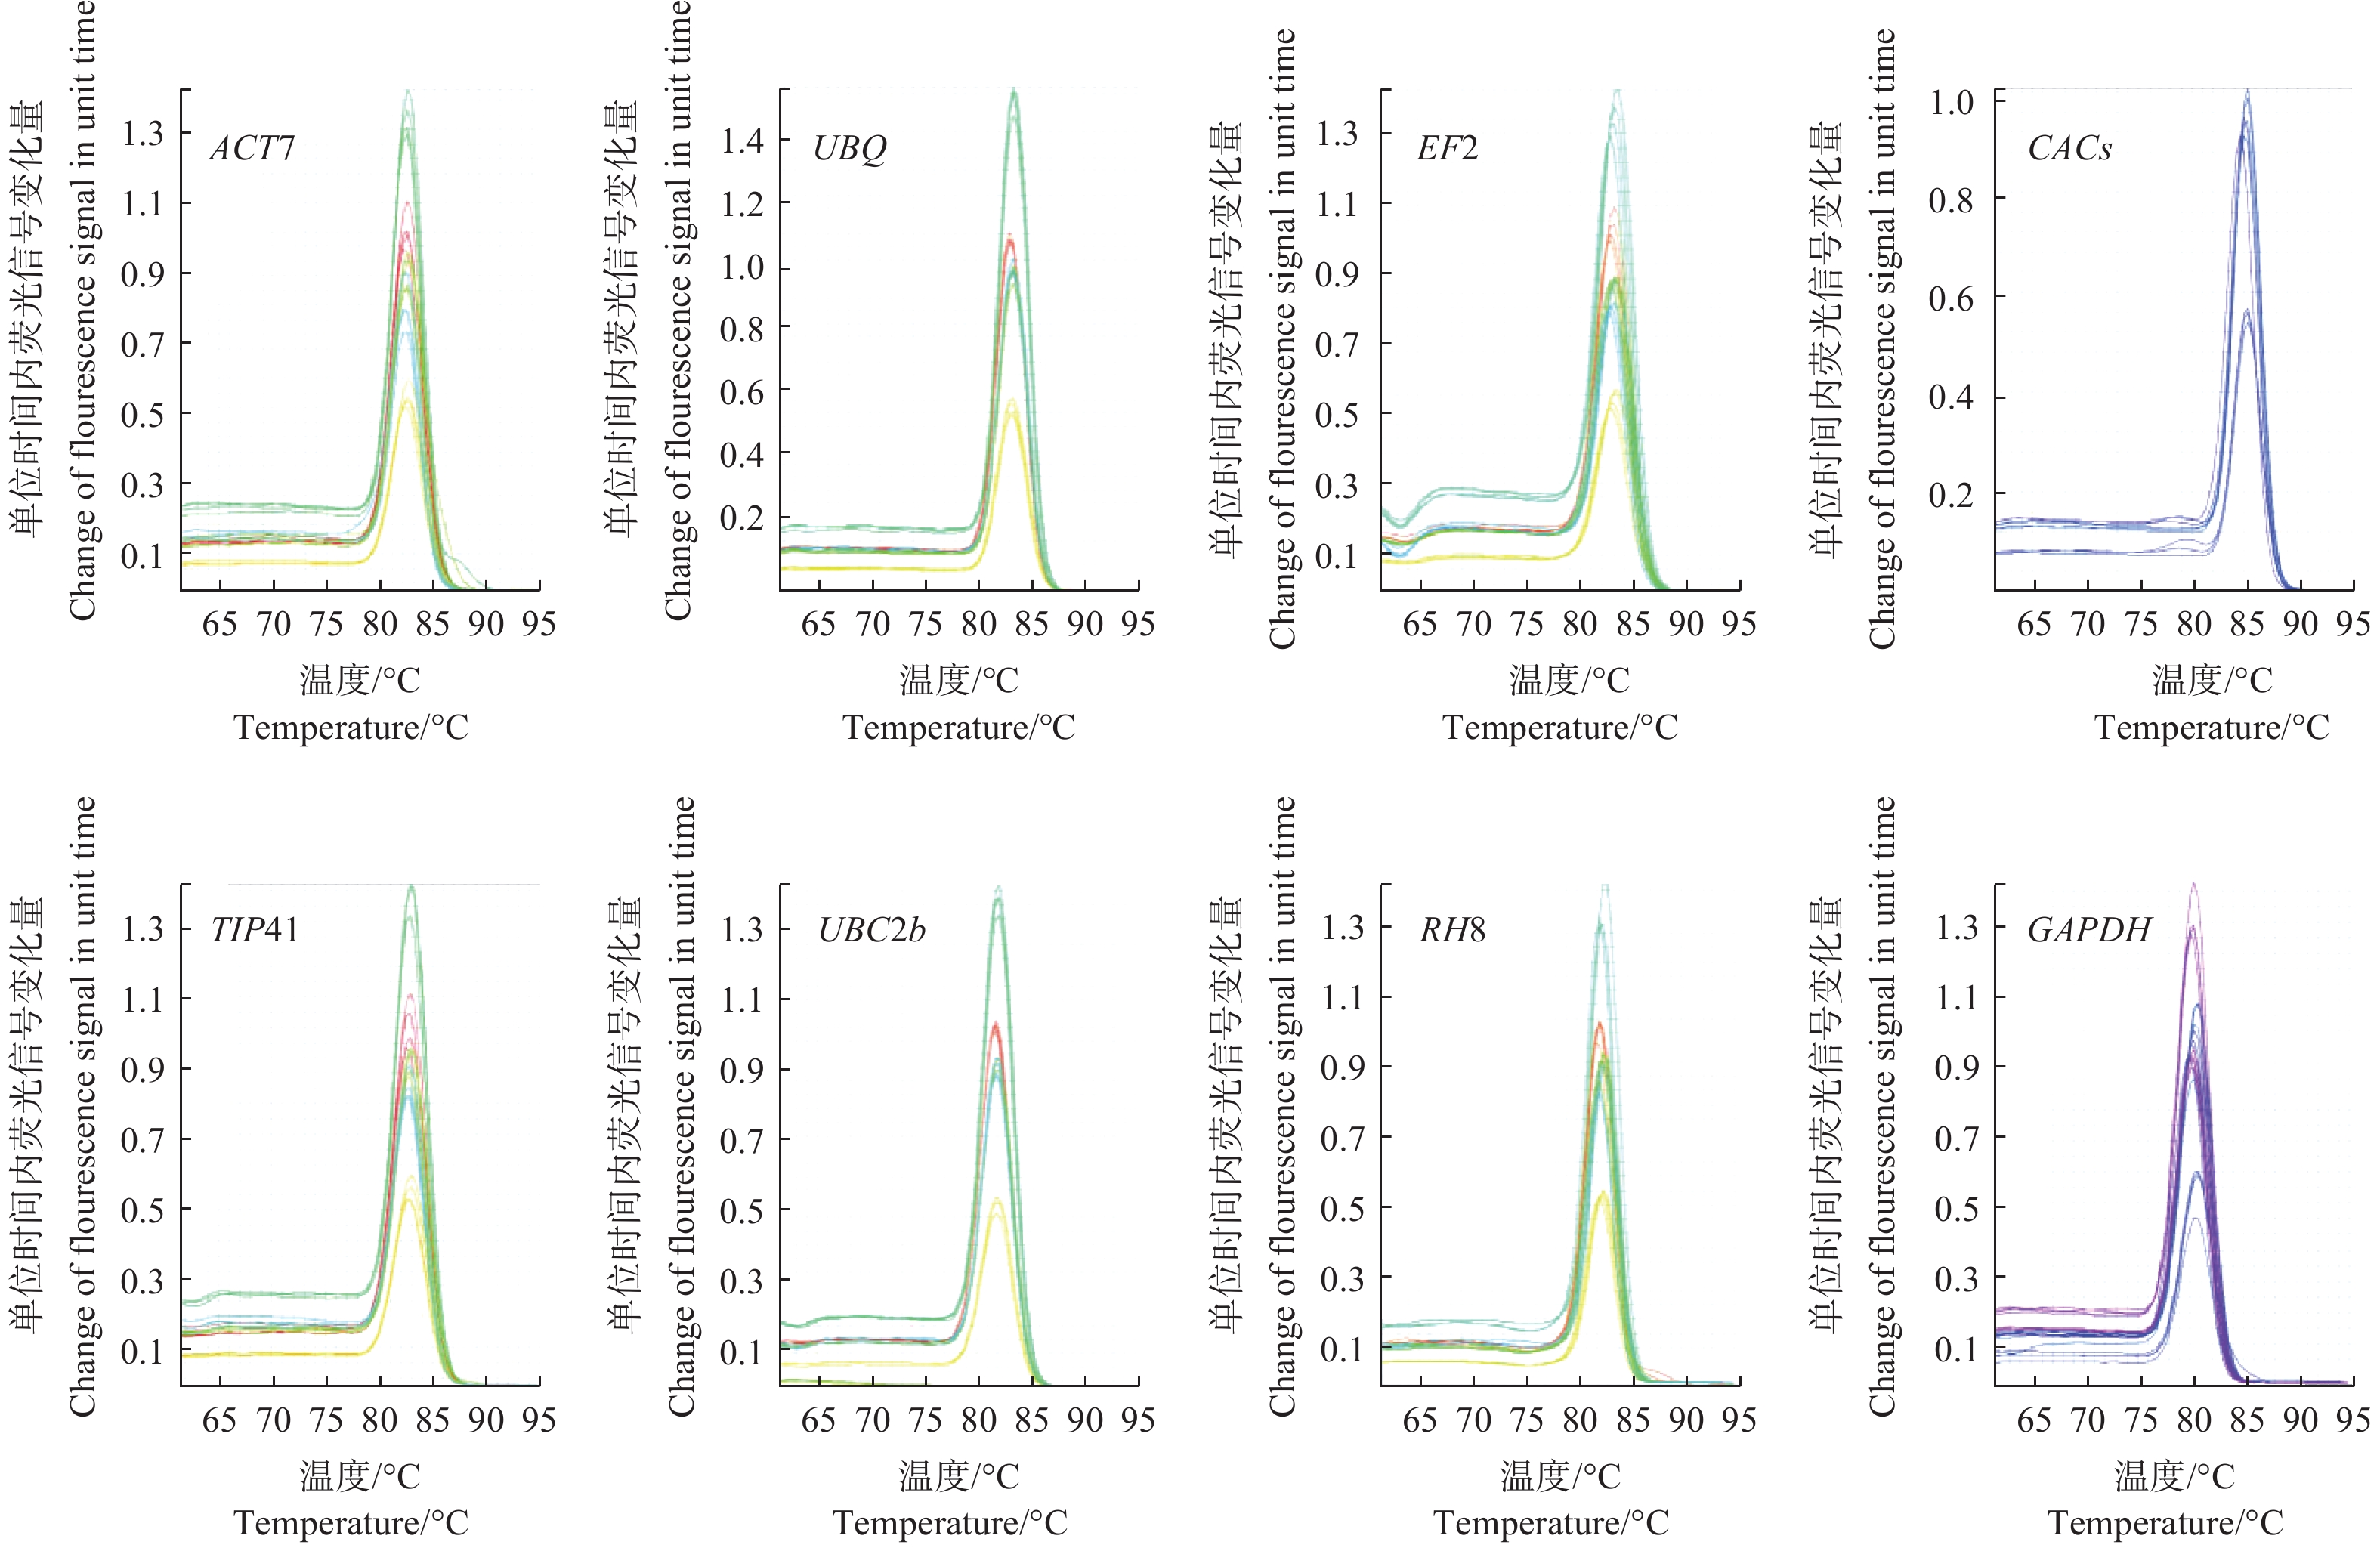
  • 通过RT-qPCR的扩增,结果显示:8个候选内参基因的扩增效率为98.32%~104.79%,相关系数R2为0.973~0.999,符合内参基因的初步要求, 可进行进一步反应;而且8个候选内参基因扩增产物的溶解曲线均为单一峰, 特异性较好, 熔解温度(Tm)均在80~90℃之间, 可用于进一步分析(图2)。

    Figure 2.  Melting curves of the candidate reference genes

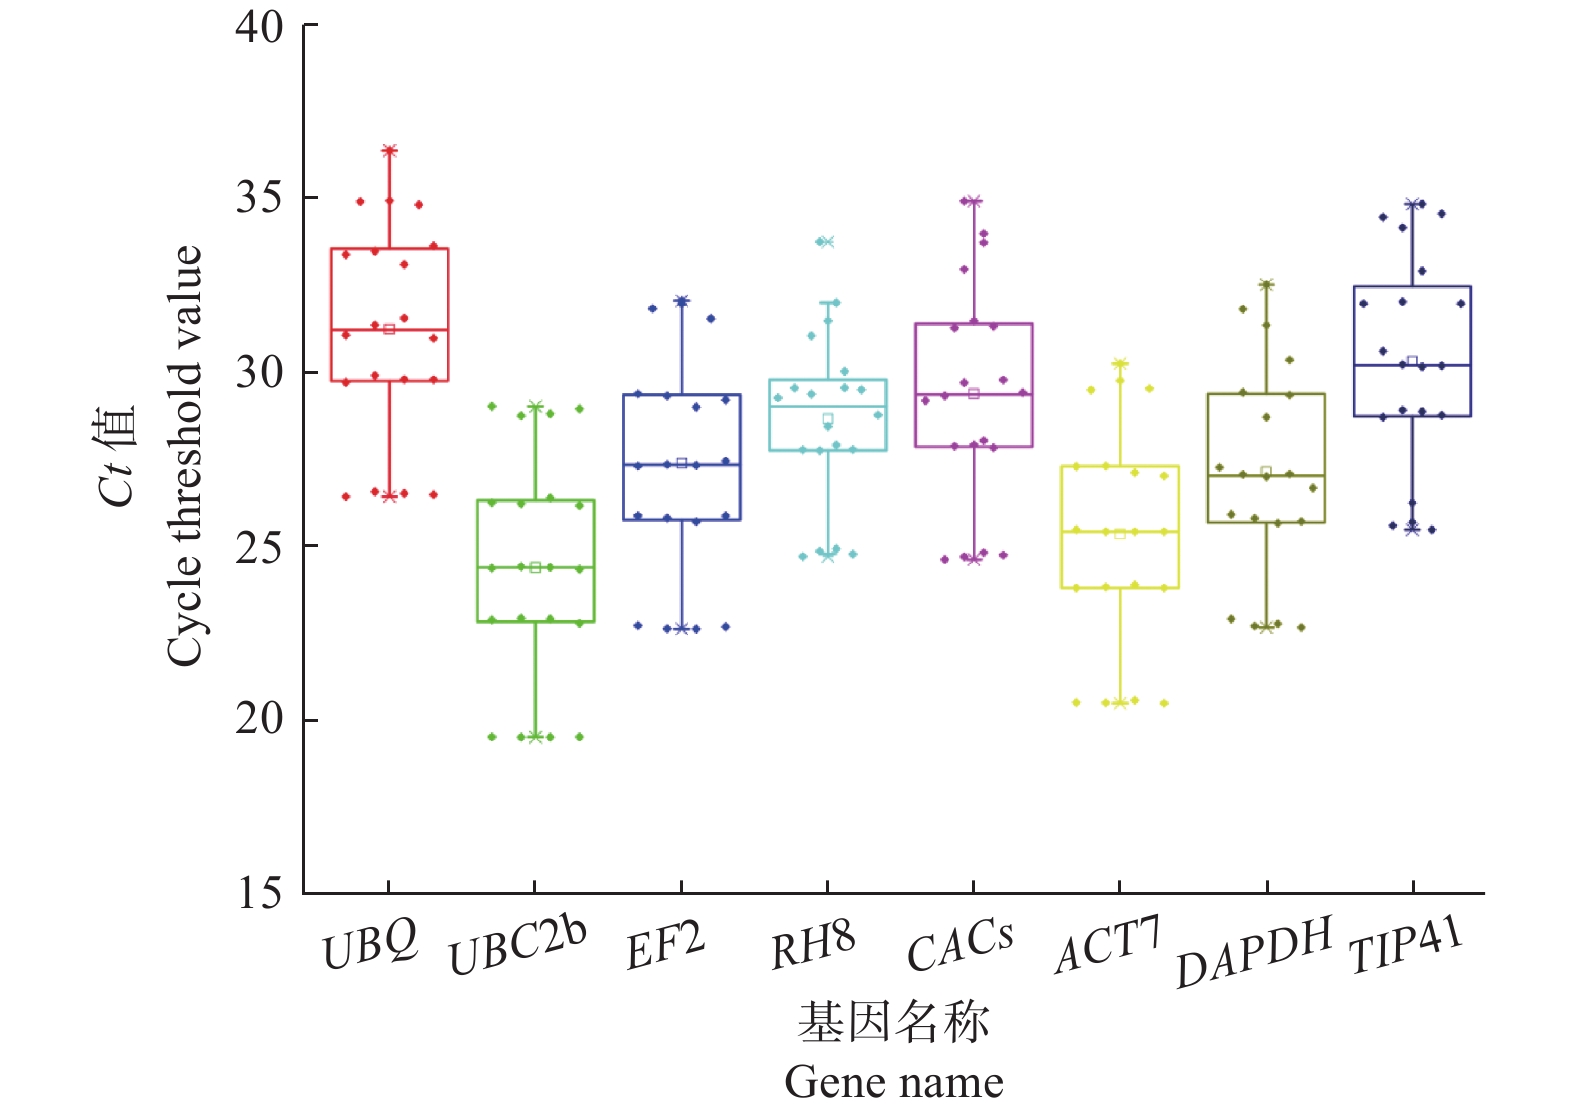
  • 从RT-qPCR实验获得的各候选内参基因Ct值与其表达丰度成反比,Ct值越大,基因表达量越低[13]。结果(图3)显示:从5个质量浓度的Ct值综合分析,所选择的8个候选内参基因的平均值最低的为UBC2b(24.40),平均值最高的为UBQ(31.25)。从各质量浓度单独分析,从高浓度至低浓度过渡时,Ct值均逐渐增大,符合表达规律。而且5个质量浓度梯度下各候选内参基因的平均Ct值大小规律一致,说明试验误差较小。UBQ在各质量浓度下Ct值明显高于其他7个候选内参基因,不适合作为内参基因来检测高丰度基因的表达情况。

    Figure 3.  The cycle threshold values of candidate reference genes in 5 mass concentrations of cDNA mixture

  • geNorm软件是通过计算候选内参基因的平均稳定指数M值来对比候选内参基因的稳定性,M = 1.5为稳定性分界线,当M值低于1.5时,可判定该候选内参基因较稳定,且M值越低,该内参基因的稳定性越高[14]。软件分析结果表明:在各处理中,8个候选内参基因M值均低于1.5,说明候选内参基因的表达均较稳定。表2可知:在5个质量浓度下,M值最小的均为ACT7。在质量浓度为8、200 ng·μL−1时,RH8的M值最大;在质量浓度为1.6、40 ng·μL−1时,DAPDH的M值最大;在质量浓度为0.32 ng·μL−1时,TIP41的M值最大。说明ACT7在geNorm软件分析下的稳定性最好,而RH8DAPDH的稳定性较差。

    排名
    Ranking
    0.32 ng·μL−11.6 ng·μL−18 ng·μL−140 ng·μL−1200 ng·μL−1
    基因名称Gene name稳定性M值Stability value基因名称Gene name稳定性M值Stability value基因名称Gene name稳定性M值Stability value基因名称Gene name稳定性M值Stability value基因名称Gene name稳定性M值Stability value
    1 ACT7 0.037 ACT7 0.042 ACT7 0.046 ACT7 0.126 ACT7 0.289
    2 UBC2b 0.040 RH8 0.043 UBC2b 0.050 EF2 0.131 EF2 0.297
    3 UBQ 0.056 CACs 0.044 EF2 0.072 UBC2b 0.178 TIP41 0.323
    4 CACs 0.065 UBC2b 0.060 DAPDH 0.097 UBQ 0.219 UBC2b 0.339
    5 RH8 0.068 TIP41 0.068 TIP41 0.134 TIP41 0.327 CACs 0.548
    6 EF2 0.077 UBQ 0.073 CACs 0.179 CACs 0.559 DAPDH 0.649
    7 DAPDH 0.093 EF2 0.094 UBQ 0.208 RH8 0.765 UBQ 0.763
    8 TIP41 0.151 DAPDH 0.108 RH8 0.297 DAPDH 0.939 RH8 1.134

    Table 2.  Stability analysis of candidate reference genes of in different mass concentrations of cDNA by geNorm

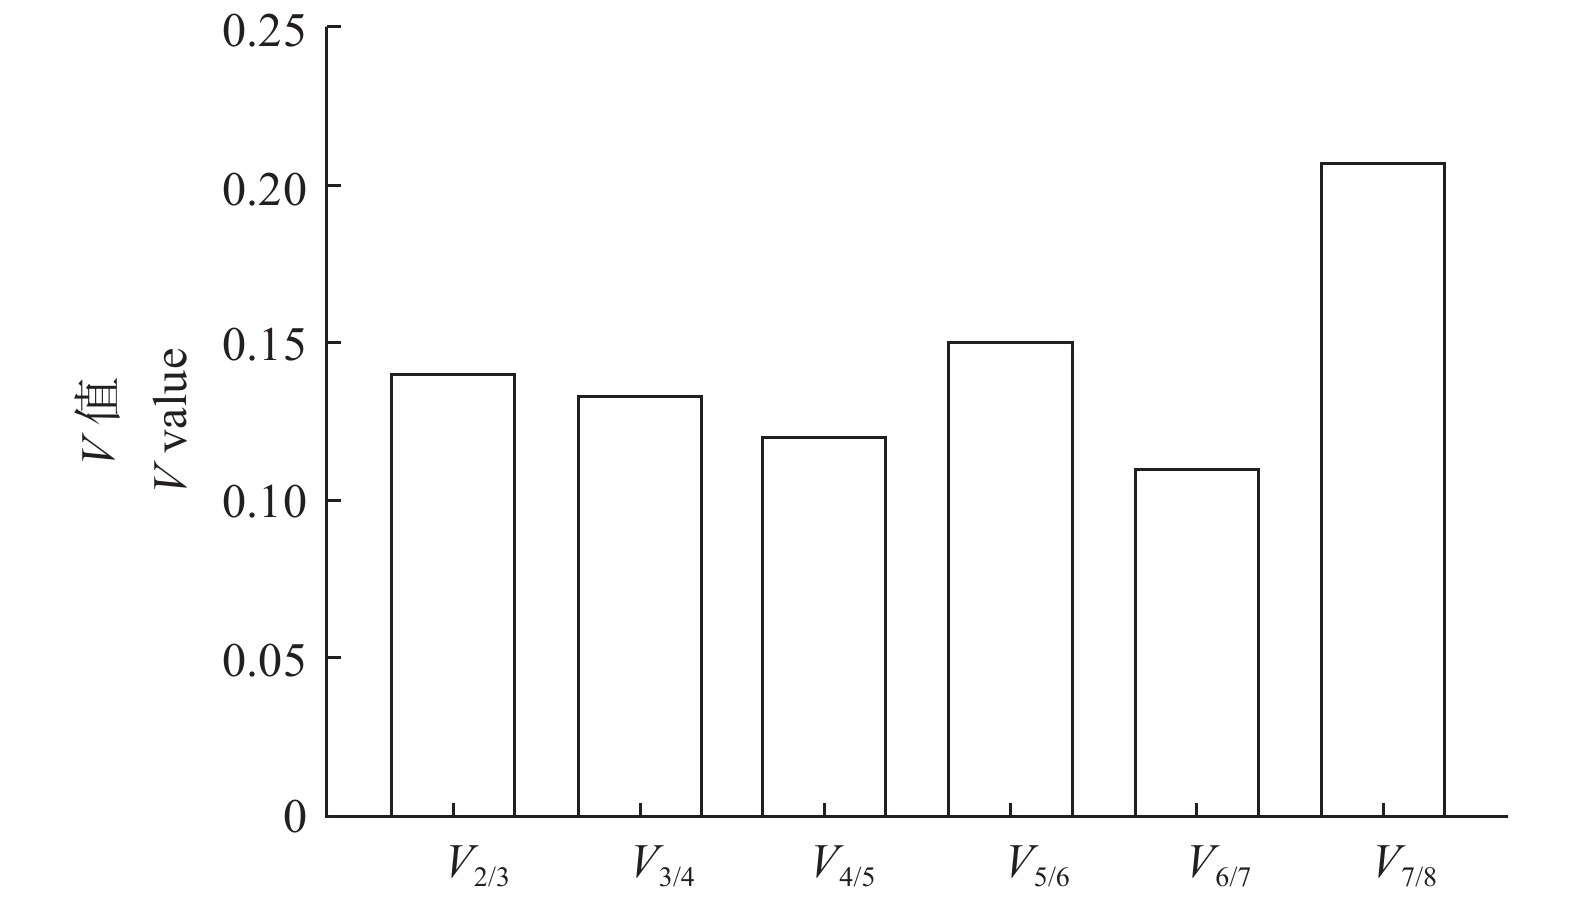
    在geNorm软件分析中,标准化因子的配对差异分析(Vn/Vn+1)是对候选内参基因最佳配对数目的衡量。当Vn/Vn+1=0.15为分界值,若Vn/Vn+1小于该数值说明n个内参基因可以实现稳定归一化[10]。结果(图4)表明:V2/V3V3/V4V4/V5V6/V7均小于0.15,说明在n=2时已经能够实现稳定归一化,即2个稳定内参基因的组合可以使定量结果更准确、可靠。

    Figure 4.  Analysis of optial number of reference genes for normalization by geNorm

  • 利用Normfinder软件分析8个候选内参基因得到候选内参基因的M值,根据M值越低基因表达越稳定的原则对候选内参基因进行比较。软件分析结果(表3)表明:8个候选内参基因的稳定性排序在5个质量浓度下各有不同,在质量浓度为0.32 ng·μL−1时,表达稳定性较好的是RH8CACsACT7,稳定性较差的是TIP41;在质量浓度为1.6、8 ng·μL−1时,表达稳定性较好的均为ACT7UBC2b,稳定性较差的分别是DAPDHRH8;在质量浓度为40 ng·μL−1时,表达稳定性较好的是EF2UBC2b,稳定性较差的是DAPDH;在质量浓度为200 ng·μL−1时表达稳定性较好的是TIP41ACT7,稳定性较差的是RH8

    排名
    Ranking
    0.32 ng·μL−11.6 ng·μL−18 ng·μL−140 ng·μL−1200 ng·μL−1
    基因名称Gene name稳定性M值Stability value基因名称Gene name稳定性M值Stability value基因名称Gene name稳定性M值Stability value基因名称Gene name稳定性M值Stability value基因名称Gene name稳定性M值Stability value
    1 RH8 0.014 ACT7 0.016 ACT7 0.023 EF2 0.063 TIP41 0.143
    2 CACs 0.015 UBC2b 0.032 UBC2b 0.025 UBC2b 0.083 ACT7 0.145
    3 ACT7 0.019 UBQ 0.066 DAPDH 0.072 UBQ 0.093 UBC2b 0.251
    4 UBC2b 0.053 TIP41 0.072 EF2 0.097 ACT7 0.106 EF2 0.318
    5 UBQ 0.056 RH8 0.076 TIP41 0.134 TIP41 0.137 CACs 0.672
    6 EF2 0.106 CACs 0.078 CACs 0.179 CACs 1.131 DAPDH 0.896
    7 DAPDH 0.137 EF2 0.115 UBQ 0.208 RH8 1.276 UBQ 1.106
    8 TIP41 0.319 DAPDH 0.137 RH8 0.297 DAPDH 1.350 RH8 2.176

    Table 3.  Stability analysis of candidate reference genes of in different mass concentrations of cDNA by Normfinder

  • BestKeeper软件可以通过计算每个基因直接产生配对的标准偏差(SD)、变异系数(CV)和相关系数变量(r)来评价内参基因的稳定性。表达稳定性好的基因一般呈现较高的r值、较小的SDCV[14]。此外,当SD值大于1时则表明基因的表达不稳定[13]。结果(表4)显示:在5个质量浓度梯度下,SD值和CV值较小的均为UBC2bEF2ACT7,其中,3个候选内参基因的SD值均小于0.1,CV值均小于0.4;而5个质量浓度梯度下的r值排序差异较大,其中,r值较大的为TIP41ACT7,较小的为UBC2b。将5个质量浓度下的SDCVr进行综合排序,稳定性较好的为UBC2bACT7EF2,稳定性较差的为DAPDHRH8

    综合排序
    Comprehensive bank
    基因名称
    Gene name
    SD
    CV
    r
    1 UBC2b 0.050 0.184 0.238
    2 ACT7 0.090 0.320 0.614
    3 EF2 0.086 0.298 0.332
    4 UBQ 0.206 0.618 0.364
    5 CACs 0.336 1.076 0.488
    6 TIP41 0.206 0.680 0.835
    7 DAPDH 0.368 1.262 0.339
    8 RH8 0.588 1.940 0.568
      注:SDCVr值均为不同质量浓度下的平均值。
      Note: SD, CV and r value are average value in different mass concentrations.

    Table 4.  Stability analysis of candidate reference genesin different mass concentrations of cDNA by BestKeeper
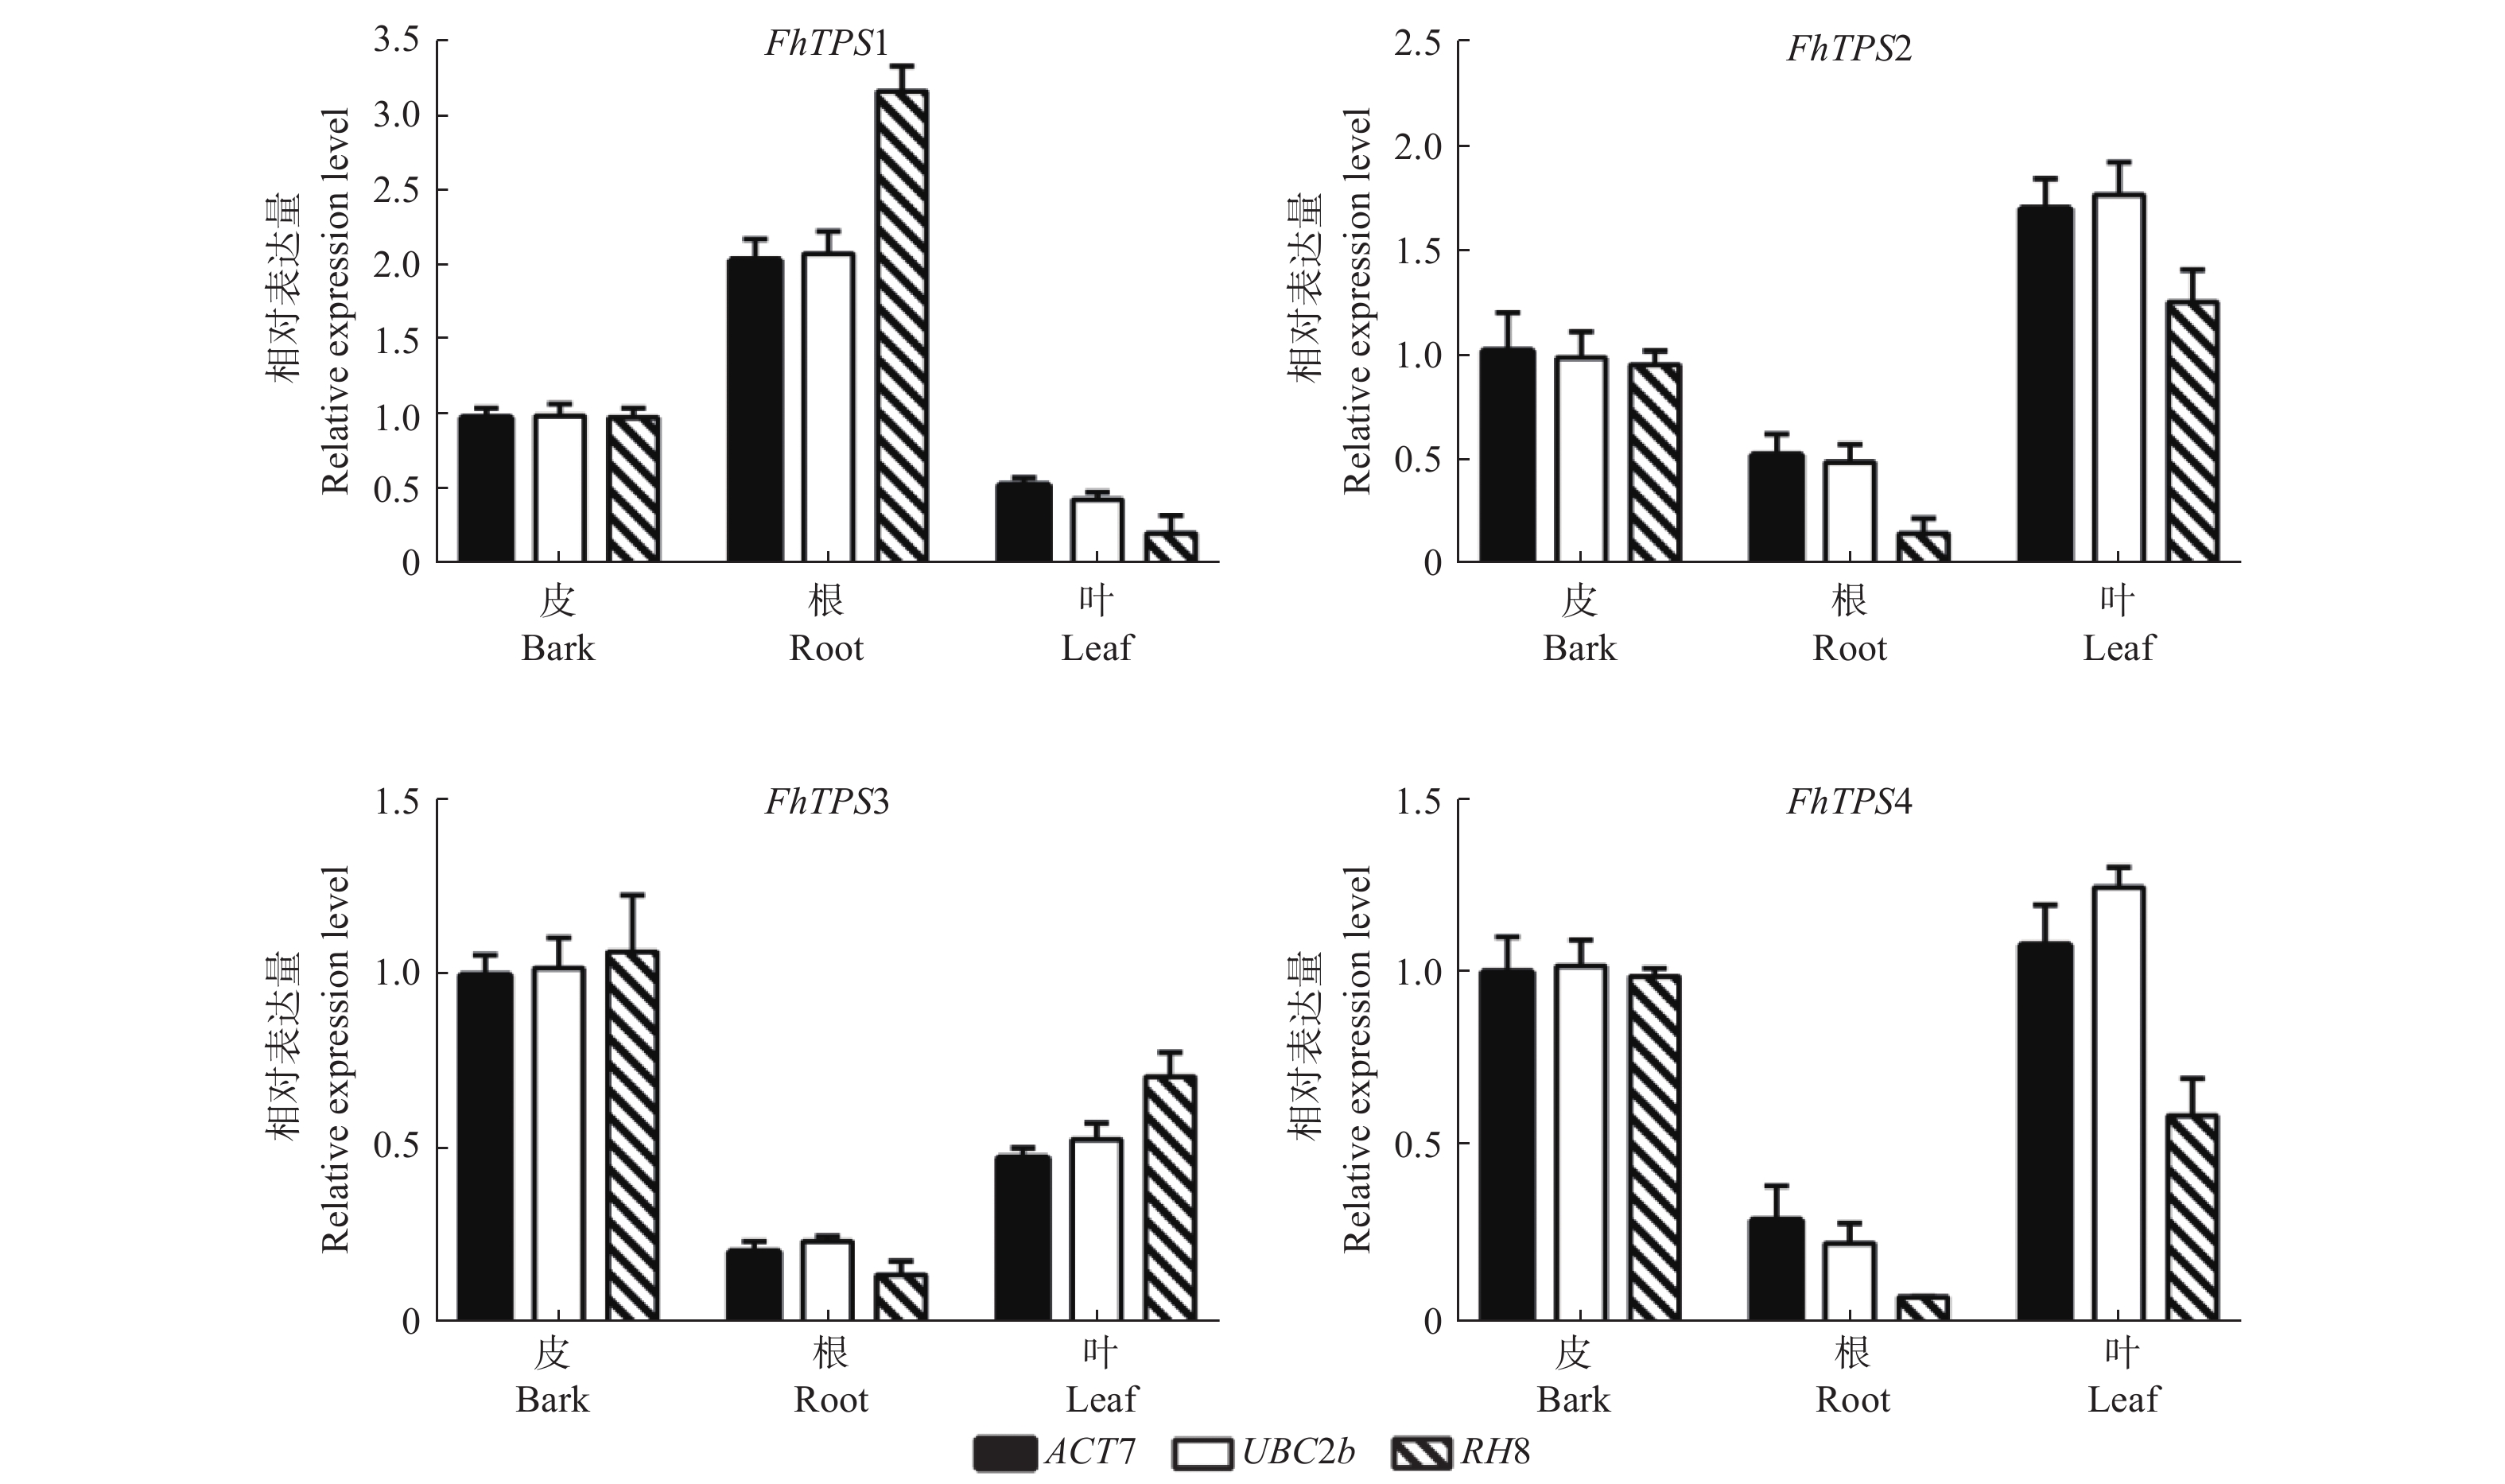
  • 根据3个分析软件得出的结果,选择稳定性较好的2个基因(ACT7UBC2b)进行验证,以稳定性较差的RH8基因作为对照,同时利用4个FhTPS基因验证内参基因在福建柏根、树皮、鳞叶3个不同组织中的表达稳定性。结果(图5)显示:4个FhTPS基因在福建柏的根、树皮、鳞叶3个不同组织的相对表达量趋势一致,符合转录组数据中FPKM(Reads Per Kilobase per Million)值中的变化规律,从而验证了FhTPS基因能够在福建柏3个组织部位中稳定表达。4个基因在以ACT7UBC2b作为内参基因时,表达趋势一致且稳定,验证了ACT7UBC2b有较好的稳定性,2个作为组合进行基因表达量分析时能够相互印证,增加定量结果的准确性。以RH8为内参基因时,4个基因的表达趋势波动较大,验证了RH8稳定性较差。

    Figure 5.  The candidate reference genes as test reference gene in the analysis of target gene expression

3.   讨论
  • 实时荧光定量PCR是基因表达分析研究中的重要技术之一,分析结果的准确性和重复性会受试验中各因素影响,其中,一个重要因素是内参基因的稳定性,较为稳定的内参基因,才能确保分析结果的准确性[15];而内参基因的稳定性是相对的,不同植物、不同组织部位、不同生长时期和不同试验条件均会影响内参基因的稳定性[16]。如Actin基因在核桃[17]中为理想的内参基因,而在剑麻[18]中表现不稳定;在多花兰的花器官中的理想内参基因为GAPDH,营养器官中则为28S rRNA[19];在川续断根的不同生长时期,筛选出的理想内参基因均不相同[20];玉米在多种非生物胁迫和不同激素处理下的理想内参基因均有所差异[21]。由此可知,在进行荧光定量PCR实验前,针对不同试验材料、试验条件等因素进行内参基因的筛选是有必要的。

    理想的内参基因在同一植物所有组织中均表达相对稳定且受内外因素影响较小,一般为细胞骨架的基本组成或参与生物体基本代谢调控过程的管家基因,如编码细胞骨架结构蛋白的ActinTUBTUA等基因[22];编码糖酵解、糖异生及光合作用碳固定循环过程中的关键酶GAPDH基因[23];标记待分解蛋白、跨膜蛋白的泛素UBCUBQ基因等等[24]。本研究根据前人研究报道的常用内参基因,在福建柏转录组数据库中选择8个候选内参基因,(ACT7UBQEF2CACsTIP41UBC2bRH8GAPDH),利用GeNorm、Normfinder和BestKeeper软件对这些基因在福建柏不同组织(根、皮和鳞叶)混合样品中的qPCR试验结果进行综合分析。3个软件对内参基因稳定性评价的一个重要指标为Ct值,理想的内参基因平均Ct值通常在15~30之间[13]。通过比较8个候选内参基因的Ct值,发现除UBQ以外,其它7个候选内参基因的Ct值均在该范围之内,同时在软件分析中UBQ稳定性也较差。

    geNorm和Normfinder软件均是根据M值来评价分析,2个软件分析结果中最稳定的均为ACT7,BestKeeper则显示UBC2b最稳定,说明不同软件分析得到的最稳定内参基因有一定差异。Fan等研究结果也验证了这一结论,其分析毛竹不同组织部位的稳定内参基因,在3个软件中候选内参基因的排名均有所不同[25]。在5个质量浓度(0.32、1.6、8、40和200 ng·μL−1)的不同组织cDNA混合样品中,geNorm和BestKeeper结果显示5个质量浓度中最稳定的均为ACT7,Normfinder结果显示5个质量浓度中最稳定基因各有差异,推测可能是cDNA混合样品中不同组织存在一定表达差异造成的,但综合其他2个软件分析结果,3个软件的总体结果仍趋于稳定的内参基因不会受到cDNA质量浓度变化的影响,ACT7为最稳定的内参基因。但单个内参基因往往会产生一些试验误差,2个及以上内参基因的组合可以减少误差,提高准确性[26]。如Xiao等以不同时期杜鹃花的不同组织为材料,分析单个内参基因和2个内参基因组合对目的基因的相对表达量进行分析,结果显示2个内参基因组合比单个内参基因的结果差异较小[27]。因此,geNorm软件分析中标准化因子的配对差异分析(Vn/Vn+1)有一定价值,其对候选内参基因最佳配对数目的衡量,判断内参基因能够实现稳定归一化的数量。geNorm结果显示V2/V3值小于0.15,说明2个内参基因的组合就能实现稳定归一化,即选择稳定性最好的ACT7UBC2b组合。

    利用软件分析并不能保证一个内参基因有准确的结果,还需在利用相关目的基因在特定试验条件下验证筛选出的内参基因的表达稳定性,才能得出真实可靠的定量数据[28]。因此,本研究选择4个FhTPS基因作为目的基因,以ACT7UBC2b组合作为内参基因,稳定性最差的RH8基因作为对照,分析了目的基因在福建柏根、皮和鳞叶中的表达。定量分析结果验证了筛选出的ACT7UBC2b能够使目的基因有较为稳定的相对表达水平且表达趋势一致,RH8稳定性差不适合作为内参基因,该结果与geNorm和BestKeeper软件分析结果一致,与Normfinder软件的结果有一定差异,但与3个软件的综合分析结果一致。因此,通过对目的基因的定量分析对筛选出的内参基因进行验证能够对软件分析的结果进行佐证,使内参基因筛选结果更具科学性。

4.   结论
  • 本研究通过对比分析ACT7UBQEF2CACsTIP41UBC2bRH8GAPDH共 8 个候选内参基因在福建柏不同质量浓度的各组织cDNA混合样品中RT-qPCR分析中的表达稳定性,利用3个分析软件综合分析并筛选获得了稳定表达的内参基因ACT7UBC2b,且ACT7UBC2b组合能够实现稳定均一化,使定量结果更可靠;RH8 表达不稳定,不适合作为内参基因。经过4个FhTPS目的基因的验证,确定了2个基因的稳定性。这对今后福建柏的基因定量表达研究有重要意义。

Reference (28)

Catalog

    /

    DownLoad:  Full-Size Img  PowerPoint
    Return
    Return