

-
林分密度是反映林木间拥挤程度及林木对其所占空间利用程度的指标,是影响林分生长和木材产量的重要因素。在整个森林培育过程中,密度控制是可人为干扰调控的重要手段,通过人为干预进行密度控制,使森林在整个生长过程中都能保持最佳密度,以获得更多的木材产量,提高人工林的生产力和森林稳定性,使森林发挥更大的经济、生态和社会功能。因此林分密度问题是林学家们关注的重要问题之一,如何控制和调整林分密度也成为森林经营者关心的重要问题[1-2]。
林分密度大小取决于单位面积上的林木株数、林木大小以及林木在林地上的空间分布情况[3]。为此林业工作者从树冠、胸径、树高、单位面积株数等测量因子角度出发进行研究,针对不同树种、立地条件、培育目标、林分生长发育阶段等提出了许多衡量、评定密度的指标——林分密度指标。目前的密度指标主要包括株数密度、林分断面积、蓄积量、郁闭度、疏密度、林分密度指数[4]、树冠竞争因子[5]、优势高—营养面积比[6]、冠积指数[7]等。前人研究表明优良的林分密度指标应具备如下几个条件:(1)计算简单;(2)容易测定;(3)与年龄和立地无关;(4)与林分生长量密切相关[8]。而满足以上全部标准的指标较少,在实际应用时要根据培育目的、林分年龄、立地条件等进行选择[9],每个密度指标因其相关的林分变量不同都有其各自的适用范围,而对于不同培育措施条件下的林分,由于生长与竞争过程的变化,不同密度指标的指示性可能会存在一定的动态差异。为此,本研究首次利用不同良种和不同初植密度两因素处理下的8年生杉木人工林连年调查数据,选取与树冠直径、胸径、优势木高有关的3个密度指标,树冠竞争因子(CCF)、林分密度指数(SDI)、优势高—营养面积比(Z),探讨这3个林分密度指标在杉木幼龄期不同良种和不同初植密度下的动态变化规律及其互作效应,并进行密度指标对初植密度和林龄的线性回归分析,根据动态变化规律和回归分析,对3个林分密度指标作出比较,筛选适宜于杉木林分密度效应描述的合理密度指标,为杉木人工林密度管理提供理论与实践依据。
HTML
-
试验地设置在福建省邵武卫闽国有林场(27°05′ N,117°43′ E),气候温暖湿润,属亚热带季风气候。地貌主要为低山高丘,海拔250~700 m,坡度25°~35°。本地区年均气温17.7 ℃,年均降水量1 768 mm,年均蒸发量1 283 mm,年均相对湿度82%左右。母岩为花岗岩,土壤类型为山地红壤。地带性植被类型为常绿阔叶林,林下植物主要有木荷(Schima superba Gardn. et Champ.)、中华杜英(Elaeocarpus chinensis (Gardn. et Chanp.) Hook. f. ex Benth.)、狗脊蕨(Woodwardia japonica (L. f.) Sm.)、芒萁(Dicranopteris dichotoma (Thunb.) Berhn.)、乌毛蕨(Blechnum orientale Linn.)、扇叶铁线蕨(Adiantum flabellulatum Linn.)等。
造林材料为福建省邵武卫闽国有林场杉木第1代和第3代种子园自由授粉种子播种苗,试验地前茬为1代杉木纯林,造林前炼山整地,试验林于2012年春采用1年生杉木裸根苗营造,造林时施基肥,每穴0.5 kg复合肥,后期未再施肥,也无间伐、修枝等干扰。试验采用不同世代良种和初植密度两因素完全随机区组设计,各区组分别位于上、中、下坡,包括2个良种水平,分别为经省级林木良种委员会审定的第1代种子园良种和第3代种子园良种,4种初植密度,分别为1 667、3 333、5 000、6 667株·hm−2(株行距分别为2.0 m × 3.0 m、2.0 m × 1.5 m、2.0 m × 1.0 m、1.0 m × 1.5 m),重复3次,共24块样地,每块样地面积为600 m2(20 m × 30 m)。样地中每木编号并挂牌标识,并在每个样地四周各设有2行同样密度的杉木保护带。
-
从2012年造林当年起,于每年年底林木停止生长后,采用测高杆、胸径尺等工具进行林分调查。2—4年生时,每年测定每木树高,并在每个样地的上、中、下各选2株优势木,6株优势木平均作为林分优势木平均高;5年生开始,每年测量每木树高、优势木高、胸径、冠幅。利用Excel软件统计每块样地林分平均冠幅、平均胸径、林分优势木平均高,进而计算各种林分密度指标值。用SPSS Statistics 25.0软件对统计数据进行方差分析、多重比较(Duncan检验),并分良种水平进行3种林分密度指标对初植密度和林龄的二元线性回归分析,用Origin 9.1软件绘图。
-
树冠竞争因子(CCF)是Krajicek等根据某一直径林木树冠投影面积与相同直径疏开木的最大树冠面积成比例的假设提出来的,其含义是林分中所有树木可能拥有的潜在最大树冠面积之和与林地面积的比值[5]。其中潜在树冠面积常用疏开木或者优势木的冠幅来代替[10],一株林木所利用的生长发育空间,可以使用与相同胸径疏开木的平均树冠投影面积代表,称作最大树冠面积
(MCA)[11]。自由树冠幅是通过与胸径的回归关系得到,很多研究表明冠幅与胸径呈线性相关[12-14],这种线性关系不随林木的年龄及立地条件的变化而改变,因此可用林木胸径推算林冠面积。 树冠竞争因子的计算方法如下:(1)将本试验中初植密度为1 667株·hm−2试验林分中的林木近似作为孤立木,并将其冠幅(CW)与胸径(D)进行线性回归,得到冠幅与胸径的线性回归方程为CW = 0.744 + 0.144 D,计算结果表明杉木冠幅与胸径之间呈线性相关,且相关极显著;(2)计算实际林分中胸径为D的单木的潜在最大树冠面积(MCAi),MCAi = π/4(CWi)2 = π/4(a+bDi)2;(3)将单位面积林分中所有单木的MCAi值累加得林分的CCF值为:
式中:CW为冠幅;D为胸径;MCA为潜在最大树冠面积;S为样地面积。
CCF是一个以直径结构、直径和冠幅相互关系为基础的相对密度指标,能较直观地反映林木树冠对空间竞争的激烈程度。CCF值越大表明林分竞争激烈程度越大。
-
林分密度指数是林分在标准平均胸径时所具有的单位面积株数[3]。1933年美国学者Reineke在对不同树种、完满立木度、未经间伐的同龄林分的调查研究中发现,单位面积株数与林分平均胸径之间呈线性关系,将每公顷林木株数作为平方平均直径的函数,并提出:logN = −β1ogDg+k,这条直线称自稀疏线或最大密度线[4],根据最大密度线公式和林分密度指数定义,导出:
式中:N为每公顷株数;Dg为平方平均直径;D0为标准平均直径,我国杉木一般取20 cm[15];β为林分的自然稀疏率。根据林分密度指数定义,计算林分总树冠投影面积,并与林地面积比较,分析得5年生时林分基本郁闭成林,利用5—8年间共72组样本点(N-Dg)数据拟合自稀疏斜率,得β = 1.588,将β、D0值代入式(2)中,得:
SDI是林分平均胸径和株数的综合指标,它既能表示林分株数的多少,又能反映林木的大小,而且测定容易,便于应用,是众多林分密度指标中评价最高、应用最多的测度指标之一[16]。
-
刘金福等[6]提出,采用相对植距的倒数,将植距改为营养面积,即林分优势木平均高和林木平均营养面积的比值,简称优势高—营养面积比(Z),作为一个新的林分密度指标。公式为:
式中:N为每公顷株数;HD为林分优势木平均高。
1.1. 试验地概况和样地设置
1.2. 林分调查及数据处理
1.3. 方法
1.3.1. 树冠竞争因子(CCF)
1.3.2. 林分密度指数(SDI)
1.3.3. 优势高—营养面积比(Z)
-
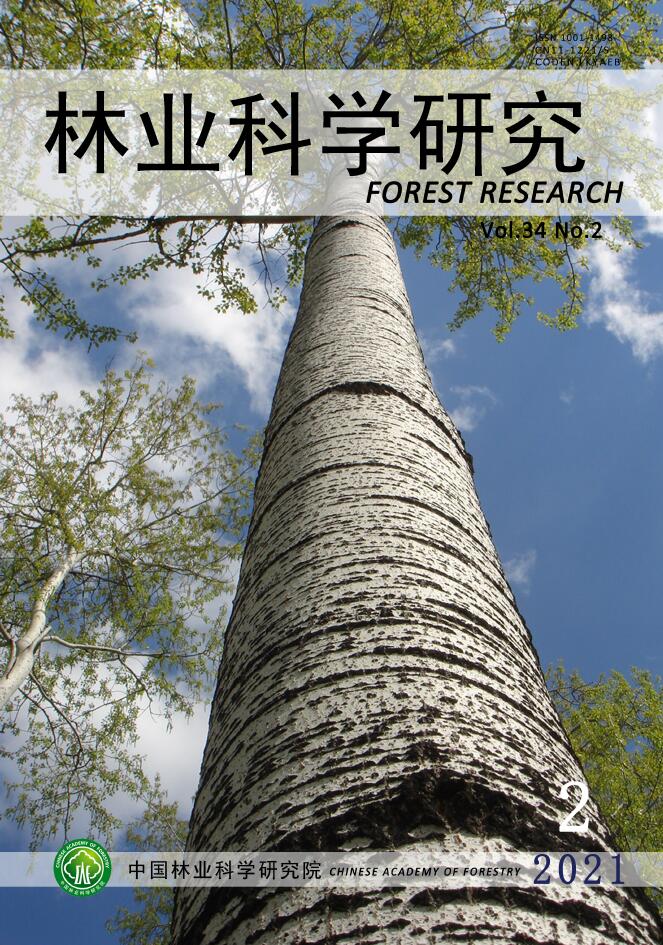
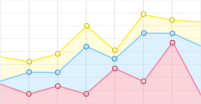
图1表示相同良种水平不同初植密度林分树冠竞争因子(CCF)、林分密度指数(SDI)、优势高—营养面积比(Z)随林龄变化的线性拟合结果。两个良种的密度变化规律一致,杉木幼龄期CCF、SDI、Z值均随林龄增长而增加,反映幼龄期各种密度林分随林龄增加林分密度越来越大,林分中林木越拥挤,这符合现实林分的生长发育规律。对于两个世代杉木良种,初植密度越小,拟合直线斜率越小,随初植密度增大,拟合直线斜率增大,表明随初植密度增大,CCF、SDI、Z值随林龄增长变化速度加快,这与幼龄期随林龄增加,林分由于自由生长初植密度越大更易或更早造成林分拥挤的事实一致。
Figure 1. Linear fitting results of three stand density measures at the same improved variety and different planting densities
同一年龄下,两个世代杉木良种的CCF、SDI、Z值均随初植密度的增大而增大。方差分析结果显示(表1),3个密度指标在各年龄下密度间差异均达极显著水平。8年生时,在林龄和良种相同的条件下,CCF和SDI的第1世代良种初植密度为5 000株·hm−2和6 667株·hm−2间差异均未达显著水平,但却显著大于初植密度为1 667株·hm−2和3 333株·hm−2,两个密度指标的第3世代良种初植密度为3 333株·hm−2和5 000株·hm−2、5 000株·hm−2和6 667株·hm−2间差异未达显著水平,但却显著大于1 667株·hm−2。对于Z值,8年生时,两个良种的Z值在4种初植密度下差异均达显著水平,表明不同密度间Z值差别比较明显。
密度指标
Stand density measures变异来源
Source of variation林龄
Stand age/ a5 6 7 8 树冠竞争因子
Crown competition factor密度
Planting density56.896** 44.211** 43.431** 44.603** 良种
Improved variety0.044 0.002 0.169 0.338 良种 × 密度
Improved variety × planting density1.182 1.069 1.019 1.202 林分密度指数
Stand density index密度
Planting density18.310** 18.922** 21.570** 24.069** 良种
Improved variety0.065 0.092 0.493 0.724 良种 × 密度
Improved variety × planting density0.913 0.870 0.866 0.986 优势高—营养面积比
Ratio of dominant height to nutrient area密度
Planting density212.559** 170.04** 151.276** 70.004** 良种
Improved variety5.706* 1.932 1.121 0.123 良种 × 密度
Improved variety × planting density2.548 1.142 1.330 0.569 注:**表示在0.01水平上差异显著。下同。
Note: ** indicates significant difference at 0.01 levels. The same below.Table 1. Results of two-way analysis of variance
-
在不同良种水平相同初植密度下的CCF、SDI、Z动态变化规律见图2。初植密度相同时,两个良种水平的林分CCF、SDI、Z值均随林龄增加而增加;低初植密度下(1667株·hm−2和3 333株·hm−2),第3世代良种的CCF、SDI、Z值大于第1世代良种;而高初植密度下(5 000株·hm−2和6 667株·hm−2),第1世代良种的CCF、SDI、Z值大于第3世代良种。在林龄和初植密度相同条件下,两个良种的CCF、SDI、Z值相差不大,受良种的影响程度小,表明3个密度指标几乎不随良种世代数变化而变化。根据双因素方差分析(表1),5—8年生时,CCF和SDI值的良种间差异均未达显著水平,Z值除在第5年生时差异达显著水平外,在6—8年生时,良种间差异未达显著水平。
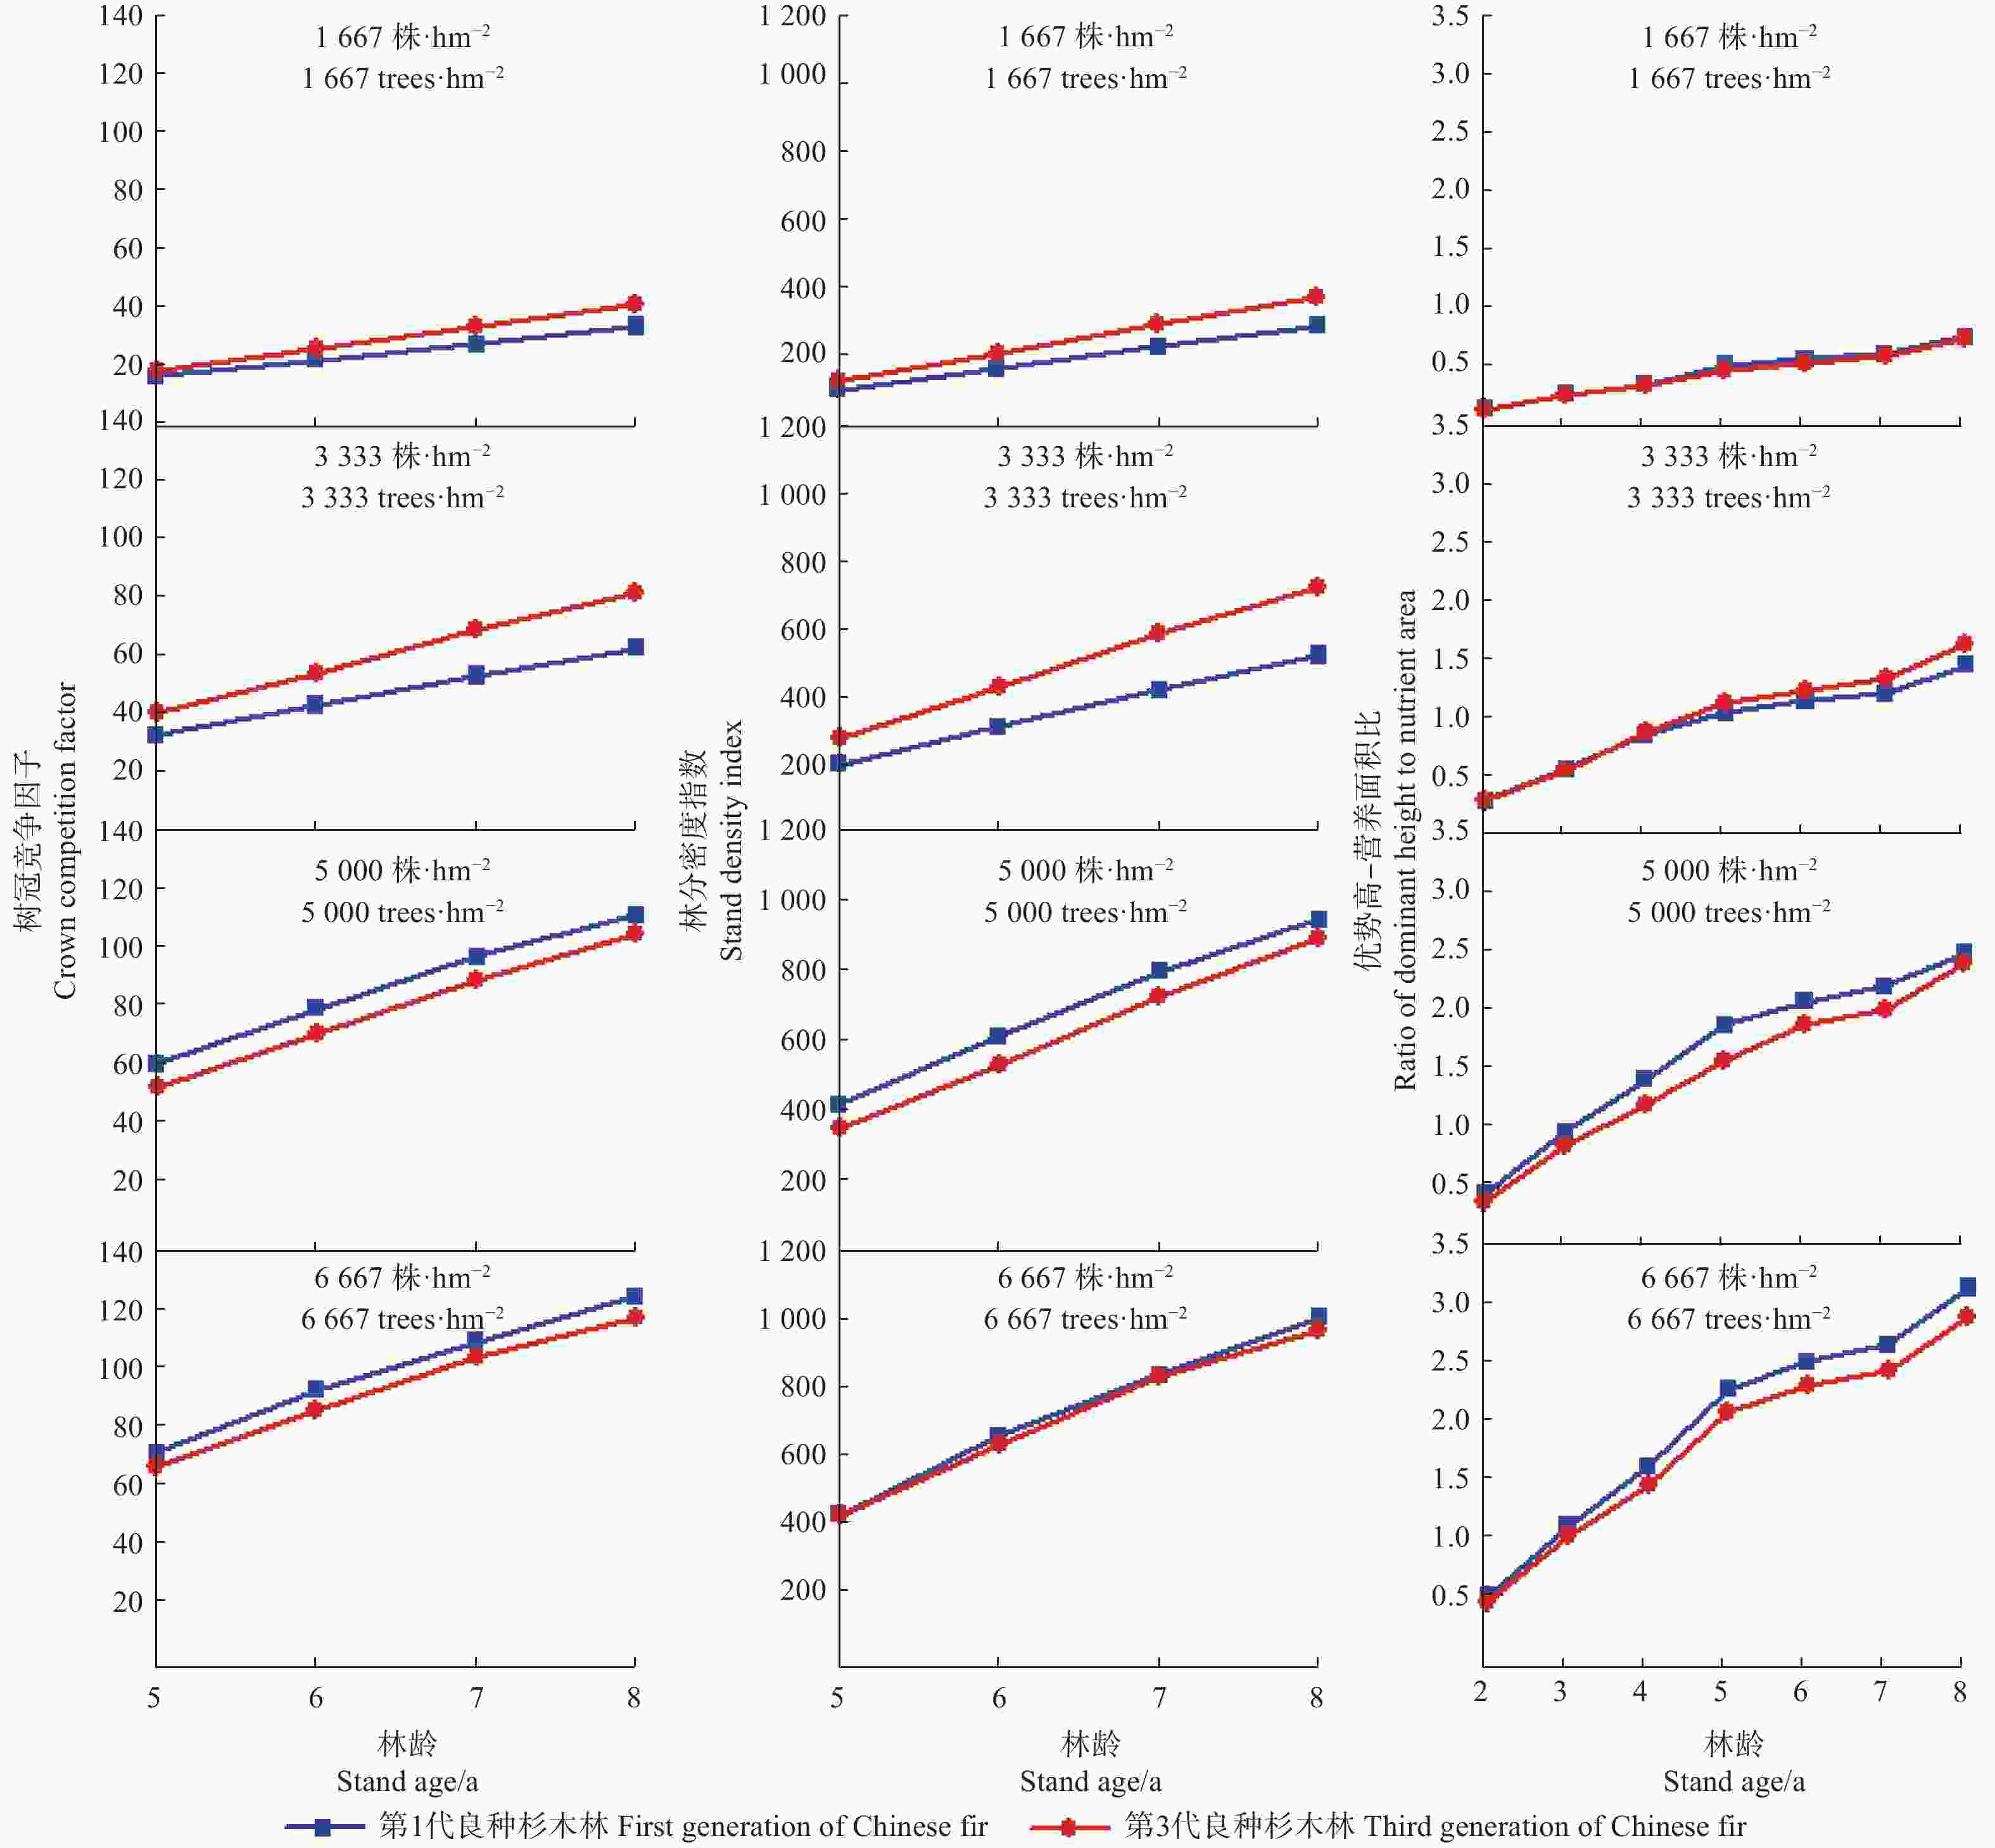
Figure 2. Dynamic changes of three stand density measures at the same planting density and different improved varieties
-
双因素方差分析结果表明(表1),CCF、SDI、Z值的良种和初植密度间交互效应均不显著,表明3个密度指标均不存在良种和初植密度的交互作用。
-
利用多元线性回归分析方法分析初植密度和林龄对密度指标的影响,相关分析表明初植密度与林龄不相关,共线性统计中方差膨胀系数(VIF)均等于1,表明不存在自变量间的共线性问题;德宾—沃森值都在2左右,表明不存在序列的自相关性;残差符合正态分布,且散点图分布规律表明不存在异方差现象。不同良种水平下杉木幼龄林CCF、SDI、Z值对初植密度和林龄的回归分析结果见表2。回归分析结果表明,两个良种水平下3种林分密度指标对初植密度和林龄的回归模型均达极显著水平,表明密度指标与初植密度和林龄之间的线性关系在总体上达极显著水平;调整后R2均在0.894以上,表明模型拟合效果较好;t检验结果显示模型回归系数均达极显著水平,表明初植密度和林龄对密度指标均产生极显著影响,且对密度指标有极显著的正向影响;初植密度的Beta值均比林龄的Beta值大,表明在当前阶段,初植密度对3种密度指标的影响程度相对林龄要大。
良种
Improved variety因变量
Dependent variable预测变量
Predictive variableB Beta F 调整后R2
Adjusted R2t p 1代
First
generation树冠竞争因子
Crown competition factor密度
Planting density0.016 0.882 109.909** 0.936 13.452 0.000 林龄
Stand age12.372 0.409 6.233 0.000 常量
Constant−81.486 −5.820 0.000 林分密度指数
Stand density index密度
Planting density0.116 0.784 63.950** 0.894 9.305 0.000 林龄
Stand age134.043 0.542 6.428 0.000 常量
Constant−861.171 −5.855 0.000 优势高—营养面积比
Ratio of dominant height
to nutrient area密度
Planting density0.001 0.959 220.192** 0.967 20.425 0.000 林龄
Stand age0.166 0.226 4.818 0.000 常量
Constant−1.201 −4.933 0.000 3代
Third
generation树冠竞争因子
Crown competition factor密度
Planting density0.013 0.819 124.216** 0.943 13.244 0.000 林龄
Stand age13.796 0.528 8.545 0.000 常量
Constant−76.289 −6.699 0.000 林分密度指数
Stand density index密度
Planting density0.090 0.686 90.655** 0.923 9.569 0.000 林龄
Stand age149.284 0.680 9.473 0.000 常量
Constant−824.296 −7.416 0.000 优势高—营养面积比
Ratio of dominant height
to nutrient area密度
Planting density0.001 0.942 235.423** 0.969 20.724 0.000 林龄
Stand age0.192 0.292 6.433 0.000 常量
Constant−1.231 −5.857 0.000 注:B为非标准化系数;Beta为标准化系数;t为t检验;p为t检验的显著性。
Note: B is the non-standardized coefficient; Beta is the standardized coefficient; t is the t-test; and p is the significance of the t-test.Table 2. Linear regression analysis between the three stand density measures and initial planting density and stand age
2.1. 密度指标随林龄、密度、良种的变化规律
2.1.1. 相同良种不同初植密度林分密度指标的动态变化
2.1.2. 相同初植密度不同良种水平林分密度指标的动态变化

2.1.3. 初植密度与良种交互效应
2.2. 密度指标与初植密度和林龄的二元线性回归分析
-
CCF、SDI、Z值在不同良种和不同初植密度下随林龄的动态变化规律显示,在相同良种水平不同初植密度下,3个密度指标随林龄增长的动态变化规律一致,均为随林龄增加而增大,这符合林分生长发育规律,即随林龄增加,密度指标值增大,表示林分中林木越拥挤[9]。3种密度指标在不同初植密度下的拟合直线斜率随初植密度增大而增大,表明高密度林分的密度指标值随林龄增长而增加的程度较低密度林分大,反映随林龄增加,初植密度越大的林分对林木间竞争激烈程度的影响更强,这与幼龄期随林龄增加,林分由于自由生长,初植密度越大更易或更早造成林分拥挤的现实一致,其中Z更能清晰地反映这种变化。
-
同一年龄下,3个林分密度指标均随初植密度的增大而增大,且方差分析结果显示密度间差异达极显著水平,回归分析结果表明初植密度对密度指标产生显著影响,且均为正向影响,反映同一年龄下初植密度越大的林分,林木间竞争程度越激烈。但是一个理想的密度指标不仅要能反映林木的拥挤程度,还要对不同密度有所区分[9]。本研究中,在初植密度为5 000~6 667株·hm−2的范围内,CCF和SDI随林龄增长,密度间差别越来越小,不同密度间差异未达到显著水平,难以对这个密度范围内的不同密度做出区分,从这个意义上说,CCF和SDI在该密度范围内难以适用,而刘金福等[6]指出SDI适用于天然林和初植密度很大的人工林,对于初植密度较稀的人工林,则适合性较差。本研究中林分5—8年生时,在初植密度为5 000~6 667株·hm−2的范围内,Z在不同密度间差异达显著水平,能明显表示出不同初植密度之间的差别,且能更清晰地反映初植密度越大,林分内林木竞争程度越剧烈。
-
前人研究表明,一个理想的密度指标要与年龄、立地及其他特征无关[9],本研究杉木良种和初植密度互作试验结果显示,在相同初植密度不同良种水平下,3种林分密度指标随良种的变化规律不明显,良种效应差异不显著,表明3种密度指标均受良种改良世代数影响较小。初植密度与良种的交互作用结果表明,3种林分密度指标的良种和密度间交互作用不显著,表明对于CCF、SDI和Z等3个密度指标,良种与初植密度交互作用的正向促进效应对林分内单木间彼此竞争激烈程度的影响未达明显作用,而由于幼龄期林分株数变量较为稳定,相应的表明这种遗传与密度的交互控制对此时林分冠幅、直径及优势高影响不显著。
-
本研究所选3个林分密度指标,树冠竞争因子、林分密度指数、优势高—营养面积比,除林木株数外,分别涉及冠幅、胸径和树高因子。有研究认为,冠幅比胸径、树高等生长指标对环境和竞争的响应要快,可以更好地指示密度变化,因此认为包含树冠因子的密度指标如树冠竞争因子CCF[12]、冠积指数[7]等更能反映林分密度状况,是评价林分竞争程度的可靠因子。CCF虽然与林分生长量显著相关[17],可用于生长和收获预估,但是树冠外形不规则,测定比较困难,且难以保证精确度,计算比较麻烦,难以区分不同林分密度。另外有研究指出与冠径关系最密切的变量是预测自疏的最佳指标[18]。很多研究证明,相比于树高、材积,直径与冠幅之间的关系更加密切,更能准确预测林分密度变化[19]。Zeide[18]认为直径和林木数量之间的关系要比树高和林木数量之间的关系更直接,树高是通过与直径的联系进而与自疏有关的。SDI综合了林木株数和平均直径这两个因子,不仅能表示林木株数的多少,还能反映树木的大小。自1933年Reineke提出林分密度指数表达式以来,SDI一直是广泛使用的评估林分密度的工具[20],在编制林分密度管理图等其它研究中得到广泛应用[21-24]。Reineke指出方程斜率为1.605,并且认为这一斜率对于所有树种、年龄和地区都是适用的。而Zeide[25]认为Reineke的模型形式和参数在生物学和统计学方面可能会引起争议,其指出参数β随年龄和树木大小的变化而变化。也有研究表明自然稀疏率随年龄和树木大小的增加而增加,并不是保持不变的。在幼龄林中直径较小时,自然稀疏率较小,而随年龄增大,直径变大,自然稀疏率逐渐增大[18]。Reineke模型参数取值除用1.605外,还有1.6[22-23]、1.913[26]等,车少辉在杉木人工林密度指标的分析研究中指出,自然稀疏斜率从1.5变为1.605过程中,SDI值几乎没有变化,说明该参数取值具有一定的弹性空间[27]。SDI的参数随林龄和林木大小的变化而变化,而参数的不稳定性会使密度估计产生偏差,本研究在计算林分密度指数时,参数取值为1.588,对于同一树种在不同地区不同年龄阶段,参数取值可能会在一定的范围内波动。另外Zeide[28]和Shaw[29]指出Reineke的相对密度指数方程中使用的平均直径不应该是Dg——既不是平方平均直径,也不是算术平均直径,Zeide将其命名为DR,其中
${D_R} = {\left(\dfrac{1}{N}{ \displaystyle \sum {{d_i}} ^\beta }\right)^{\frac{1}{\beta }}}$ ,代入Reineke的模型表达式中得$SD{I^*} = \displaystyle \sum \left({\dfrac{{{d_i}}}{{D{}_0}}} \right ){^\beta }$ 。从以上的各种研究中发现,由于Reineke的模型形式和参数在使用时争议较大,所以在实际应用时有必要做进一步研究。Z表达式中含有优势高,有研究表明关于林分优势高的测定标准并不统一,通常认为同龄林林分优势高生长受林分密度的影响很小,调查时一般基于单位面积内一定数量的最粗或最高的树木树高的平均值来表示[30]。刘金福等[6]提出优势高—营养面积比(Z),指出Z与年龄及地位指数的相关性皆不显著,与林分断面积相关性达显著水平,表明与年龄及地位指数无关,而与林分断面积关系紧密,认为Z作为林分密度指标是比较理想的。张连金等[9]亦认为密度指标Z优于SDI,而且得出该指标适用年龄范围广,在整个林分发育过程中变化较小,是一种比较适用的密度指标,与本研究初植密度效应结果一致,但本试验发现不同世代良种对5年生林分密度指标Z具有显著影响,且林分8年生时Z较CCF和SDI更能反映不同初植密度两两间对林分竞争态势的差异性作用,因此,对杉木人工林而言,密度指标Z具有更好的指示性。
3.1. 密度指标的动态变化
3.1.1. 林龄
3.1.2. 初植密度
3.1.3. 良种及其与初植密度交互效应
3.2. 密度指标的比较分析


-
本研究通过树冠竞争因子(CCF)、林分密度指数(SDI)、优势高—营养面积比(Z)在不同初植密度和良种水平下的动态变化规律及密度指标对初植密度和林龄的回归分析,得出如下3点结论:(1)3个密度指标随林龄增长的动态变化规律一致,均为随林龄增加而增大,密度指标随林龄增长的变化速率随初植密度的增大而增大;(2)密度指标在不同密度间差异达极显著水平,3个密度指标均能反映初植密度越大,林分内林木越拥挤,在5 000~6 667株·hm−2的范围内,CCF和SDI在不同密度间差异不显著,难以区分不同密度之间的差别,而Z在研究设置的整个密度范围内不同密度间差异均达显著水平,更能清晰地反映初植密度越大,林分内林木竞争程度越剧烈;(3)密度指标随良种的变化规律不明显,良种效应差异不显著,且良种和密度的交互控制对幼龄期杉木林分冠幅、胸径、优势高影响不显著。综上所述,密度指标Z优于CCF和SDI,Z能够明显地表示出不同密度之间的差别,更加清晰地反映林木间竞争水平,而且该指标是一个无参数的密度指标,相较其他密度指标容易测定,更适用于杉木人工林分生长模拟和密度管理。
 DownLoad: