

-
枝条的数量、基径、长度等在一定程度上决定着木材的质量和等级[1]。因此,研究枝条的发育规律对于提升木材质量具有重要作用,也已逐渐成为研究的热点[2-3]。大量研究结果表明,枝条的分布和生长规律与林分密度调控技术密切相关。欧阳红旗等[4]的研究结果表明,密度对猕猴桃枝条产量、基部直径具有显著影响,但对枝条长度的影响不明显;王志海等[5]研究表明,密度对米老排枝条的大小影响显著,高密度会显著抑制枝条的生长;章志都等[6]对林分密度对山桃树冠影响的研究结果表明,林分密度对1级侧枝的树冠形态参数影响显著。类似研究还有很多,也均表明林分的密度与枝条的生长密切相关[7-8]。
杉木 (Cunninghamia lanceolata (Lamb.) Hook.) 是我国南方特有的优良速生树种,具有速生丰产、材干通直、适应性强、经济效益高等优点[9-10]。抚育间伐是杉木人工林培育的主要营林措施之一,通过降低林分密度,改善林分内的光照、温度、湿度、土壤等环境条件,从而促进林分保留木的生长[11]。抚育间伐对杉木生长的影响已开展了大量的研究[12-13],而对于抚育间伐对枝条发育的影响研究较少。本研究以福建省沙县官庄国有林场的9年生杉木间伐密度试验林为研究对象,探究了不同间伐后的林分保留密度对杉木人工林枝条发育的影响,以期为提高杉木人工林无节材培育提供参考。
-
试验林设置在福建省沙县官庄国有林场,林场为闽西北低山丘陵地带,海拔高平均在200~800 m左右;气候温和,土层深厚,土壤肥沃,土壤以红壤为主且腐殖质含量较多,并分布有黄红壤;林下植被以冬青(Ilex chinensis Sims)、粗叶榕(Ficus hirta Vahl)、傅氏凤尾蕨(Pteris fauriei Hieron)等为主。
-
该试验林分于2009年完成造林,造林密度均为3 250株·hm−2,面积均为20 m × 20 m。为保证试验的准确性,试验林分的坡位、坡度、土壤条件相对一致,采用完全随机区组设计,设置间伐后高林分保留密度(H:2 250株·hm−2)、中林分保留密度(M:1 800株·hm−2)、低林分保留密度(L:1 200株·hm−2)3种处理,每个处理3个重复。试验林地立地指数均为18 m,并于2017年 (林龄为9 a)完成间伐处理。
-
2023年对杉木人工林进行每木检尺,各间伐后的林分保留密度杉木人工林特征如表1。
表 1 14年生杉木间伐后的林分保留密度试验林的基本特征
Table 1. Basic characteristics of 14-year-old Chinese fir stand after thinning
间伐后的林分保留密度/(株·hm−2)
Stand retention density after thinning平均胸径/cm
Average DBH平均树高/m
Average tree HH ( 2 250) 17.35 ± 0.22 c 13.54 ± 0.08 a M ( 1 800) 18.23 ± 0.2 b 13.42 ± 0.07 a L ( 1 200) 19.57 ± 0.29 a 13.63 ± 0.08 a -
根据试验林林分的胸径和树高,在每个样地选取1株远离林缘的标准木。按照2 m区分段,记录一级枝条的状态。死枝测量时,在标准木树下铺设篷布,使用测高杆测量着生高度,使用修枝剪从基部剪下死枝,测量基径、枝长、目测方位角。标记北线将标准木伐倒,测量活枝的着生高度、基径、枝长、分枝角、方位角。枝条基径用游标卡尺测量,枝长用卷尺测量,分枝角用角度尺测量,方位角分为8个区域,以正北为0度,正东为90度,间隔45°为1个区域,目测枝条的方位区间。
-
从9株样木采集的数据,利用Excel进行数据的初步处理,采用SPSS统计软件对相关数据进行统计。
-
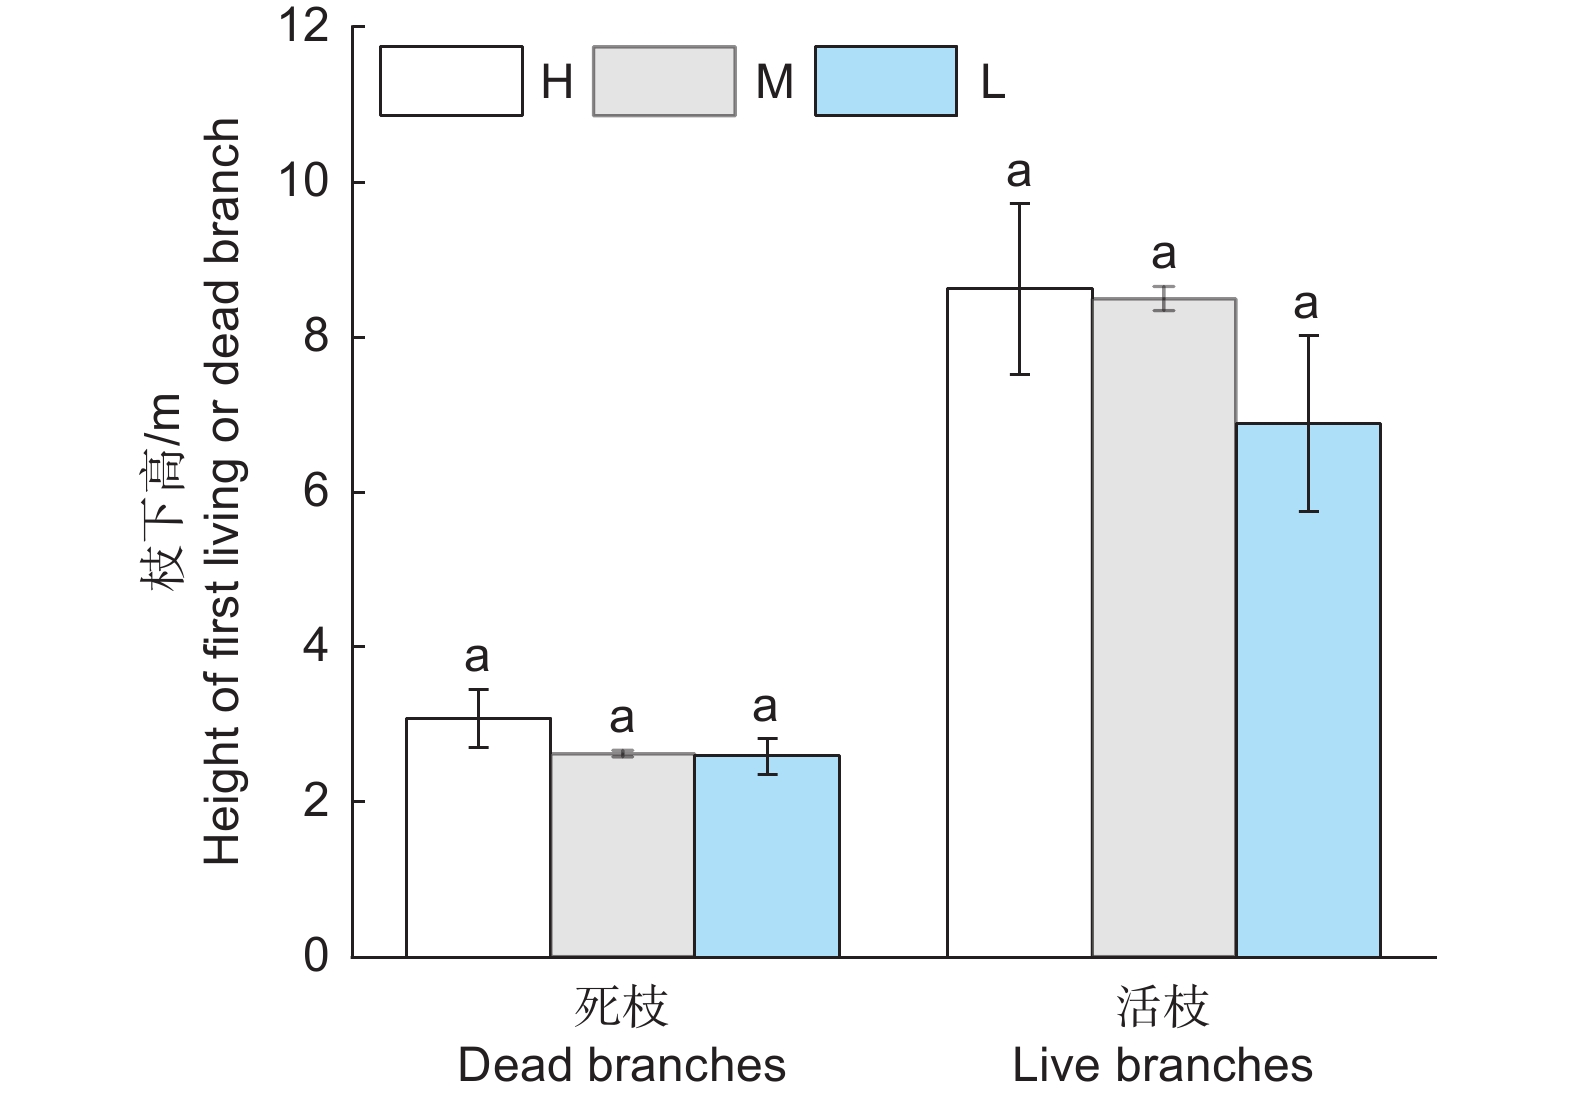
由图1可知,死枝枝下高均在2~4 m范围内,活枝枝下高均在6~9 m范围内。枝下高随间伐后的林分保留密度的增大而增大,各处理间杉木死枝、活枝枝下高均表现为H>M>L,经方差分析结果表明,各间伐后的林分保留密度处理间差异均不显著(P>0.05),说明间伐后低的林分保留密度会降低死枝和活枝的枝下高。
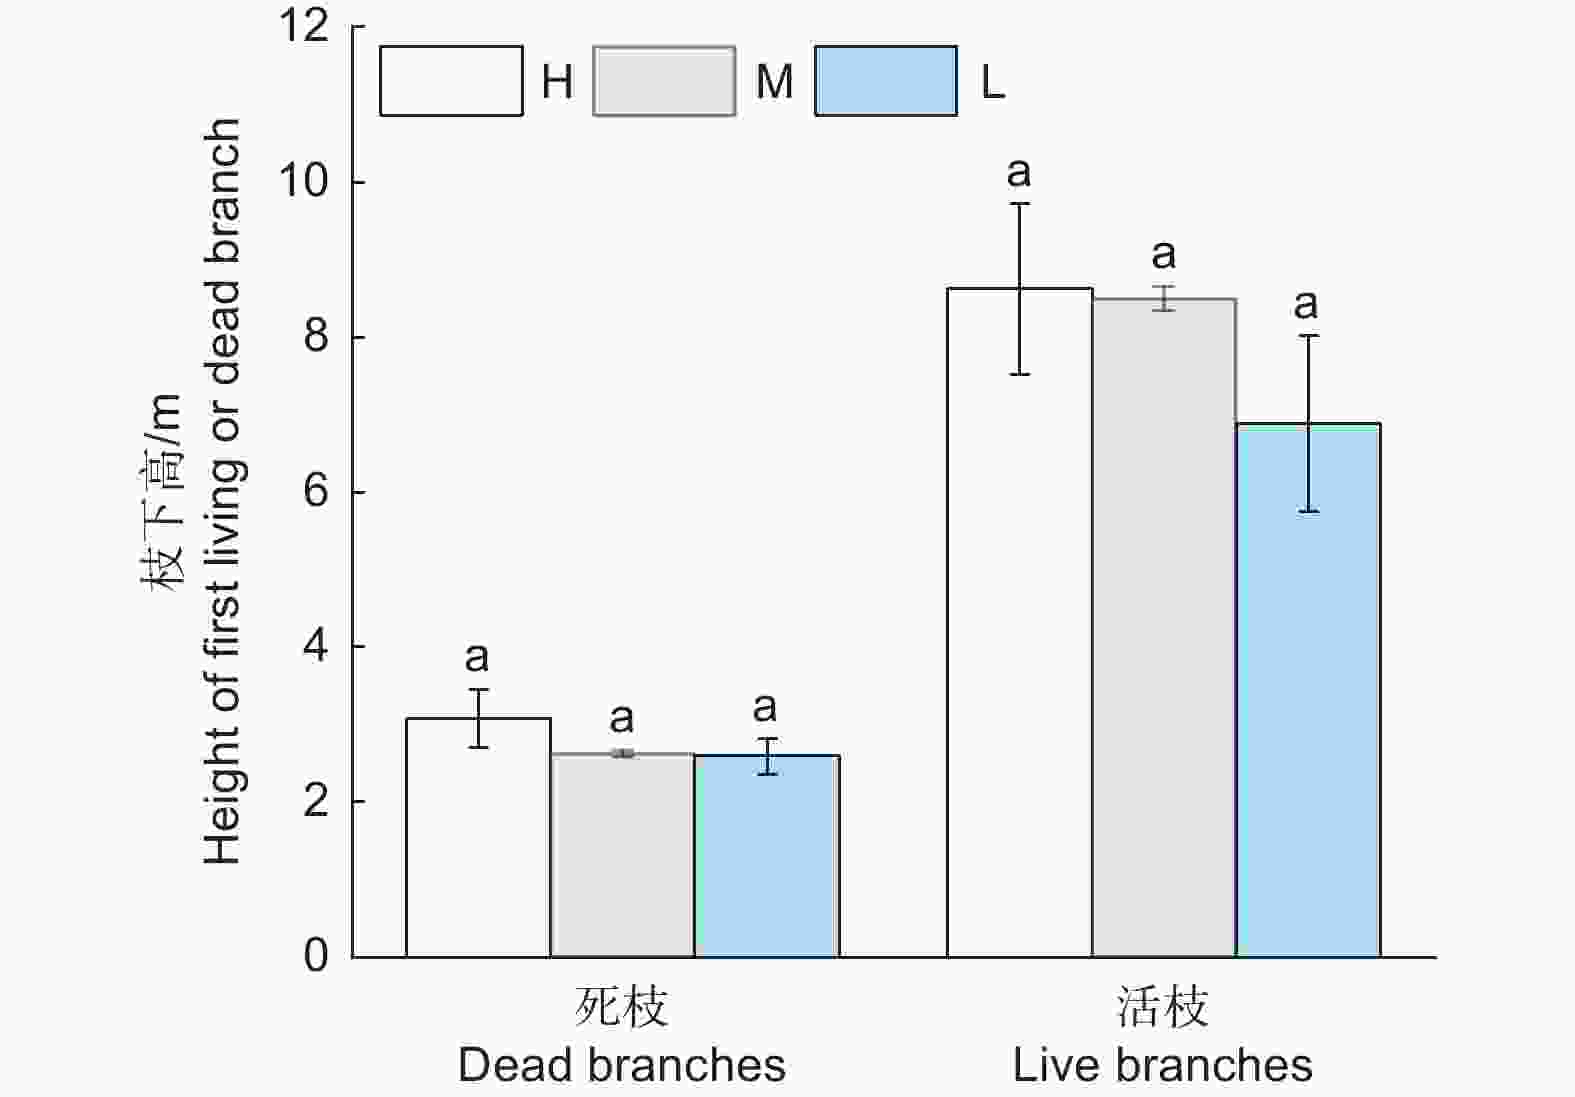
图 1 不同间伐后的林分保留密度对枝下高的影响
Figure 1. Effects of different stand retention densities after thinning on the height under branches
-
由表2可知,间伐后的林分保留密度对杉木枝条总量、死枝、活枝、树干垂直高度8 m以下,树干垂直高度8 m以上枝条数量的影响表现为随林分保留密度的减小而增大,均为L>M>H,且经方差分析结果表明活枝、总枝条、树干垂直高度8 m下枝条数量L显著高于M、H(P<0.05)。间伐后的林分保留密度对枯枝率的影响表现为随间伐后的林分保留密度的减小而减小,表现为H>M>L,但并未表现出显著性差异(P>0.05)。表明低的林分保留密度会显著促进活枝、总枝条和8 m下枝条的数量,同时降低林木枯枝率。
表 2 不同间伐后的林分保留密度对枝条数量的影响
Table 2. Effect of different stand retention density after thinning on the number of branches
处理
Processing枝条数量 Branch number/个 枯枝率/%
Dead branch rate死枝
Dead活枝
Live总量
Total8 m以下
Below 8 meters8 m以上
More than 8 metersH 52.67 ± 3.28 a 60 ± 3.79 b 112.67 ± 5.33 b 52.67 ± 3.28 b 65.67 ± 3.48 a 46.76 ± 1.96 a M 54 ± 3.61 a 62.33 ± 3.38 b 116.33 ± 5.93 b 54 ± 3.61 b 67 ± 3.79 a 46.38 ± 1.6 a L 60.33 ± 2.19 a 83 ± 4.36 a 143.33 ± 4.91 a 67 ± 4.16 a 76.33 ± 2.19 a 42.15 ± 1.59 a 注:同列不同小写字母表示差异显著(P<0.05)。
Note: different lowercase letters in the same column indicate significant difference (p < 0.05) . -
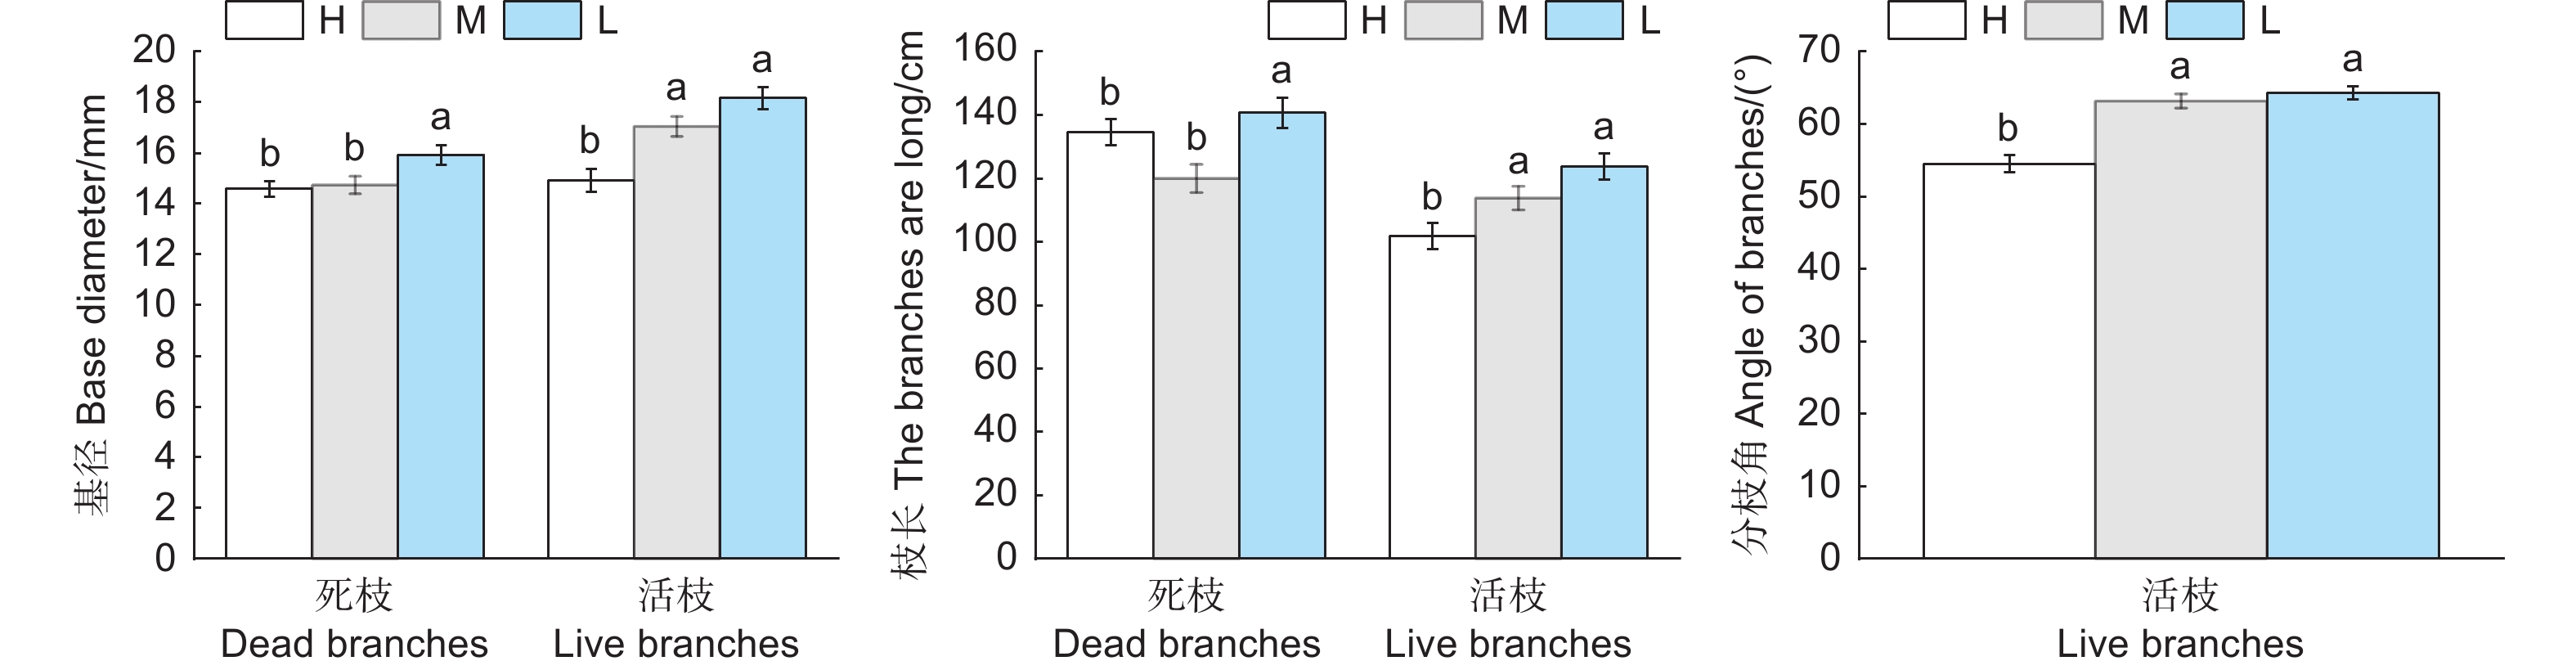
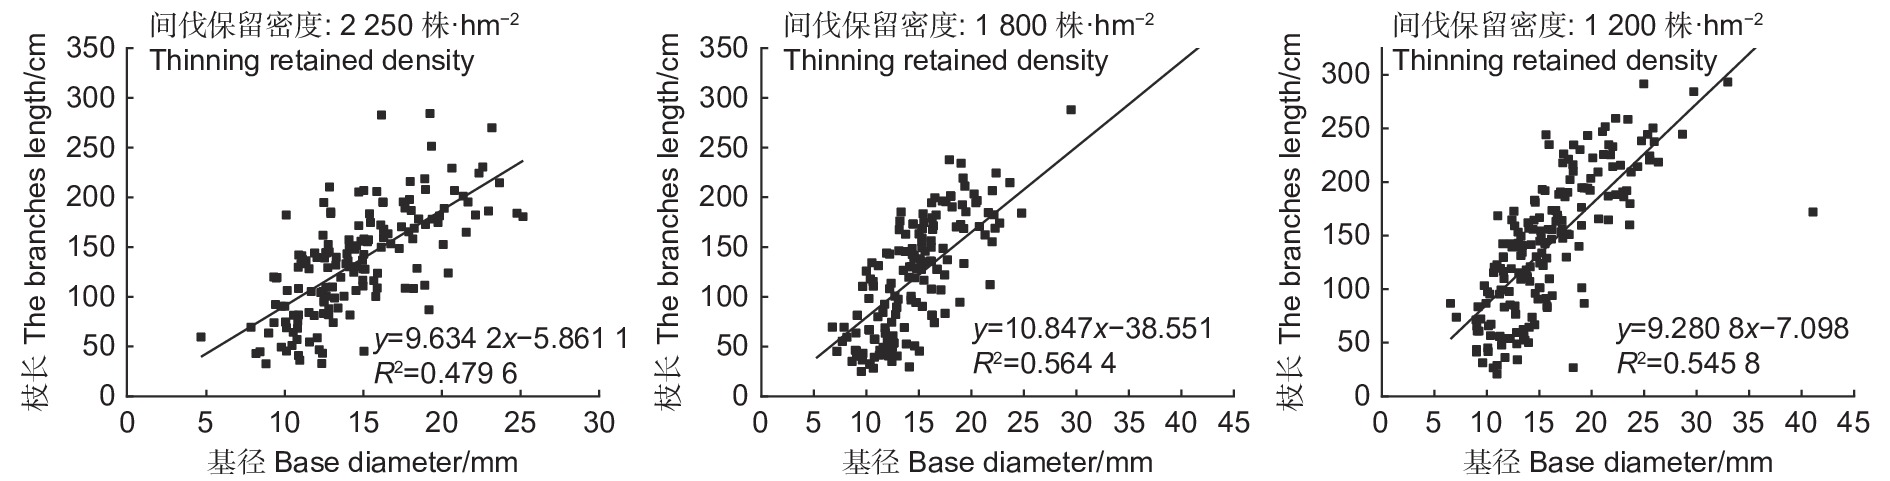
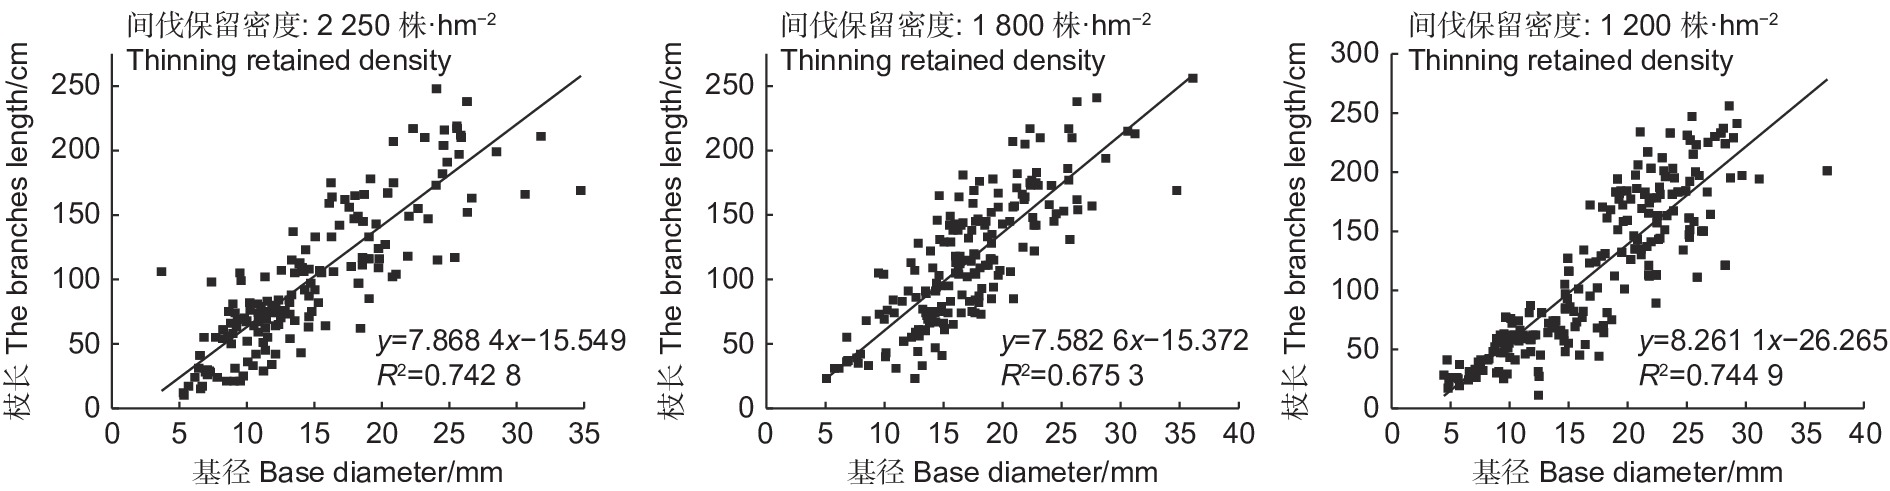
由图2可知,枝条基径随间伐后的林分保留密度的减小呈现出逐渐增大的趋势,表现为L>M>H,且L显著大于H(P<0.05),死枝枝长与间伐后的林分保留密度间的关系表现为L>H>M,未表现出规律性影响,活枝枝长与间伐后的林分保留密度间的关系表现为随间伐后的林分保留密度的降低而增大,表现为L>M>H,且活枝与死枝的枝长均表现为L的枝长显著大于H(P<0.05),分枝角表现为L>M>H。方差分析结果显示:死枝基径和枝长的线性关系(图3)弱于活枝,活枝枝条基径(x)和枝长(y)呈明显的线性相关(图4),可用y=a + bx表示。低间伐后的林分保留密度可显著促进基径和枝长的生长。
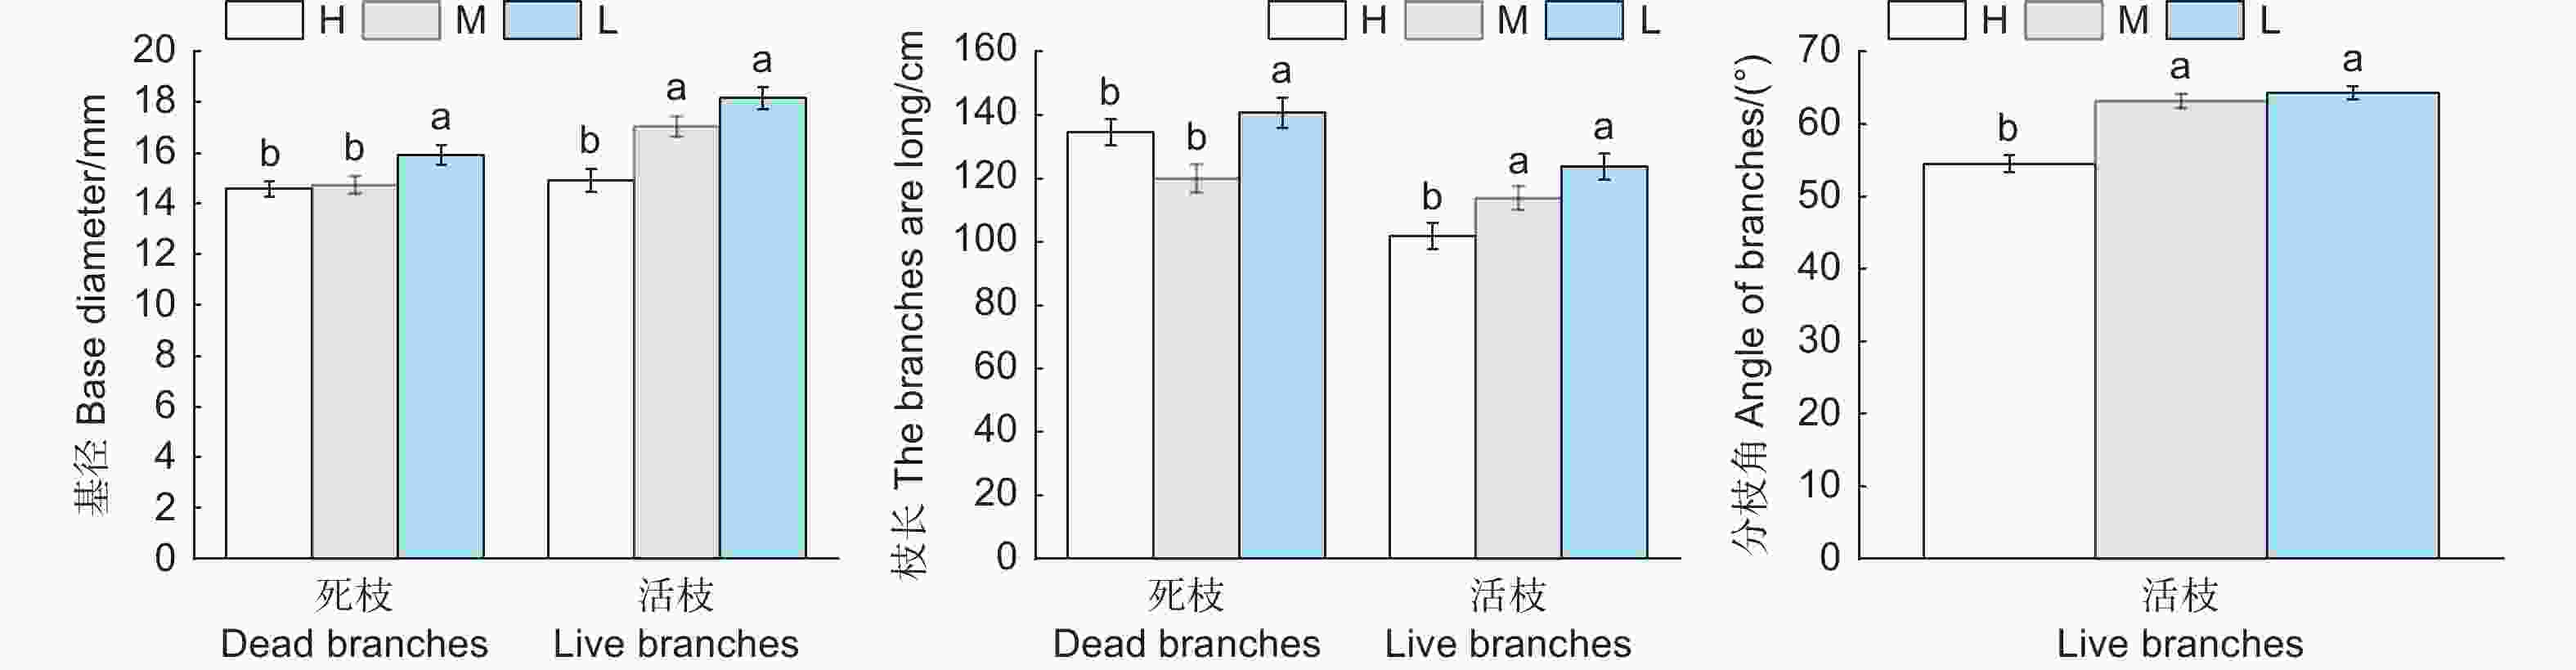
图 2 不同间伐后的林分保留密度对基径、枝长和分枝角的影响
Figure 2. Effect of different stand retention density after thinning on basal diameter, branch length and branch angle
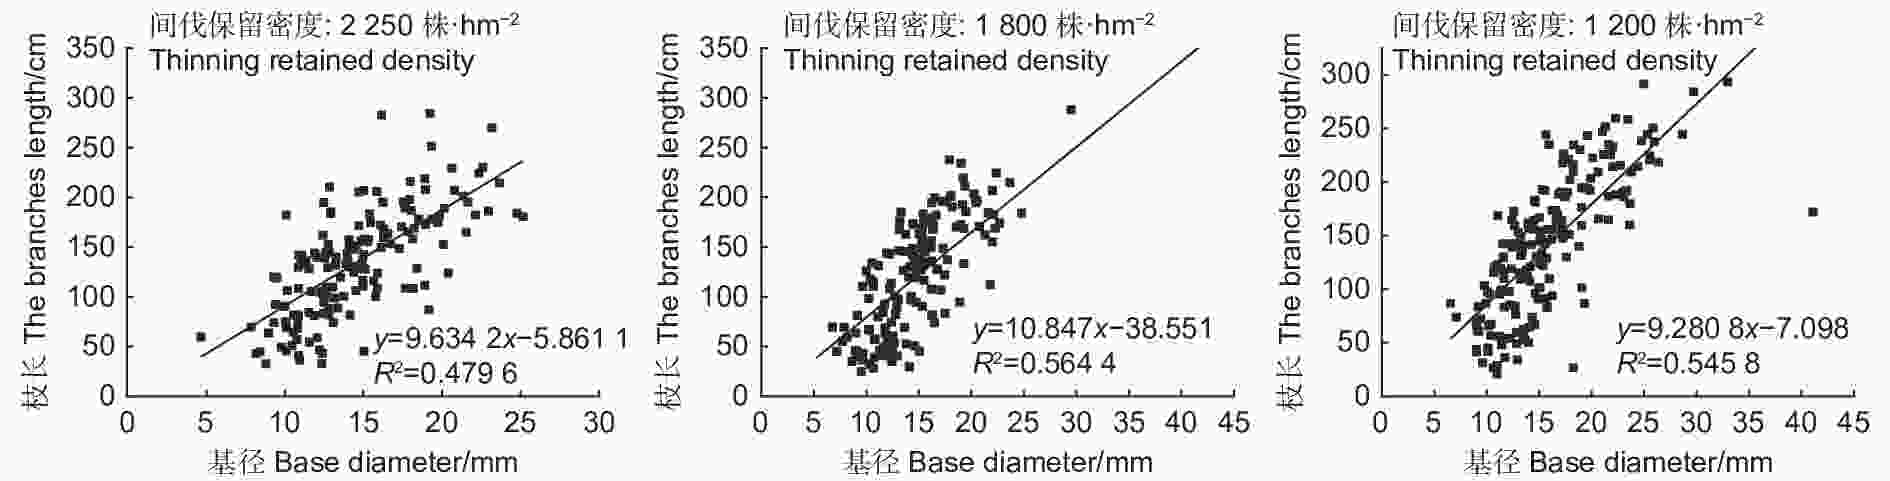
图 3 不同间伐后的林分保留密度下死枝的基径和枝长的回归分析
Figure 3. Regression analysis of basal diameter and length of dead branches under different stand retention densities after thinning
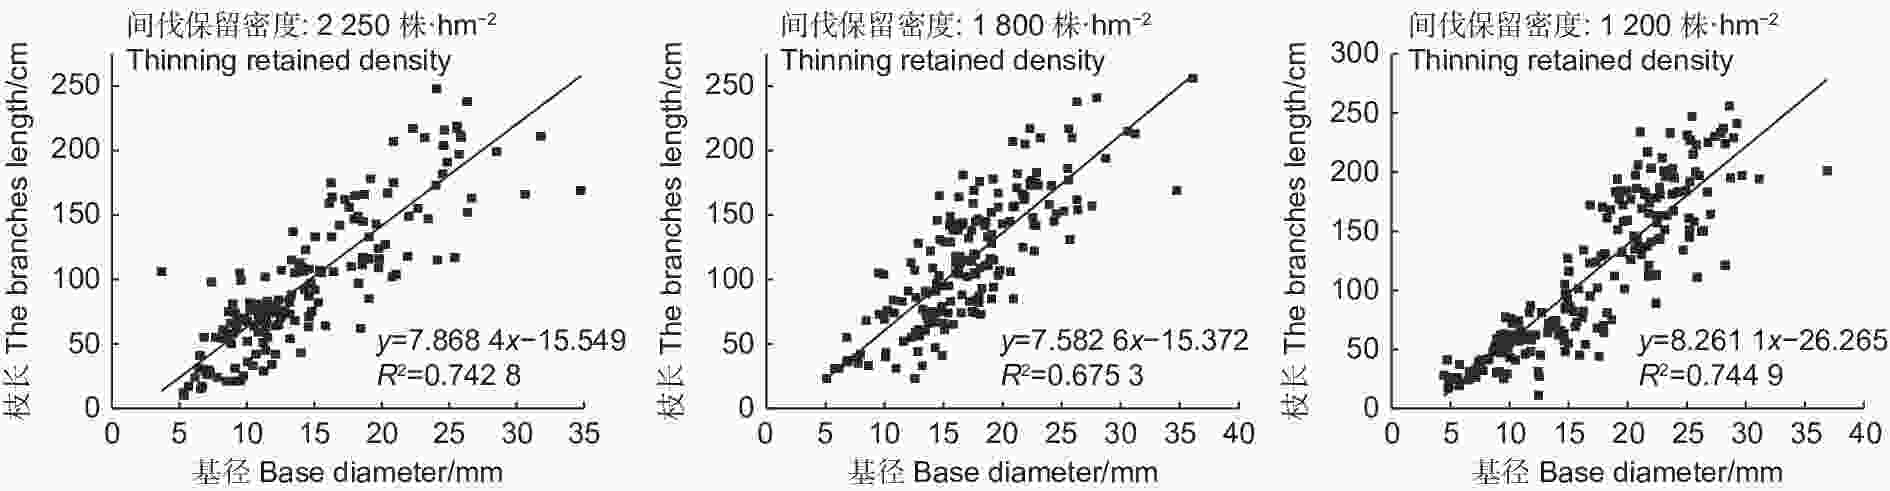
图 4 不同间伐后的林分保留密度下活枝的基径和枝长的回归分析
Figure 4. Regression analysis of basal diameter and length of living branches under different stand retention densities after thinning
-
由表3可知,各间伐后的林分保留密度的林木的死枝枝条均出现在树干垂直高度2 m以上。在树干垂直高度8 m下,死枝枝条的基径和枝长随着高度的上升而增大。均表现为6 m以上的枝长与基径显著高于6 m以下,数量也在6~8 m时达到最大值,8 m之后死枝枝条的数量显著下降,L在8 m以上未出现死枝。由表4可知,间伐后的不同林分保留密度中,H、M的活枝均出现在8 m以上,L的活枝出现在6 m以上,表明间伐后低的林分保留密度能降低林木的枝下高。3种间伐后的林分保留密度活枝的基径、枝长与分枝角随高度的增加而减小,H、M处理中活枝的数量表现为随高度的增加而增加,并表现出显著差异(P<0.05),L处理中活枝数量在10~12 m区间出现不显著降低。
表 3 不同间伐后的林分保留密度杉木枝条死枝垂直分布
Table 3. The vertical distribution of dead branches of Chinese fir with different stand retained density after thinning
分枝特征
Branching characteristics处理
Processing高度区间 Height interval/m 2~4 4~6 6~8 8~10 基径/mm
Base diameterH 14.09 ± 0.73 ab 13.36 ± 0.51 b 15.54 ± 0.51 a 14.78 ± 0.6 ab M 13.7 ± 0.5 b 13.26 ± 0.39 b 15.89 ± 0.55 a 17.49 ± 1.56 a L 12.99 ± 0.46 b 16.97 ± 0.59 a 17.55 ± 0.76 a - 枝长/cm
The branches lengthH 109.89 ± 9.52 b 128.73 ± 9.86 ab 146.91 ± 5.87 a 141.67 ± 5.38 a M 100.12 ± 8.07 c 103.35 ± 7.6 c 138.22 ± 6.54 b 171.2 ± 15.76 a L 100.43 ± 8.29 b 159.57 ± 6.71 a 156.41 ± 7.91 a - 枝条数量/个
Branch numbersH 9.33 ± 0.33 c 15 ± 1.53 b 22.67 ± 2.19 a 5.67 ± 0.33 c M 14 ± 1 a 17.33 ± 1.2 a 18 ± 1.53 a 4.67 ± 0.88 b L 18 ± 1.15 b 25 ± 1.53 a 17.33 ± 0.67 b - 注:同行不同小写字母表示显著差异(P<0.05),下同。
Note: Different lowercase letters in the same line showed significant difference (p < 0.05) ,The same below.表 4 不同间伐后的林分保留密度杉木枝条活枝垂直分布
Table 4. The vertical distribution of living branches of Chinese fir with different stand retention densities after thinning
分枝特征
Branching characteristics处理
Processing高度区间 Height interval/m 6~8 8~10 10~12 12~14 基径/mm
Base diameterH — 23 ± 0.77 a 16.54 ± 0.61 b 10.45 ± 0.34 c M — 21.02 ± 0.99 a 18.53 ± 0.65 b 14.46 ± 0.44 c L 24.92 ± 0.72 a 22.1 ± 0.43 b 20.8 ± 0.72 b 11.77 ± 0.47 c 枝长/cm
The branches lengthH — 188.76 ± 5.89 a 114.14 ± 3.85 b 57.71 ± 2.89 c M — 174.61 ± 6.38 a 132.41 ± 4.42 b 76.97 ± 3.51 c L 215.5 ± 4.79 a 181.72 ± 4.18 b 125.66 ± 4.4 c 58.33 ± 3 d 分枝角/(°)
Angle of branchesH — 61.18 ± 1.32 a 52.21 ± 2.15 b 53.62 ± 1.78 b M — 69.82 ± 1.76 a 63.49 ± 1.69 b 60.56 ± 1.44 b L 67.65 ± 1.39 ab 63.35 ± 0.93 bc 70.61 ± 1.78 a 59.67 ± 1.86 c 枝条数量/个
Branch numbersH — 11 ± 0.58 c 21.33 ± 2.19 b 27.67 ± 2.33 a M — 10.33 ± 0.88 c 23 ± 1.73 b 29 ± 2 a L 6.67 ± 2.73 c 23.33 ± 1.2 b 22.33 ± 2.03 b 30.67 ± 1.86 a -
由表5可知,通过分析不同间伐保留密度的不同方位的枝条基径、长度、分枝角和枝条数量的分布规律得知:H、M处理中死枝枝条基径与枝条长度在90°~225°的南部区域达到最大值,最大基径分别为17.7 mm、16 mm,最大枝长分别为177.9 cm、144.96 cm,L的死枝基径与枝条长度未表现出规律性差异,分布较为均匀,最大基径为16.54 mm,最大枝长为155.24 cm。H、M、L的死枝数量最大值出现在0°~180°的东部区域,H为11.67个,M为11个,L为11.33个。由表6可知,H、M、L处理中活枝枝条基径、长度与分枝角的最大值均出现在90°~225°的南部区域。H、M、L的基径最大值分别为16.95 mm、19.96 mm、20.5 mm,枝长最大值分别为116.32 cm、134.21 cm、143.25 cm,分枝角的最大值分别为59.82°、68.71°、67.56°。H、M、L活枝数量最大值分别为10.33个、10.67个、11.67个。
表 5 不同间伐后的林分保留密度杉木枝条死枝水平分布
Table 5. The distribution of dead branches of Chinese fir with different thinning densities
分枝特征
Branching
characteristics处理
Processing方位区间 Azimuth range/(°) 0~45 46~90 91~135 136~180 181~225 226~270 271-315 316-360 基径/mm
Base diameterH 13.72 ±
0.49 b13.65 ±
0.78 b17.7 ±
1.41 a16.96 ±
0.97 a15.16 ±
0.73 ab13.61 ±
0.82 b12.62 ±
0.46 b13.56 ±
1.11 bM 13.16 ±
0.77 ab14.85 ±
0.78 ab16 ±
0.71 a15.22 ±
0.58 ab15.97 ±
1.03 a15.23 ±
1.35 ab13.52 ±
1.11 ab12.75 ±
0.9 bL 16.49 ±
1.01 a16.11 ±
1.06 a16.53 ±
1.08 a15.75 ±
0.93 a16.46 ±
0.84 a16.54 ±
1.19 a13.05 ±
0.79 a15.31 ±
1.33 a枝长/cm
The branches lengthH 109.1 ±
7.97 bc124.67 ±
11.12 bc168.6 ±
10.03 a177.9 ±
13.15 a148.01 ±
8.11 ab130.07 ±
9.96 bc98.52 ±
11.41 c127.9 ±
17.09 bM 102.94 ±
10.9 a114.16 ±
10.77 a144.96 ±
9.82 a129.41 ±
8.64 a143.12 ±
14.99 a111.57 ±
19.87 a103.03 ±
16.98 a102.66 ±
14.67 aL 149.21 ±
16.13 a146.6 ±
13.35 a139.01 ±
10.8 ab145.63 ±
14.1 a140.43 ±
13.55 ab155.24 ±
13.03 a100.89 ±
11.55 b138.81 ±
14.6 ab枝条数量/个
Branch
numbersH 11.67 ±
1.2 a7.33 ±
0.33 b3.33 ±
0.88 c7.67 ±
1.2 b9.33 ±
0.67 ab7 ±
1.15 b4.33 ±
0.33 c2 ±
0.58 cM 9 ±
1.53 ab11 ±
1.53 a6.67 ±
0.33 ab10.33 ±
2.6 a5.67 ±
0.88 bc2 ±
0.58 c4.67 ±
0.67 bc4.67 ±
1.2 bcL 6 ±
0.58 bc7.33 ±
0.88 bc11.33 ±
1.33 a8.67 ±
0.88 ab7.67 ±
1.45 bc6.33 ±
0.88 bc5 ±
0.58 c6.33 ±
1.33 bc表 6 不同间伐后的林分保留密度杉木枝条活枝水平分布
Table 6. The horizontal distribution of the living branches of Chinese fir with different stand retained density after thinning
分枝特征
Branching
characteristics处理
Processing方位区间 Azimuth range/(°) 0~45 46~90 91~135 136~180 181~225 226~270 271-315 316-360 基径/mm
Base diameterH 13.25 ±
1.55 ab12.23 ±
1.42 b13.48 ±
1.68 ab16.95 ±
1.16 a15.91 ±
1.33 ab16.43 ±
1.19 ab15.05 ±
0.94 ab13.16 ±
1.2 abM 16.32 ±
0.94 ab16.81 ±
1.38 ab19.96 ±
2.65 a18.38 ±
1.23 ab17.4 ±
0.76 ab16.12 ±
1.34 b17.16 ±
0.8 ab15.93 ±
0.62 bL 18.5 ±
1.23 ab18.84 ±
1.53 ab16.73 ±
1.4 ab20.5 ±
1.02 a17.69 ±
1.22 ab15.92 ±
1.12 b16.65 ±
1.03 ab19.48 ±
1.14 ab枝长/cm
The branches lengthH 83.39 ±
12.12 b78.5 ±
12.26 b79.76 ±
8.35 b111.48 ±
11.05 ab116.32 ±
13.34 ab122.06 ±
12.52 a103.19 ±
10.04 ab90.14 ±
8.46 abM 105.57 ±
9.64 a119.75 ±
10.81 a134.21 ±
18.87 a113.9 ±
10.91 a110.68 ±
9.17 a109.19 ±
12.31 a116.04 ±
9.18 a111.25 ±
7.76 aL 114.83 ±
11.07 abc137.35 ±
13.67 ab99.45 ±
14.74 c143.25 ±
10.64 a119.21 ±
10.68 abc104.59 ±
10.62 bc119.87 ±
10.66 abc141.81 ±
11.43 a分枝角/(°)
Angle of branchesH 49.41 ±
4.18 ab53 ±
4.15 ab56.52 ±
2.61 ab59.82 ±
3.61 a57.44 ±
2.89 ab57.11 ±
2.68 ab52.2 ±
2.57 ab47.26 ±
3.43 bM 64.79 ±
2.32 a66.25 ±
3.46 a68.71 ±
3.82 a61.67 ±
3.49 a64.29 ±
2.53 a60.06 ±
2.96 a59.4 ±
1.99 a63.2 ±
2.26 aL 65.82 ±
3.54 ab58.72 ±
2.01 b61.4 ±
2.74 ab66.14 ±
2.11 ab67.56 ±
1.96 a64.12 ±
2.67 ab60.79 ±
2.81 ab66.37 ±
2.38 ab枝条数量/个
Branch numbersH 6 ±
0.58 cde5 ±
0.58 e5.67 ±
0.88 de9 ±
1.53 ab8.33 ±
0.88 abcd10.33 ±
0.33 a8.67 ±
1.2 abc7.33 ±
0.33 bcdeM 7 ±
0.58 bc6.67 ±
0.67 bc4.67 ±
0.33 c6.67 ±
0.33 bc9.67 ±
0.88 a8.67 ±
0.88 ab8.33 ±
1.33 ab10.67 ±
0.88 aL 11.67 ±
0.88 ab8.67 ±
0.67 cd6.67 ±
0.33 d12.33 ±
0.88 ab13.33 ±
1.2 a9.67 ±
0.88 bc10.33 ±
0.88 bc10.67 ±
0.88 abc -
(1)研究结果显示,不同间伐后的林分保留密度对枯枝高影响不显著,对活枝高的影响表现为随间伐后的林分保留密度的减小而减小。与杨桂娟等[14]对杉木的研究结果一致。杉木树冠下部枝条死亡并宿存树干上,并不脱落,因此,杉木的自然整枝能力并不由单一的枝下高决定。间伐后的林分保留密度对死枝数量的影响表现为随间伐后的林分保留密度的减小而增大,但并未表现出显著性差异,低间伐后的林分保留密度会显著增加活枝与总枝条数量,在一定程度上表明杉木枝条发育数量会随生活空间的扩大而增大,与刘新亮等[15]对樟树幼龄林的研究结果一致。
(2)研究结果显示,杉木死枝枝条的基径与长度表现为随间伐后的林分保留密度的减小而增大,与吴鞠等[16]的研究结果一致。活枝的枝长、基径和分枝角表现为低的林分保留密度大于中、高保留密度,与唐继新等[17]对米老排的研究结果一致,随着间伐后的林分保留密度的减小,枝条生长空间变大,水平竞争力减小,对阳光、水分吸收增大,枝条与树干之间的夹角变大有利于枝条的生长。
(3)研究结果显示,从垂直分布可知死枝的基径、枝长与数量总体呈现出随高度区间的增大而增大。活枝的数量基本呈现出随高度区间的增大而增大,基径、枝长、分枝角与高度区间呈反比,这与何韦均[18]对米老排的研究结果一致。随着林龄的增长,胸径与树高增大,对应的活枝枝条基径、长度逐渐增大,随着竞争的结果出现死亡宿存在树干上。从水平分布可知,H、M的死枝在南部区域(90°~225°)基径与枝长整体大于北部。这与靳晓娟[19]对长白落叶松的枝条研究结果部分一致。在竞争的结果下南部区域的枝条发育相对北部较好,但较低的保留密度时,发育空间充足,水平分布差异不显著。3种处理中,东部区域(0°~180°)枝条数量整体高于西部区域,H、M的活枝基径与长度,H、M、L的分枝角均表现为南部区域(90°~225°)大于北部区域,但东部区域(0°~180°)枝条数量大于西部区域。这与吴捷[20]对樟子松的研究结果部分一致,樟子松枝条在水平方位区间分布始终较为均匀,但本研究中只有低间伐后的林分保留密度枝条发育水平较为均匀,这是由树种和保留密度的差异引起的。
该研究结果表明,要根据不同的培育目的来调整杉木的间伐后的林分保留密度,高间伐后的林分保留密度会抑制枝条基径和数量的生长,从而减少节子的大小和数量,提高木材质量。除此之外,在杉木幼龄期时可以对林木进行修枝,以减少宿存枝条,达到提高木材质量、培育无节材的目的,综合本研究中的3种间伐保留密度,结果表明1800 株·hm−2间伐后的林分保留密度更适宜培育无节大径材。
不同间伐保留密度对杉木人工林枝条生长的影响
Effects of Different Thinning Retention Densities on Branch Growth of Chinese Fir Plantations
-
摘要:
目的 探究不同间伐后的林分保留密度对杉木人工林枝条发育的影响,为杉木无节材定向培育的间伐密度控制提供理论依据和技术支撑。 方法 以福建省沙县官庄国有林场9年生杉木人工林为研究对象,设置3种不同的林分保留密度:1 200株·hm−2(间伐强度为67%, L)、1 800株·hm−2(间伐强度为51%, M)和2 250株·hm−2(间伐强度:27%, H),间伐后的第5年,在各样地内选取标准木进行观测,探讨不同间伐后的林分保留密度对杉木枝条发育的影响。 结果 1)枝条总量、8 m以下枝条数量、8 m以上枝条数量、死枝数量、活枝数量均表现为:L>M>H,枯枝率表现为H>M>L;2)基径随间伐后的林分保留密度的减小而增大,表现为L>M>H,且L与H之间存在显著性差异(P<0.05),同时L的枝长大于M和H,说明低的林分保留密度更有利于枝条生长;3)活枝枝条基径和枝长呈明显的线性相关,死枝枝条基径和枝长线性相关性较小。4)死枝的基径、枝长、数量与活枝数量随树干垂直高度的增大而增大,活枝的基径与枝长随垂直高度的增大而减小,H、M的分枝角随垂直高度的增加而减小。5)死枝与活枝的基径、枝长与分枝角在南部区域(90°~225°)整体大于北部区域,但枝条数量在东部区域(0°~180°)大于西部区域。 结论 要根据不同的培育目的调整杉木的间伐后的林分保留密度,高的林分保留密度会抑制枝条基径和数量的生长,从而减少节子的大小和数量,提高木材质量。在杉木幼龄期时可以对林木进行修枝,以减少宿存枝条,达到提高木材质量、培育无节材的目的,综合本研究的3种间伐保留密度,其中1 800 株·hm−2的林分保留密度更适宜培育无节大径材。 Abstract:Objective To study the effects of different thinning retention densities on the branch growth of Chinese fir plantations, and to provide scientific theoretical basis and technical support for directed cultivation of Chinese fir knotless-wood. Method Based on the 9-year-old Chinese fir plantations in Guanzhuang state-owned forest farm, Shaxian County, Fujian province, three kinds of thinning retention densities (1200 trees·hm−2(thinning intensity: 67% , L) , 1800 trees·hm−2(thinning intensity: 51% , M) and 2250 trees·hm−2(thinning intensity: 27% , H) were set up. In the fifth year after thinning, standard trees were selected in different plots to study the effect of thinning treatments on the branch growth of Chinese fir. Result 1)The total number of branches, the number of branches below 8 m, the number of branches above 8 m, the number of dead branches, the number of living branches all under L treatment were the largest, followed by treatment M and H, and the percentage of dead branches under treatment H were the largest, followed by treatment M and L. 2)The basal diameter increased with the decrease of thinning intensity which showed L > m > H, and there was significant difference between L and H (P < 0.05) , which indicated that the lower retention density was more conducive to the branch growth. 3)There was a significant linear correlation between the basal diameter and the length of the living branch, while correlation between the basal diameter and the length of the dead branch was small. 4)The basal diameter, branch length, the number of dead branches and the number of living branches increased with the increase of vertical height, while the basal diameter and the length of living branches and the branching angle of H and M decreased with the increase of vertical height of the trunk. 5)The basal diameter, branch length and branching angle of dead and living branches were larger in the southern region (90~225 °) than in the northern region, but the number of branches was larger in the eastern region (0~180 °) than in the western region. Conclusion The thinning intensity should be adjusted according to different cultivation purposes. The lower retention density can inhibit the growth of basal diameter and number of branches, thus reducing the size and number of knots and improving the wood quality. In this study, the retention density1800 trees/ha is more suitable to cultivate knotless large-diameter timber. -
Key words:
- Cunninghamia lanceolata
- / thinning retention density
- / branch growht
- / knotless wood
-
图 1 不同间伐后的林分保留密度对枝下高的影响
Figure 1. Effects of different stand retention densities after thinning on the height under branches
图 2 不同间伐后的林分保留密度对基径、枝长和分枝角的影响
Figure 2. Effect of different stand retention density after thinning on basal diameter, branch length and branch angle
图 3 不同间伐后的林分保留密度下死枝的基径和枝长的回归分析
Figure 3. Regression analysis of basal diameter and length of dead branches under different stand retention densities after thinning
图 4 不同间伐后的林分保留密度下活枝的基径和枝长的回归分析
Figure 4. Regression analysis of basal diameter and length of living branches under different stand retention densities after thinning
表 1 14年生杉木间伐后的林分保留密度试验林的基本特征
Table 1. Basic characteristics of 14-year-old Chinese fir stand after thinning
间伐后的林分保留密度/(株·hm−2)
Stand retention density after thinning平均胸径/cm
Average DBH平均树高/m
Average tree HH ( 2 250) 17.35 ± 0.22 c 13.54 ± 0.08 a M ( 1 800) 18.23 ± 0.2 b 13.42 ± 0.07 a L ( 1 200) 19.57 ± 0.29 a 13.63 ± 0.08 a  下载: 导出CSV
表 2 不同间伐后的林分保留密度对枝条数量的影响
Table 2. Effect of different stand retention density after thinning on the number of branches
处理
Processing枝条数量 Branch number/个 枯枝率/%
Dead branch rate死枝
Dead活枝
Live总量
Total8 m以下
Below 8 meters8 m以上
More than 8 metersH 52.67 ± 3.28 a 60 ± 3.79 b 112.67 ± 5.33 b 52.67 ± 3.28 b 65.67 ± 3.48 a 46.76 ± 1.96 a M 54 ± 3.61 a 62.33 ± 3.38 b 116.33 ± 5.93 b 54 ± 3.61 b 67 ± 3.79 a 46.38 ± 1.6 a L 60.33 ± 2.19 a 83 ± 4.36 a 143.33 ± 4.91 a 67 ± 4.16 a 76.33 ± 2.19 a 42.15 ± 1.59 a 注:同列不同小写字母表示差异显著(P<0.05)。
Note: different lowercase letters in the same column indicate significant difference (p < 0.05) .
下载: 导出CSV
表 3 不同间伐后的林分保留密度杉木枝条死枝垂直分布
Table 3. The vertical distribution of dead branches of Chinese fir with different stand retained density after thinning
分枝特征
Branching characteristics处理
Processing高度区间 Height interval/m 2~4 4~6 6~8 8~10 基径/mm
Base diameterH 14.09 ± 0.73 ab 13.36 ± 0.51 b 15.54 ± 0.51 a 14.78 ± 0.6 ab M 13.7 ± 0.5 b 13.26 ± 0.39 b 15.89 ± 0.55 a 17.49 ± 1.56 a L 12.99 ± 0.46 b 16.97 ± 0.59 a 17.55 ± 0.76 a - 枝长/cm
The branches lengthH 109.89 ± 9.52 b 128.73 ± 9.86 ab 146.91 ± 5.87 a 141.67 ± 5.38 a M 100.12 ± 8.07 c 103.35 ± 7.6 c 138.22 ± 6.54 b 171.2 ± 15.76 a L 100.43 ± 8.29 b 159.57 ± 6.71 a 156.41 ± 7.91 a - 枝条数量/个
Branch numbersH 9.33 ± 0.33 c 15 ± 1.53 b 22.67 ± 2.19 a 5.67 ± 0.33 c M 14 ± 1 a 17.33 ± 1.2 a 18 ± 1.53 a 4.67 ± 0.88 b L 18 ± 1.15 b 25 ± 1.53 a 17.33 ± 0.67 b - 注:同行不同小写字母表示显著差异(P<0.05),下同。
Note: Different lowercase letters in the same line showed significant difference (p < 0.05) ,The same below.
下载: 导出CSV
表 4 不同间伐后的林分保留密度杉木枝条活枝垂直分布
Table 4. The vertical distribution of living branches of Chinese fir with different stand retention densities after thinning
分枝特征
Branching characteristics处理
Processing高度区间 Height interval/m 6~8 8~10 10~12 12~14 基径/mm
Base diameterH — 23 ± 0.77 a 16.54 ± 0.61 b 10.45 ± 0.34 c M — 21.02 ± 0.99 a 18.53 ± 0.65 b 14.46 ± 0.44 c L 24.92 ± 0.72 a 22.1 ± 0.43 b 20.8 ± 0.72 b 11.77 ± 0.47 c 枝长/cm
The branches lengthH — 188.76 ± 5.89 a 114.14 ± 3.85 b 57.71 ± 2.89 c M — 174.61 ± 6.38 a 132.41 ± 4.42 b 76.97 ± 3.51 c L 215.5 ± 4.79 a 181.72 ± 4.18 b 125.66 ± 4.4 c 58.33 ± 3 d 分枝角/(°)
Angle of branchesH — 61.18 ± 1.32 a 52.21 ± 2.15 b 53.62 ± 1.78 b M — 69.82 ± 1.76 a 63.49 ± 1.69 b 60.56 ± 1.44 b L 67.65 ± 1.39 ab 63.35 ± 0.93 bc 70.61 ± 1.78 a 59.67 ± 1.86 c 枝条数量/个
Branch numbersH — 11 ± 0.58 c 21.33 ± 2.19 b 27.67 ± 2.33 a M — 10.33 ± 0.88 c 23 ± 1.73 b 29 ± 2 a L 6.67 ± 2.73 c 23.33 ± 1.2 b 22.33 ± 2.03 b 30.67 ± 1.86 a
下载: 导出CSV
表 5 不同间伐后的林分保留密度杉木枝条死枝水平分布
Table 5. The distribution of dead branches of Chinese fir with different thinning densities
分枝特征
Branching
characteristics处理
Processing方位区间 Azimuth range/(°) 0~45 46~90 91~135 136~180 181~225 226~270 271-315 316-360 基径/mm
Base diameterH 13.72 ±
0.49 b13.65 ±
0.78 b17.7 ±
1.41 a16.96 ±
0.97 a15.16 ±
0.73 ab13.61 ±
0.82 b12.62 ±
0.46 b13.56 ±
1.11 bM 13.16 ±
0.77 ab14.85 ±
0.78 ab16 ±
0.71 a15.22 ±
0.58 ab15.97 ±
1.03 a15.23 ±
1.35 ab13.52 ±
1.11 ab12.75 ±
0.9 bL 16.49 ±
1.01 a16.11 ±
1.06 a16.53 ±
1.08 a15.75 ±
0.93 a16.46 ±
0.84 a16.54 ±
1.19 a13.05 ±
0.79 a15.31 ±
1.33 a枝长/cm
The branches lengthH 109.1 ±
7.97 bc124.67 ±
11.12 bc168.6 ±
10.03 a177.9 ±
13.15 a148.01 ±
8.11 ab130.07 ±
9.96 bc98.52 ±
11.41 c127.9 ±
17.09 bM 102.94 ±
10.9 a114.16 ±
10.77 a144.96 ±
9.82 a129.41 ±
8.64 a143.12 ±
14.99 a111.57 ±
19.87 a103.03 ±
16.98 a102.66 ±
14.67 aL 149.21 ±
16.13 a146.6 ±
13.35 a139.01 ±
10.8 ab145.63 ±
14.1 a140.43 ±
13.55 ab155.24 ±
13.03 a100.89 ±
11.55 b138.81 ±
14.6 ab枝条数量/个
Branch
numbersH 11.67 ±
1.2 a7.33 ±
0.33 b3.33 ±
0.88 c7.67 ±
1.2 b9.33 ±
0.67 ab7 ±
1.15 b4.33 ±
0.33 c2 ±
0.58 cM 9 ±
1.53 ab11 ±
1.53 a6.67 ±
0.33 ab10.33 ±
2.6 a5.67 ±
0.88 bc2 ±
0.58 c4.67 ±
0.67 bc4.67 ±
1.2 bcL 6 ±
0.58 bc7.33 ±
0.88 bc11.33 ±
1.33 a8.67 ±
0.88 ab7.67 ±
1.45 bc6.33 ±
0.88 bc5 ±
0.58 c6.33 ±
1.33 bc
下载: 导出CSV
表 6 不同间伐后的林分保留密度杉木枝条活枝水平分布
Table 6. The horizontal distribution of the living branches of Chinese fir with different stand retained density after thinning
分枝特征
Branching
characteristics处理
Processing方位区间 Azimuth range/(°) 0~45 46~90 91~135 136~180 181~225 226~270 271-315 316-360 基径/mm
Base diameterH 13.25 ±
1.55 ab12.23 ±
1.42 b13.48 ±
1.68 ab16.95 ±
1.16 a15.91 ±
1.33 ab16.43 ±
1.19 ab15.05 ±
0.94 ab13.16 ±
1.2 abM 16.32 ±
0.94 ab16.81 ±
1.38 ab19.96 ±
2.65 a18.38 ±
1.23 ab17.4 ±
0.76 ab16.12 ±
1.34 b17.16 ±
0.8 ab15.93 ±
0.62 bL 18.5 ±
1.23 ab18.84 ±
1.53 ab16.73 ±
1.4 ab20.5 ±
1.02 a17.69 ±
1.22 ab15.92 ±
1.12 b16.65 ±
1.03 ab19.48 ±
1.14 ab枝长/cm
The branches lengthH 83.39 ±
12.12 b78.5 ±
12.26 b79.76 ±
8.35 b111.48 ±
11.05 ab116.32 ±
13.34 ab122.06 ±
12.52 a103.19 ±
10.04 ab90.14 ±
8.46 abM 105.57 ±
9.64 a119.75 ±
10.81 a134.21 ±
18.87 a113.9 ±
10.91 a110.68 ±
9.17 a109.19 ±
12.31 a116.04 ±
9.18 a111.25 ±
7.76 aL 114.83 ±
11.07 abc137.35 ±
13.67 ab99.45 ±
14.74 c143.25 ±
10.64 a119.21 ±
10.68 abc104.59 ±
10.62 bc119.87 ±
10.66 abc141.81 ±
11.43 a分枝角/(°)
Angle of branchesH 49.41 ±
4.18 ab53 ±
4.15 ab56.52 ±
2.61 ab59.82 ±
3.61 a57.44 ±
2.89 ab57.11 ±
2.68 ab52.2 ±
2.57 ab47.26 ±
3.43 bM 64.79 ±
2.32 a66.25 ±
3.46 a68.71 ±
3.82 a61.67 ±
3.49 a64.29 ±
2.53 a60.06 ±
2.96 a59.4 ±
1.99 a63.2 ±
2.26 aL 65.82 ±
3.54 ab58.72 ±
2.01 b61.4 ±
2.74 ab66.14 ±
2.11 ab67.56 ±
1.96 a64.12 ±
2.67 ab60.79 ±
2.81 ab66.37 ±
2.38 ab枝条数量/个
Branch numbersH 6 ±
0.58 cde5 ±
0.58 e5.67 ±
0.88 de9 ±
1.53 ab8.33 ±
0.88 abcd10.33 ±
0.33 a8.67 ±
1.2 abc7.33 ±
0.33 bcdeM 7 ±
0.58 bc6.67 ±
0.67 bc4.67 ±
0.33 c6.67 ±
0.33 bc9.67 ±
0.88 a8.67 ±
0.88 ab8.33 ±
1.33 ab10.67 ±
0.88 aL 11.67 ±
0.88 ab8.67 ±
0.67 cd6.67 ±
0.33 d12.33 ±
0.88 ab13.33 ±
1.2 a9.67 ±
0.88 bc10.33 ±
0.88 bc10.67 ±
0.88 abc
下载: 导出CSV
-
[1] 黄樟雄. 抚育间伐对马尾松中龄林林木生长的影响[J]. 林业勘察设计, 2019, 39(4):49-53. [2] 黄 鑫, 郑夔荣, 周志翔, 等. 湖北省马尾松林生态服务价值的空间分异特征[J]. 林业调查规划, 2019, 44(5):84-90,141. [3] 张英楠. 影响木材质量的关键因子-枝条基径规律探讨[J]. 黑龙江生态工程职业学院学报, 2009, 22(6):45-46. [4] 欧阳红旗, 王俊杰. 造林密度对中华猕猴桃枝条产量及经济效益的影响[J]. 湖南林业科技, 2014, 41(3):14-18. [5] 王志海, 尹光天, 杨锦昌, 等. 不同造林密度对米老排人工林枝条发育的影响[J]. 林业科学研究, 2019, 32(2):78-86. [6] 章志都, 徐程扬, 蔡宝军, 等. 林分密度对山桃树冠结构的影响研究[J]. 北京林业大学学报, 2009, 31(6):187-192. [7] 许冠军, 郑 宏, 林开敏, 等. 间伐密度管理模式对杉木大径材生长的影响[J]. 福建农林大学学报(自然科学版), 2019, 48(6):753-759. [8] 李大勇, 张国强, 袁慧菊. 冀北山地不同密度华北落叶松林生长状况分析[J]. 防护林科技, 2019(12):43-44,60. [9] 李志辉. 湘东地区杉木人工林间伐效果分析研究[J]. 林业科学, 2000(S1):131-136. [10] 熊光康, 厉月桥, 熊有强, 等. 低密度造林对杉木生长、形质和材种结构的影响[J]. 南京林业大学学报(自然科学版), 2021, 45(3):165-173. [11] 刘 静, 赵铭臻, 王利艳, 等. 间伐保留密度和套种对杉木中龄林材种结构的影响[J]. 森林与环境学报, 2021, 41(6):593-600. [12] 俞新妥, 叶功富, 李大岔. 杉木栽培制度的理论探讨[J]. 林业科学, 1994, 40(1):11-17. [13] 龙忠于, 周开德, 王华东. 不同间伐强度对杉木人工林林分生长的影响[J]. 湖南林业科技, 2016, 43(5):104-108. [14] 杨桂娟, 胡海帆, 孙洪刚, 等. 林分年龄/造林密度和林分自然稀疏对杉木人工林个体大小分化和生产力关系的影响[J]. 林业科学, 2019, 55(11):126-136. [15] 刘新亮, 章 挺, 邱凤英, 等. 造林密度对材用樟树幼林生长和蓄积量的影响[J]. 中南林业科技大学学报, 2019, 39(3):23-27,60. [16] 吴 鞠, 陈 瑜, 刘海轩, 等. 林分密度及混交度对长白山天然风景林树木形态的影响[J]. 林业科学, 2018, 54(12):12-21. [17] 唐继新, 贾宏炎, 王 科, 等. 密度调控对米老排中龄人工林生长的影响[J]. 南京林业大学学报(自然科学版), 2019, 43(1):45-53. [18] 何韦均, 杨锦昌, 郝建等. 米老排人工林节子时空分布特征及变色规律[J]. 浙江农林大学学报, 2022, 39(4):814-820. [19] 靳晓娟. 长白落叶松枝条属性因子分布规律及模型构建[D]. 北京: 北京林业大学, 2022. [20] 吴 捷, 肖 锐, 杨 凯. 樟子松人工林枝条分布的研究[J]. 林业勘查设计, 2018(3):110-112. -

 点击查看大图
计量
- 文章访问数: 1105
- HTML全文浏览量: 567
- PDF下载量: 16
- 被引次数: 0
