• 中国中文核心期刊
  • 中国科学引文数据库(CSCD)核心库来源期刊
  • 中国科技论文统计源期刊(CJCR)
  • 第二届国家期刊奖提名奖
Volume 37 Issue 2
Apr.  2024
Article Contents
Turn off MathJax

Citation:

Effect of UAV-LiDAR Point Density on Estimation Accuracy of Forest Inventory Attributes

  • Corresponding author: LI Chun-gan, gxali@126.com
  • Received Date: 2023-06-07
    Accepted Date: 2023-07-26
  • Objective Point density is a key factor affecting the cost and efficiency of data acquisition and pre-processing of unmanned aerial vehicle (UAV)-based light detection and ranging (LiDAR), and it is helpful to explore the effects of point density on the estimation accuracy of UAV-LiDAR-based forest inventory attributes to optimize the technical schemes for UAV-LiDAR forest applications. Methods This study focused on the planted Masson pine and Eucalyptus forests. The original UAV-LiDAR point cloud with a density of 247 points∙m−2 was reduced by 40%, 20%, 8%, 4%, and 2% according to the percentage of the total point reduction algorithm to obtain six plot-level UAV-LiDAR datasets, including five sets of reduced point densities. Each dataset was pre-processed separately, including point cloud classification, ground point filtering, digital elevation model (DEM) generation, point cloud height normalization, and UAV-LiDAR-derived metric extractions. The same multiplicative power formula was used for estimating the same forest parameters (stand volume, basal area, mean height, and average diameter at breast height) for the same forest type, and each dataset was used to calibrate the model. Then, the differences in the goodness-of-fit statistics of the models were compared and analyzed based oncoefficient of determination (R2), relative root square error (rRMSE), mean prediction error (MPE), and the differences in the mean of the estimates and the UAV-LiDAR-derived metrics between the reduced point density datasets and the original point density dataset were statistically analyzed. Results The results indicated that the model accuracy remained essentially the same when the original point density was reduced to 100, 50,..., 5 points∙m−2, and there were no statistically significant differences (p≥0.05) in the estimates of forest inventory attributes between the reduced point density datasets and the original point density dataset. There were basically no statistically significant differences (p≥0.05) in UAV-LiDAR-derived metrics between the reduced point density datasets and the original point density dataset. Conclusion In the application of UAV lidar forest resource inventory and monitoring, the point cloud density can be as low as 5 points∙m−2. However, the results of this experiment still need to be verified by acquiring point cloud data at different densities at different flight altitudes.
  • 加载中
  • [1]

    Hyyppä J, Hyyppä H, Leckie D, et al. Review of methods of small-footprint airborne laser scanning for extracting forest inventory data in boreal forests[J]. International Journal of Remote Sensing, 2008, 29: 1339-1366. doi: 10.1080/01431160701736489
    [2]

    Jaakkola A, Hyyppä J, Kukko A, et al. A low-cost multi-sensoral mobile mapping system and its feasibility for tree measurements[J]. ISPRS Journal of Photogrammetry and Remote Sensing, 2010, 65: 514-522. doi: 10.1016/j.isprsjprs.2010.08.002
    [3]

    Kellner J R, Armston J, Birrer M, et al. New opportunities for forest remote sensing through ultra-high-density drone lidar[J]. Surveys in Geophysics, 2019, 40: 959-977. doi: 10.1007/s10712-019-09529-9
    [4]

    Hu T, Sun X, Su Y, et al. Development and performance evaluation of a very low-cost UAV-lidar system for forestry applications[J]. Remote Sensing, 2021, 13: 77.
    [5]

    Wallace L, Lucieer A, Watson C, et al. Development of a UAV-LiDAR system with application to forest inventory[J]. Remote Sensing, 2012, 4: 1519-1543. doi: 10.3390/rs4061519
    [6]

    Renslow M S, Greefield P, Guay T. Evaluation of multi-return LiDAR for forestry applications[C]. Report Prepared for the Inventory and Monitoring Steering Committee of the USDA Forest Service. US Department of Agriculture Forest Service—Engineering. Remote Sensing Applications Center, November 2000. RSAC-2060/4810-LSP-0001-RPT1.
    [7]

    Singh K K, Chen G, Vogler J B, et al. When big data are too much: effects of LiDAR returns and point density on estimation of forest biomass[J]. IEEE J-STARS, 2016, 9(7): 3210-3218.
    [8]

    Vauhkonen J, Ørka H O, Holmgren J, et al. Tree species recognition based on airborne laser scanning and complementary data sources[A] // Maltamo M, Næsset E, Vauhkonen J. Forestry applications of airborne laser scanning: concepts and case studies. Managing forest ecosystems 27, Springer Science C Business Media Dordrecht 2014, 135-156.
    [9]

    Latifi H, Fassnacht F E, Müller J, et al. Forest inventories by LiDAR data: A comparison of single tree segmentation and metric-based methods for inventories of a heterogeneous temperate forest[J]. International Journal of Applied Earth Observation and Geoinformation, 2015, 42: 162-174. doi: 10.1016/j.jag.2015.06.008
    [10]

    Puliti S, Olerka H, Gobakken T, et al. Inventory of small forest areas using an unmanned aerial system[J]. Remote Sensing, 2015, 7: 9632-9654. doi: 10.3390/rs70809632
    [11]

    Pearse G D, Dash J P, Persson H J, et al. Comparison of high-density LiDAR and satellite photogrammetry for forest inventory[J]. ISPRS Journal of Photogrammetry and Remote Sensing, 2018, 142: 257-267. doi: 10.1016/j.isprsjprs.2018.06.006
    [12]

    Gobakken T, Næsset E. Assessing effects of laser point density, ground sampling intensity, and field sample plot size on biophysical stand properties derived from airborne laser scanner data[J]. Canadian Journal of Forest Research, 2008, 38: 1095-1109. doi: 10.1139/X07-219
    [13]

    Hao Y, Widagdo F R A, Liu X, et al. Estimation and calibration of stem diameter distribution using UAV laser scanning data: A case study for larch (Larix olgensis) forests in Northeast China[J]. Remote Sensing of Environment, 2022, 268: 112769. doi: 10.1016/j.rse.2021.112769
    [14]

    Zhang B, Li X, Du H, et al. Estimation of urban forest characteristic parameters using UAV-Lidar coupled with canopy volume[J]. Remote Sensing, 2022, 14: 6375. doi: 10.3390/rs14246375
    [15]

    Sumnall M J, Albaugh T J, Carter D R, et al. Effect of varied unmanned aerial vehicle laser scanning pulse density on accurately quantifying forest structure[J]. International Journal of Remote Sensing, 2022, 43: 721-750. doi: 10.1080/01431161.2021.2023229
    [16]

    Peng X, Zhao A, Chen Y, et al. Tree height measurements in degraded tropical forests based on UAV-LiDAR data of different point cloud densities: A case study on Dacrydium pierrei in China[J]. Forests, 2021, 12: 328. doi: 10.3390/f12030328
    [17]

    Singh K K, Chen G, McCarter J B, et al. Effects of LiDAR point density and landscape context on estimates of urban forest biomass[J]. ISPRS Journal of Photogrammetry and Remote Sensing, 2015, 101: 310-322. doi: 10.1016/j.isprsjprs.2014.12.021
    [18]

    Zhang Q, Hu M, Zhou Y, et al. Effects of UAV-LiDAR and photogrammetric point density on tea plucking area identification[J]. Remote Sensing, 2022, 14: 1505. doi: 10.3390/rs14061505
    [19]

    Magnusson M, Fransson J E S, Holmgren J. Effects on estimation accuracy of forest variables using different pulse density of laser data[J]. Forest Science, 2007, 53(6): 619-626.
    [20]

    BCAL LiDAR Tools, Version 1.5. 2, 2013[CP]. Idaho State University, Department of Geosciences, Boise Center Aerospace Laboratory (BCAL), Boise, Idaho. http://bcal.geology.isu.edu/envitools.shtml.
    [21] 郭庆华, 苏艳军, 胡天宇, 等. 激光雷达森林生态应用——理论、方法及实例[M]. 北京: 高等教育出版社, 2018, 208-209.

    [22]

    Bouvier M, Durrieu S, Fournier R A, et al. Generalizing predictive models of forest inventory attributes using an area-based approach with airborne LiDAR data[J]. Remote Sensing of Environment, 2015, 156: 322-334. doi: 10.1016/j.rse.2014.10.004
    [23]

    Li C, Chen Z, Zhou X, et al. Generalized models for subtropical forest inventory attribute estimations using a rule-based exhaustive combination approach with airborne LiDAR-derived metrics[J]. Giscience & Rremote Sensing, 2023, 60(1): 2194601.
    [24] 李春干, 李 振, 代华兵. 机载激光雷达森林资源调查与监测[M]. 北京: 科学出版社, 2023, 126-144.

    [25] 曾伟生, 唐守正. 立木生物量方程的优度评价和精度分析[J]. 林业科学, 2011, 47(11):106-113.

    [26]

    Montealegre A L, Lamelas M T, de la Riva J, et al. Use of low point density ALS data to estimate stand-level structural variables in Mediterranean Aleppo pine forest[J]. Forestry, 2016, 89: 373-382. doi: 10.1093/forestry/cpw008
    [27]

    Ota T, Kajisa T, Mizoue N, et al. Estimating aboveground carbon using airborne LiDAR in Cambodian tropical seasonal forests for redd + implementation[J]. Journal of Forest Research, 2015, 20(6): 484-492. doi: 10.1007/s10310-015-0504-3
    [28]

    Strunk J, Temesgen H, Andersen H E, et al. Effects of pulse density and sample size on a model-assisted approach to estimate forest inventory variables[J]. Canadian Journal of Remote Sensing, 2012, 38(5): 644-654. doi: 10.5589/m12-052
    [29]

    Næsset E. Practical large-scale forest stand inventory using a small-footprint airborne scanning laser[J]. Scandinavian Journal of Forest Research, 2004, 19: 164-179. doi: 10.1080/02827580310019257
    [30]

    Thomas V, Treitz P, Mccaughey J H, et al. Mapping stand-level forest biophysical variables for a mixedwood boreal forest using LiDAR: an examination of scanning density[J]. Canadian Journal of Forest Research, 2006, 36(1): 34-47. doi: 10.1139/x05-230
    [31]

    Næsset, E. Area-Based Inventory in Norway – From innovation to an operational reality[A] // Maltamo M, Næsset E, Vauhkonen J. Forestry applications of airborne laser scanning: concepts and case studies. Managing forest ecosystems 27, Springer Science C Business Media Dordrecht 2014, 215-240.
    [32]

    Næsset E. Effects of sensors, flying altitudes, and pulse repetition frequencies on forest canopy metrics and biophysical stand properties derived from small-footprint airborne laser data[J]. Remote Sensing of Environment, 2014, 91(2): 243-255.
  • 加载中
通讯作者: 陈斌, bchen63@163.com
  • 1. 

    沈阳化工大学材料科学与工程学院 沈阳 110142

  1. 本站搜索
  2. 百度学术搜索
  3. 万方数据库搜索
  4. CNKI搜索

Figures(2) / Tables(4)

Article views(1557) PDF downloads(20) Cited by()

Proportional views

Effect of UAV-LiDAR Point Density on Estimation Accuracy of Forest Inventory Attributes

    Corresponding author: LI Chun-gan, gxali@126.com
  • 1. School of Computer, Electronic and Information in Guangxi University, Nanning 530004, Guangxi, China
  • 2. Forestry College of Guangxi University, Nanning  530004, Guangx, China
  • 3. Guangxi Forest Inventory and Planning Institute, Nanning 530011, Guangxi, China

Abstract:  Objective Point density is a key factor affecting the cost and efficiency of data acquisition and pre-processing of unmanned aerial vehicle (UAV)-based light detection and ranging (LiDAR), and it is helpful to explore the effects of point density on the estimation accuracy of UAV-LiDAR-based forest inventory attributes to optimize the technical schemes for UAV-LiDAR forest applications. Methods This study focused on the planted Masson pine and Eucalyptus forests. The original UAV-LiDAR point cloud with a density of 247 points∙m−2 was reduced by 40%, 20%, 8%, 4%, and 2% according to the percentage of the total point reduction algorithm to obtain six plot-level UAV-LiDAR datasets, including five sets of reduced point densities. Each dataset was pre-processed separately, including point cloud classification, ground point filtering, digital elevation model (DEM) generation, point cloud height normalization, and UAV-LiDAR-derived metric extractions. The same multiplicative power formula was used for estimating the same forest parameters (stand volume, basal area, mean height, and average diameter at breast height) for the same forest type, and each dataset was used to calibrate the model. Then, the differences in the goodness-of-fit statistics of the models were compared and analyzed based oncoefficient of determination (R2), relative root square error (rRMSE), mean prediction error (MPE), and the differences in the mean of the estimates and the UAV-LiDAR-derived metrics between the reduced point density datasets and the original point density dataset were statistically analyzed. Results The results indicated that the model accuracy remained essentially the same when the original point density was reduced to 100, 50,..., 5 points∙m−2, and there were no statistically significant differences (p≥0.05) in the estimates of forest inventory attributes between the reduced point density datasets and the original point density dataset. There were basically no statistically significant differences (p≥0.05) in UAV-LiDAR-derived metrics between the reduced point density datasets and the original point density dataset. Conclusion In the application of UAV lidar forest resource inventory and monitoring, the point cloud density can be as low as 5 points∙m−2. However, the results of this experiment still need to be verified by acquiring point cloud data at different densities at different flight altitudes.

  • 机载激光雷达已经成为当前森林资源调查的强大工具[1]。自Jaakkola等于2009年开展第一次无人机(UAV)激光雷达(LiDAR)森林应用试验[2]以来,随着自动驾驶车用激光扫描仪的发展,国内外已经开发了大量商用的、可搭载于轻型无人机的轻量级激光雷达系统[3-4]。这些激光扫描仪大多可以测量250 m范围内的物体,并具有较高的测距精度(≤5 cm),能够较为准确地提取森林冠层高度和其他森林参数[4]。并且,无人机激光雷达具有使用简单灵活、费用低、易重复等优势,在小区域森林资源、森林健康、森林火灾、造林成效等调查监测中得到大量应用[5]

    传感器技术的发展极大地改善了机载激光雷达的数据精度。离散激光雷达系统产生的点云密度和回波数量呈指数增加的趋势[6-7],可以提取枝条等十分详细的树冠结构信息[8]。一些传感器(如Riegl Q680i和YellowScan Mapper等)的点云密度达到了30~40点∙m−2[9-10]。在以直升飞机为平台进行低空飞行和窄扫描角的情况下,激光雷达的点云密度可以高达每平方米上千个甚至数千个[10-11],能够极为精确地刻画林木的枝、干结构,达到可以取代地基激光雷达和地面调查的程度[3]。有研究表明,点云密度越大,激光雷达提供的信息越丰富,林分林木参数估测精度越高[12]。与机载激光雷达相比,无人机激光雷达的点云密度更高,一般达200点∙m−2以上[13-14]。然而,无论是机载激光雷达还是无人机激光雷达,数据获取与预处理费用和效率是应用中必须考虑的问题。点云密度与飞行高度、速度、航线重叠率等密切相关,是影响数据获取和预处理成本和效率最重要的因素。因此,探明适宜的点云密度,对于无人机激光雷达森林应用十分重要。研究目的和背景不同,所需的点云密度亦不相同。有研究表明:在提取火炬松(Pinus taeda L)人工林单木树高时,当点云密度≥50点∙m−2时,根方根误差(RMSE)和标准差才趋于稳定[15]。也有研究表明,对于孤立木,当点云密度由8点∙m−2增加至62点∙m−2时,树高提取的标准差由0.26 m减少至0.15 m[5]。Peng等[16]对陆均松(Dacrydium pierrei de Laub)林分单木树高提取的研究表明,当点云密度分别由12点∙m−2增加到17点∙m−2、17点∙m−2增加到108点∙m−2时,均方根误差分别减少了6.92%和0.99%,说明点云密度17点∙m−2可满足陆均松树高提取需要。有关无人机激光雷达点云密度对林分(样地)尺度森林参数估测精度影响的研究报道很少,仅见的公开发表论文是Sumnall等对火炬松人工林叶面积指数(LAI)的研究。他们指出:当点云密度高于0.5点∙m−2时,样地尺度LAI估测精度基本上不受点密度变化的影响[15]。显然,有关点云密度对无人机激光雷达林分尺度森林参数估测的影响,仍需要进行更多的试验,以确定适宜的点云密度,为无人机激光雷达森林资源调查监测技术方案优化提供技术支持。

    本研究的目的是评估点云密度对无人机激光雷达森林参数估测精度的影响,为林分尺度无人机激光雷达森林调查监测应用的技术方案设计提供参考依据。为此,在一个小区域人工林区获取了无人机激光雷达数据,并在马尾松林和桉树林中进行了样地调查。试验的具体目标包括:(1)探明密度点云对林分尺度无人机激光雷达森林参数估测精度的影响;(2)分析不同密度点云的无人机激光雷达变量的差异。

    • 本试验在广西南宁市北部的国有高峰林场界牌、东升分场进行。试验区为一个呈东北―西南走向的近矩形区域,中心地理位置为22°58′33″ N,108°23′45″ E,长11.2 km,宽4.2 km,面积约4 770 hm2。研究区内森林几乎全部为人工林,其中:杉木(Cunninghamia lanceolata (Lamb.) Hook.)林、松树林、桉树林和一般阔叶林分别占森林面积的10.0%、14.8%、46.8%和26.1%。桉树林主要为尾叶桉(Eucalyptus urohpylla S. T. Blake)和巨尾桉(E. grandis W. Hill ex Maiden × E. urohpylla)林,全为同龄纯林;松树林主要为马尾松(Pinus massoniana Lamb.)林,约三分之一为异龄混交林(与阔叶树、杉木混交),其余为纯林。

    • 本研究对象为马尾松林和桉树林。2022年3月在试验区内分别设置马尾松林、桉树林样地33个和35个。样地面积为30 m × 20 m,分为4个面积为15 m × 10 m的亚样地。采用千寻星矩SR6网络惯导RTK-GNSS接收机(上海千寻位置网络有限公司)进行样地和亚样地测设。全部样地的角点坐标均可采集到固定解,样地定位精度满足样地数据与UAV-LiDAR数据空间配准要求。对样地内直径≥5.0 cm的林木进行每木检尺,并记录树种(组)名称。根据样木的直径分布,按均匀分布原则选取5~7个径级,每个径级选取3~4株样木,采用超声波测高仪(Haglöf VERTEX Ⅳ)测量树高。每个样地测量20~21株优势树种的树高,用于建立直径-树高模型,以计算样木的树高。对于样地内的杉木和阔叶树样木,采用2016年同区域样地调查材料建立的相应树种的直径-树高模型计算树高。采用广西立木二元材积表计算样木材积。研究区中马尾松林幼、中龄林很少,样地中以成过熟林居多。样地基本情况见表1

      森林类型
      Forest type
      样地数量
      Number of
      plot
      林木密度
      Stem density/
      (株∙hm−2
      平均直径
      Average DBH
      平均高
      Average height
      断面积
      Basal area
      蓄积量
      Stand volume
      均值
      Mean/cm
      CV/% 均值
      Mean/m
      CV/% 均值
      Mean/(m2∙hm−2)
      CV/% 均值
      Mean/(m3∙hm−2)
      CV/%
      马尾松林
      Masson pine forest
      33 717~2 233 26.2 24.6 17.5 26.2 32.9 23.4 242.7 30.5
      桉树林
      Eucalyptus forest
      35 1 067~3 450 11.1 28.0 15.2 30.6 18.3 53.9 150.6 65.3

      Table 1.  Summary statistics of the field plot

    • 2022年3月采用深圳飞马机器人科技有限公司生产的飞马D2000四旋翼无人机系统获取LiDAR点云数据。该系统集成了激光测距、全球导航卫星系统(GNSS)和惯性导航系统(IMS)。激光雷达传感器为D-LiDAR2000。工作波长为905 nm,发散角0.03°H × 0.28°V,点频240 kpts∙s−1,回波数为3回波,最大测程320 m,测距精度 ± 2 cm。标称定位定姿系统(POS)定位精度:水平2 cm,垂直3 cm,横滚/俯仰精度0.006°,航向角精度0.03°。GNSS和惯导数据更新频率分别为20 Hz和200 Hz。仿地飞行,相对航高200 m,航速6 m∙s−1。共飞行了40架次,约22 h。激光点云平均密度约247点∙m−2

    2.   方法
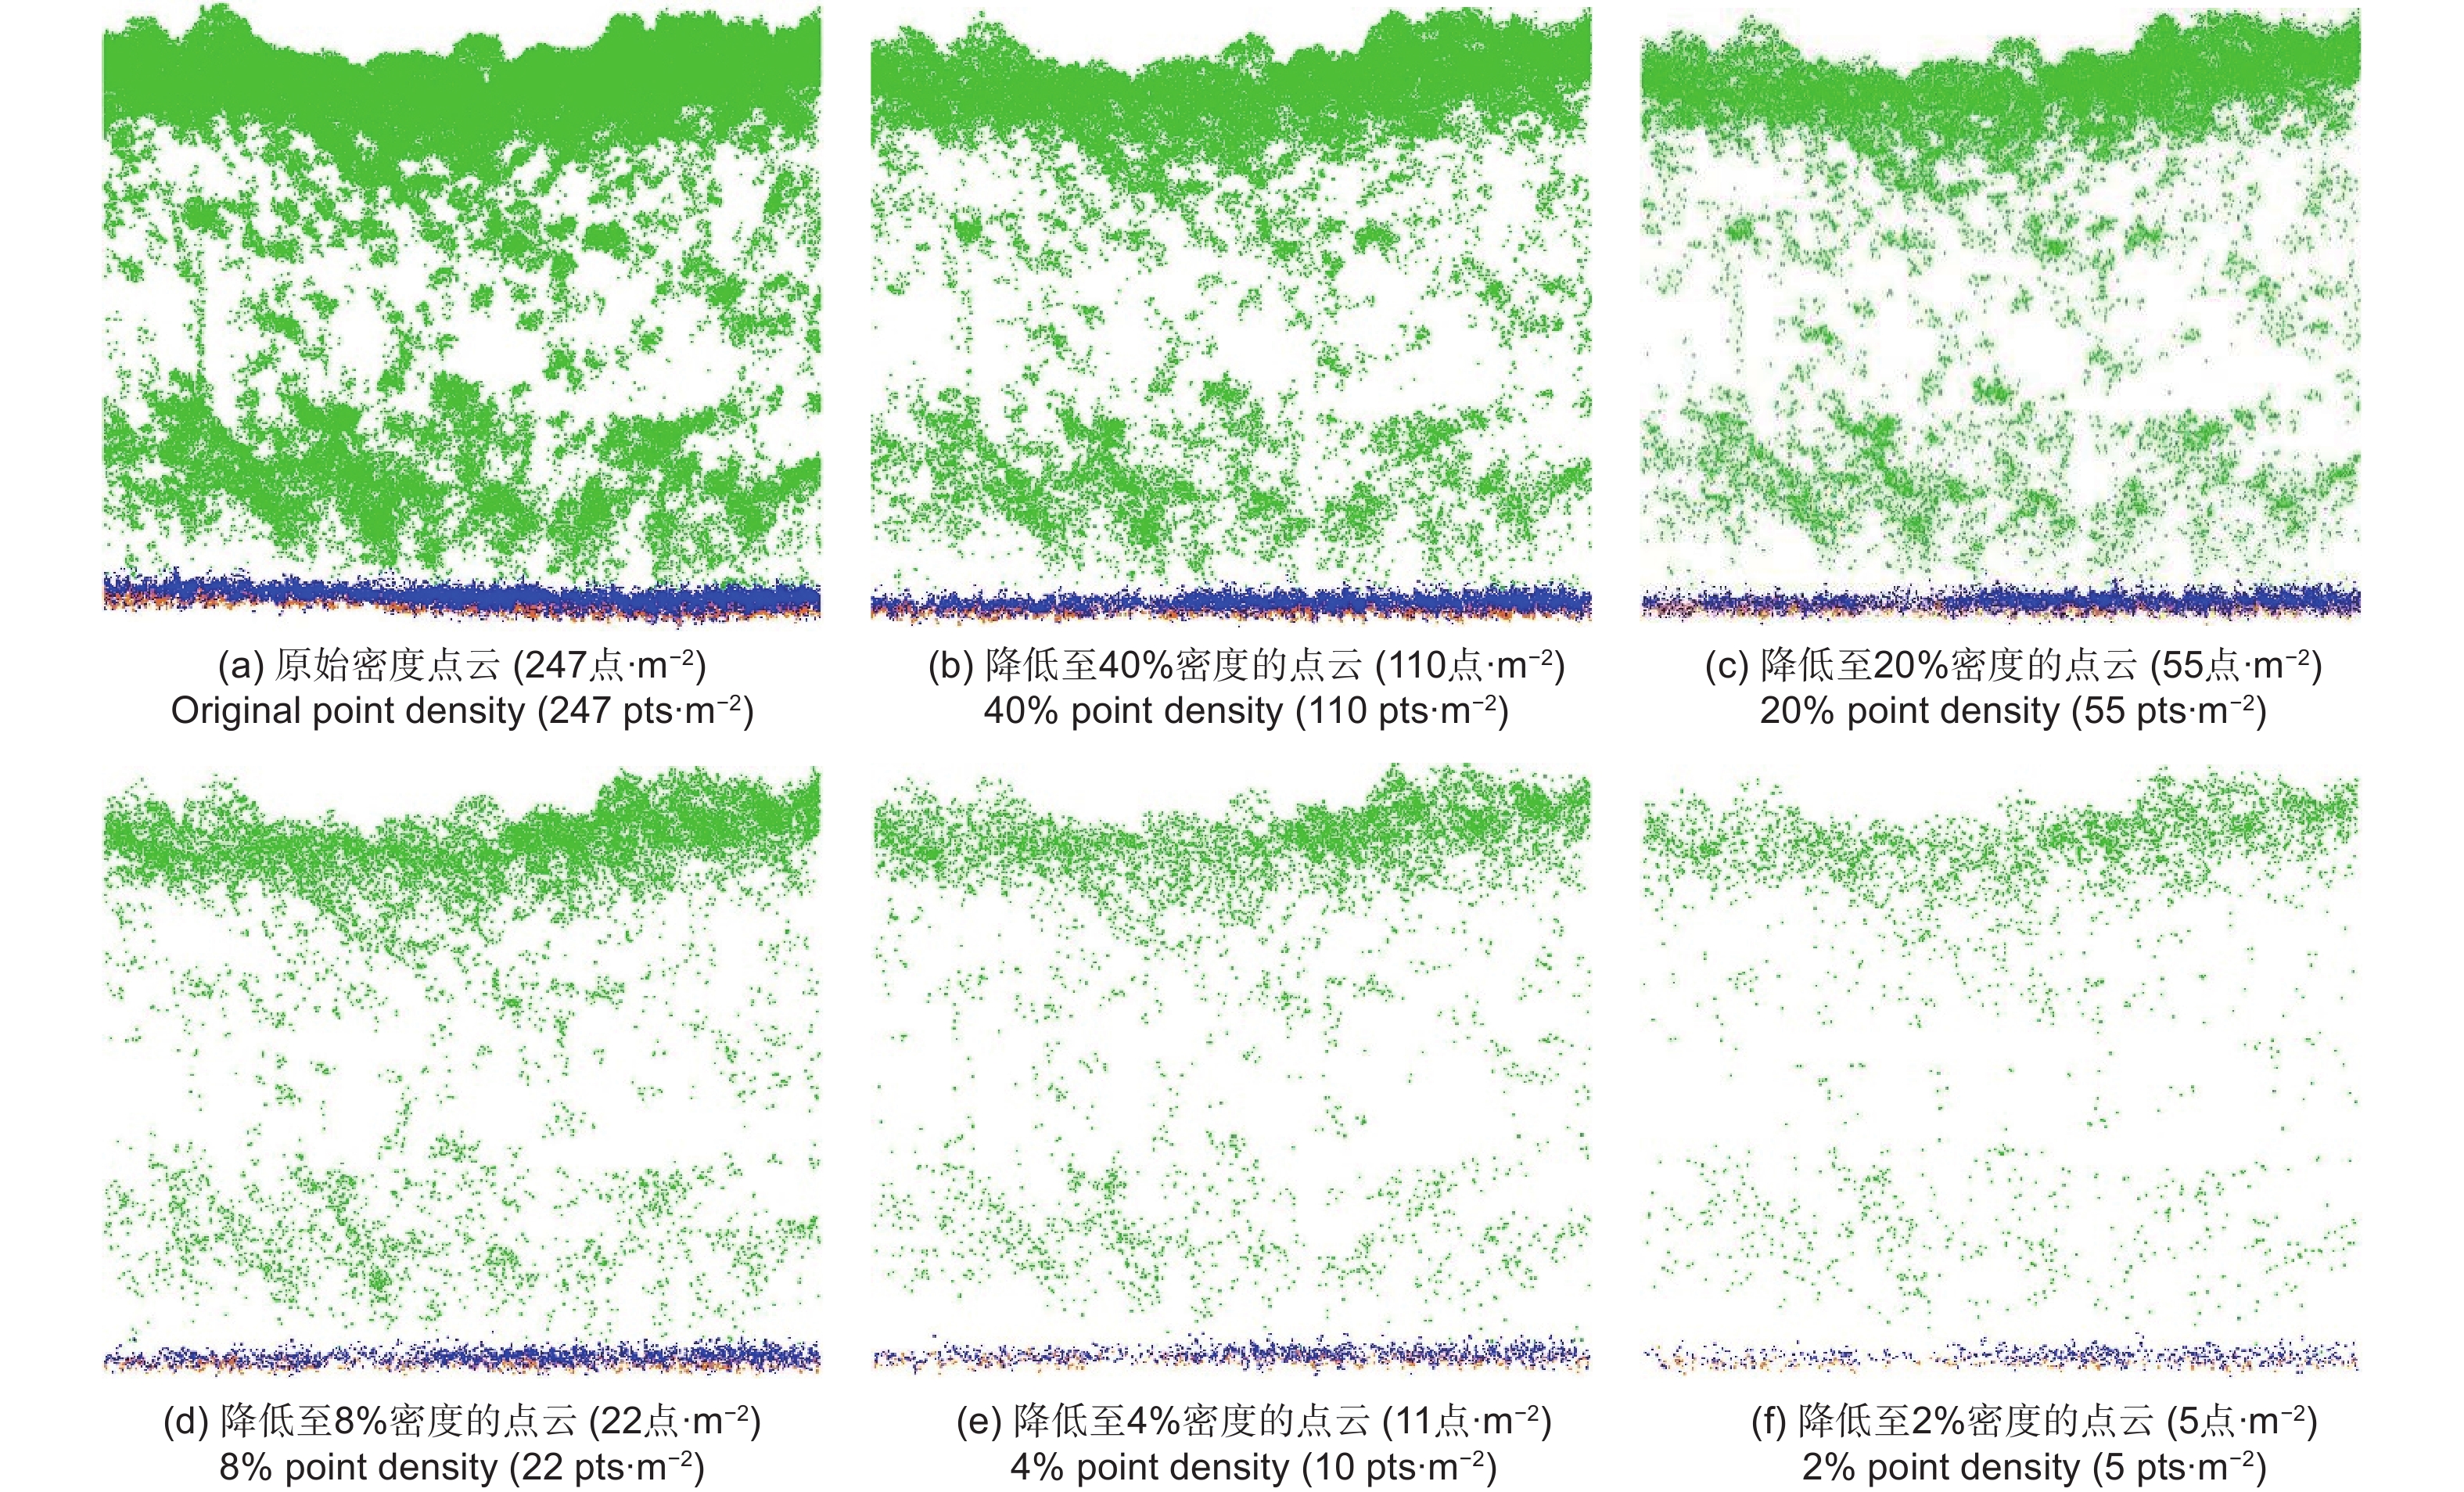
    • 有多种降低激光雷达点云密度的方法,如:百分比法[17-18],以GNSS时间为基础的系统抽样法[1],随机抽样法[12],间隔距离法[19]。在本试验中,采用美国Boise中心航空航天实验室研制的点云百分比重采样工具[20]对原始点云(247 点∙m−2)进行点云抽稀,该工具从每个回波的等高点中按总点数的百分比随机选取保留点云。将原始密度点云分别降低至40%、20%、8%、4%和2%,得到5个稀疏密度点云数据集,平均密度分别为110、55、22、11、5点∙m−2。不同密度的样地尺度点云分布见图1

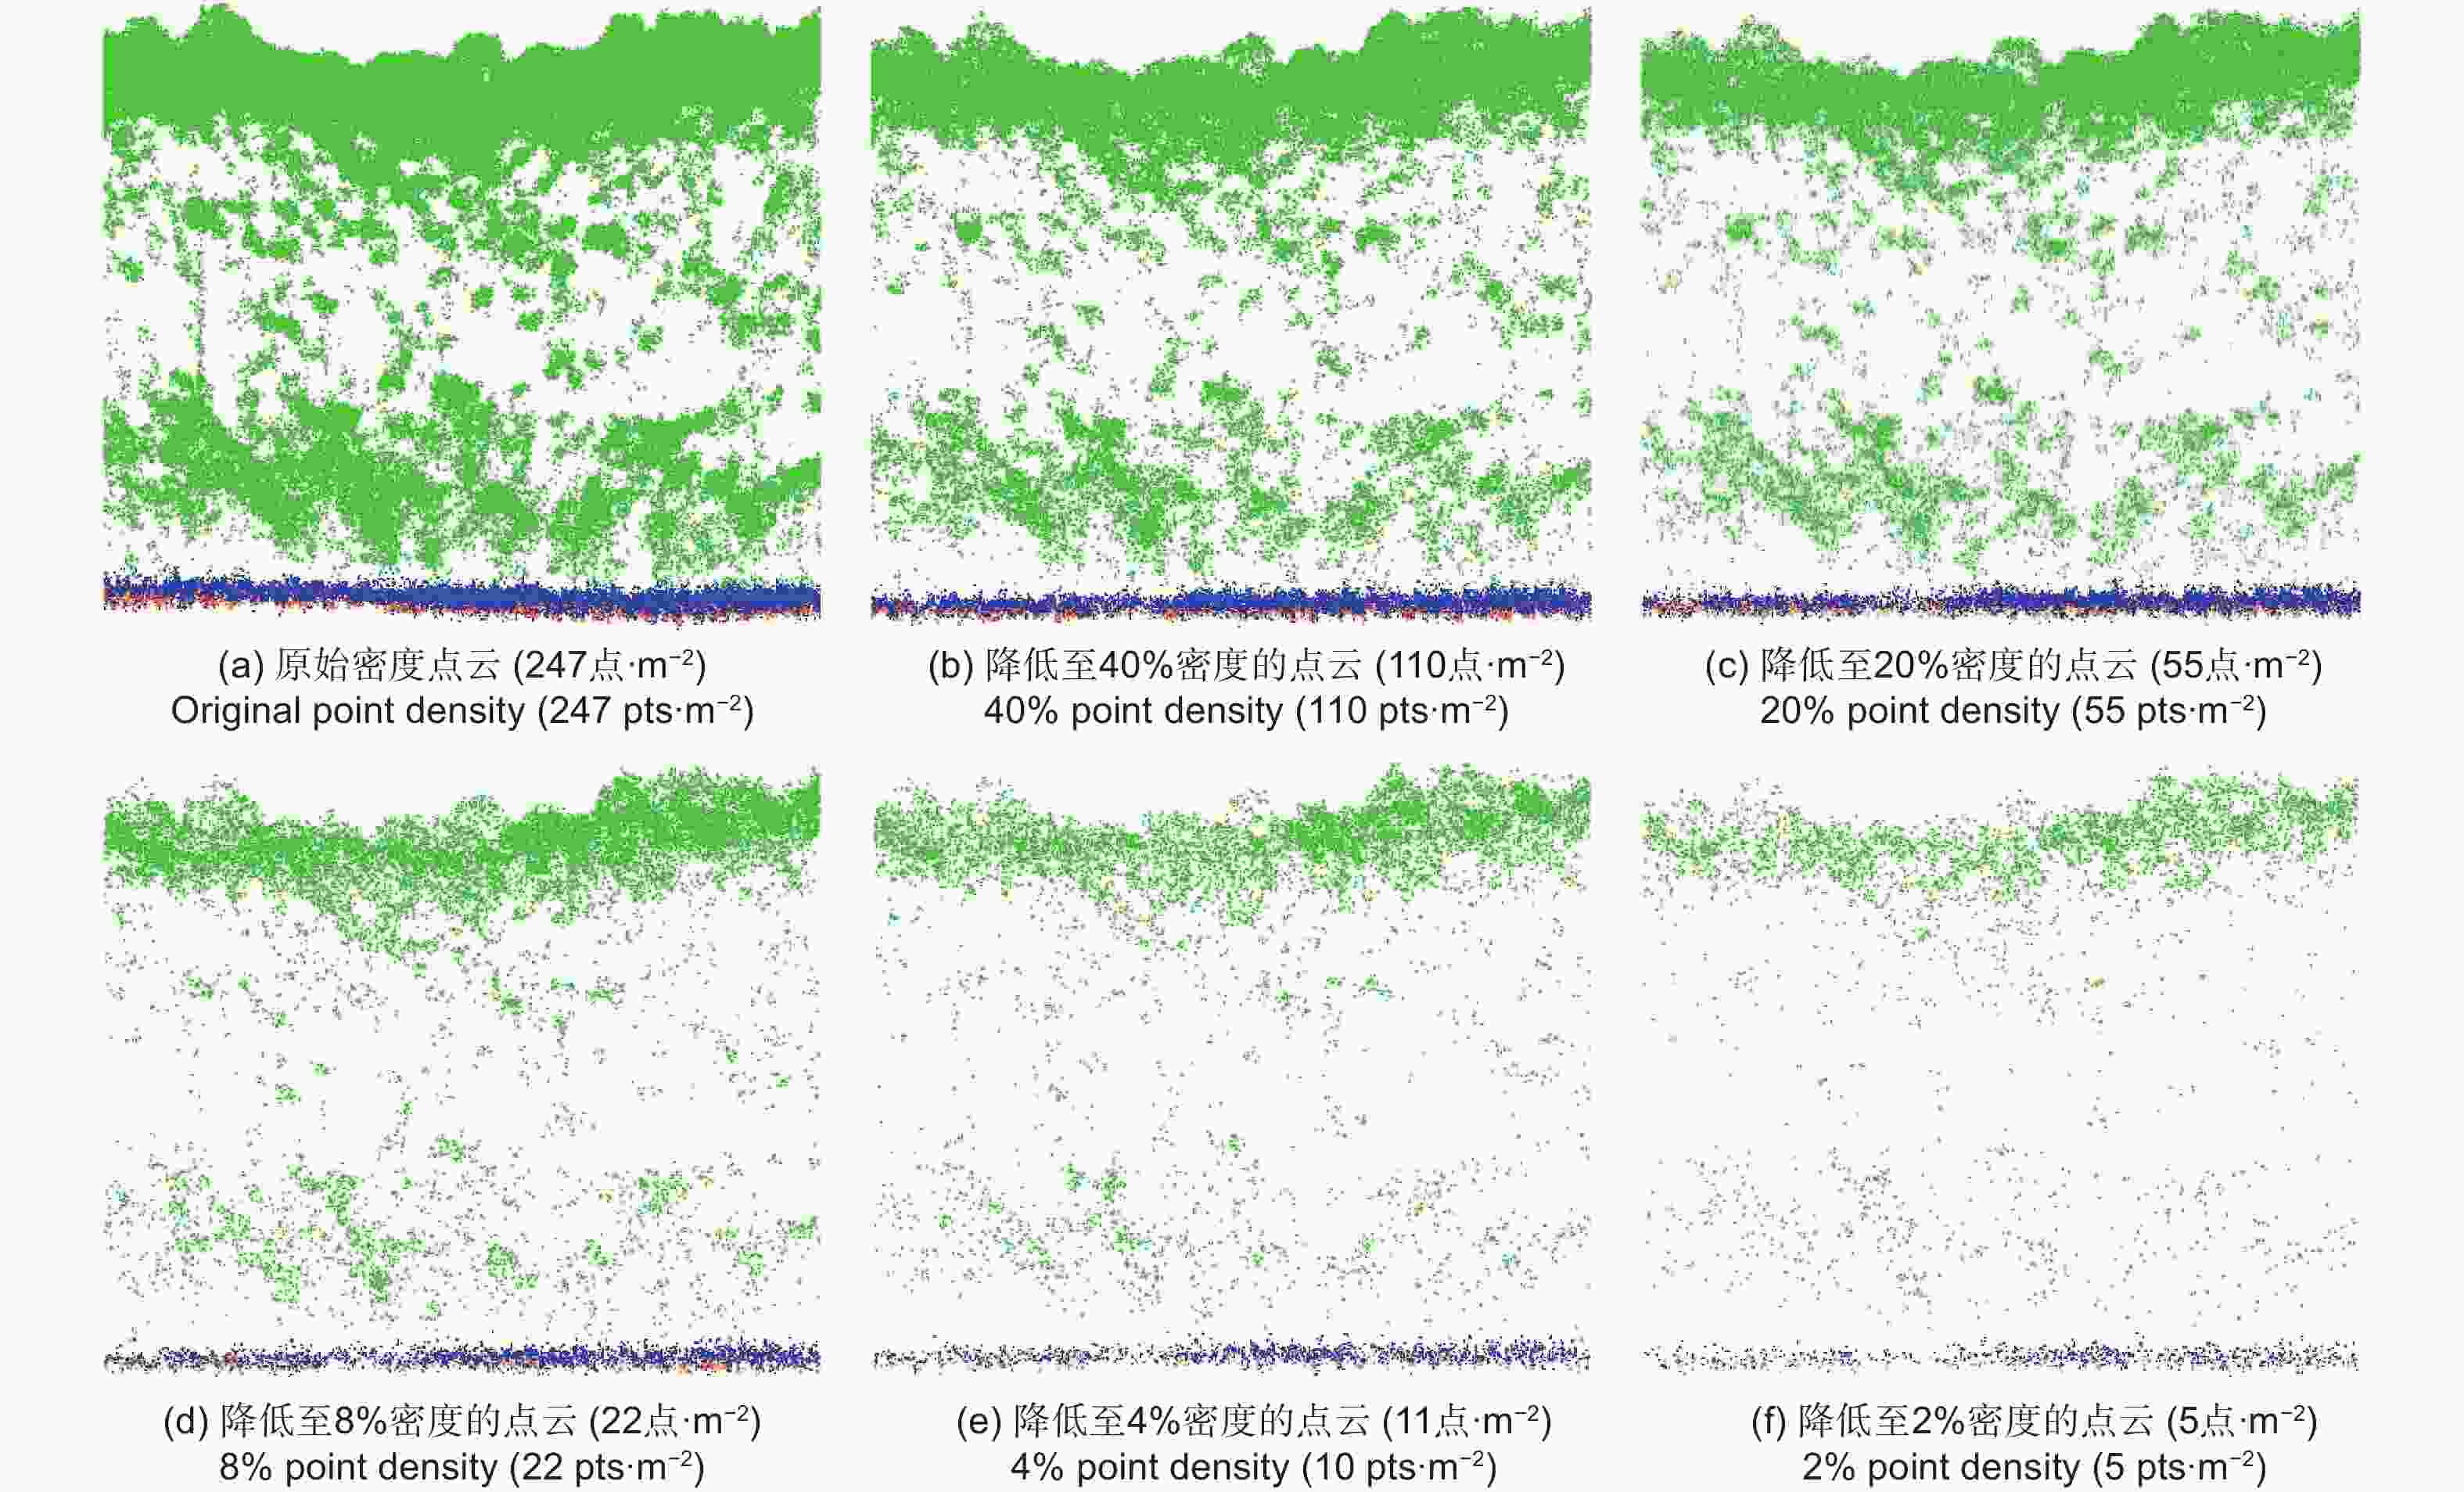
      Figure 1.  Vertical distribution of point cloud of a plot of percentage-based UAV-LiDAR data reduction

      采用TerraSolid软件对各个点云数据集进行独立预处理,包括:将点云分类为地面点和植被点,采用渐进式不规则三角网(TIN)加密滤波算法生产数字高程模型(DEM)。采用DEM对点云进行高程归一化处理,以消除地形影响。采用归一化点云数据,分别提取15个激光雷达变量,包括:25%、50%、75%和95%分位数高度(hp25、hp50、hp75和hp95),点云最大高(Hmax)、平均高(Hmean),点云高度的标准差(Hstd)和变动系数(Hcv);25%、50%和75%分位数密度(dp25、dp50和dp75),修正的郁闭度(CC)[21];叶面积密度的均值(LADmean)、标准差(LADstd)和变动系数(LADcv)[22]。以上15个变量可分为3组:高度变量、密度变量和垂直结构变量,每组变量从不同的角度对森林冠层的三维结构进行刻画。

    • 为使所建立的模型符合森林计测学原理并具有良好的可解释性,采用10个UAV-LiDAR变量(hp95、Hmean、Hstd、Hcv、dp50、dp75、CC、LADmean、LADstd和LADcv),通过有规则的穷举法变量组合方法[23-24],得到44个模型结构式,用于林分蓄积量(VOL)、断面积(BA)、平均高(H)和平均直径(DBH)估测。采用原始密度点云数据集,分别对44个模型结构式进行拟合,通过3个优度统计指标评价模型拟合效果,包括:决定系数(R2)、相对根方根误差(rRMSE)和平均预估误差(MPE)[25]。以rRMSE最小为标准确定最优模型,得到2个森林类型4个森林参数估测的最优模型,见表2

      森林类型
      Forest type
      森林参数
      Attribute
      模型 ModelsR2rRMSE/%MPE/%
      马尾松林
      Masson pine
      VOL$ VO{L_{Pine}} = 4.678{\text{ }}5Hmea{n^{1.485{\text{ }}4}}C{C^{ - 0.510{\text{ }}0}}LADst{d^{0.276{\text{ }}0}}Hst{d^{0.106{\text{ }}0}}dp{75^{ - 0.010{\text{ }}58}} $0.81312.974.81
      BA$ B{A_{Pine}} = 5.538{\text{ }}0Hmea{n^{0.737{\text{ }}4}}C{C^{ - 0.443{\text{ }}2}}LADst{d^{0.208{\text{ }}7}}HSst{d^{0.060{\text{ }}30}}dp{50^{0.203{\text{ }}4}} $0.67613.124.86
      H$ {H_{Pine}} = 0.429{\text{ }}0h{p^{1.023{\text{ }}2}}C{C^{0.706{\text{ }}5}}LADc{v^{0.055{\text{ }}65}}Hc{v^{ - 0.359{\text{ }}0}}dp{75^{ - 0.928{\text{ }}7}} $0.67614.695.44
      DBH$ DB{H_{Pine}} = 3.877{\text{ }}4h{p^{0.620{\text{ }}8}}C{C^{0.605{\text{ }}6}}LADc{v^{ - 0.353{\text{ }}3}}Hc{v^{ - 0.084{\text{ }}60}}dp{75^{0.060{\text{ }}19}} $0.54616.366.06
      桉树林
      Eucalyptus
      VOL$ VO{L_{Eucalyptus}} = 3.895{\text{ }}5hp{95^{1.311{\text{ }}5}}C{C^{1.620{\text{ }}3}}LADc{v^{0.591{\text{ }}5}}Hst{d^{0.083{\text{ }}83}}dp{50^{ - 0.020{\text{ }}20}} $0.96611.504.19
      BA$ B{A_{Eucalyptus}} = 3.076{\text{ }}1hp{95^{0.781{\text{ }}4}}C{C^{1.514{\text{ }}9}}LADc{v^{0.510{\text{ }}0}}Hc{v^{0.107{\text{ }}5}}dp{75^{0.045{\text{ }}61}} $0.91714.335.22
      H$ {H_{Eucalyptus}} = 2.467{\text{ }}8hp{95^{0.670{\text{ }}5}}C{C^{0.067{\text{ }}13}}LADc{v^{0.121{\text{ }}0}}Hc{v^{0.047{\text{ }}33}}dp{50^{ - 0.041{\text{ }}90}} $0.9228.122.96
      DBH$ DB{H_{Eucalyptus}} = 1.379{\text{ }}8hp{95^{0.727{\text{ }}3}}C{C^{0.127{\text{ }}9}}LADmea{n^{ - 0.053{\text{ }}60}}Hc{v^{0.032{\text{ }}93}}dp{75^{ - 0.062{\text{ }}12}} $0.9456.132.23

      Table 2.  The best models for estimating forest inventory attributes using original density dataset of point clouds and their goodness-of-fit statistics

      对于5个稀疏密度点云数据集,分别采用表2的结构式进行模型拟合,得到各个稀疏密度点云数据集的森林参数估测最优模型。本试验的目的是分析森林参数估测精度的点云密度效应,故不考虑样地数据的异方差,也不作模型检验,只将它们的优度统计指标与表2进行比较。UAV-LiDAR变量提取、模型拟合均采用Python软件(版本3.7.5)进行。

      采用配对样本t检验方法,分析各个稀疏密度点云数据集和原始密度点云数据集的森林参数估测值均值的差异。

    • 采用配对样本t检验方法,分析各个稀疏密度点云数据集和原始密度点云数据集15个激光雷达变量均值的差异。

    3.   结果
    • 各个稀疏密度点云数据集和原始密度点云数据集的森林参数估测模型的拟合效果十分接近,各个优度统计指标与随着点云密度的变化并未表现出有规律的变化(表2表3),说明点云密度对森林参数估测精度不产生明显的影响。

      森林类型
      Forest type
      参数
      Attribute
      优度统计指标
      Goodness-of-fit statistic
      100点(pts)∙ m−250点(pts)∙m−220点(pts)∙m−210点(pts)∙m−25点(pts)∙m−2
      马尾松林
      Masson pine
      VOLR20.8320.8480.8400.8120.847
      rRMSE/%12.2211.7112.0213.0211.73
      MPE/%4.704.344.454.824.35
      BAR20.6900.7160.7170.6930.733
      rRMSE/%12.5512.2912.2712.7811.92
      MPE/%4.834.554.554.734.42
      HR20.6850.7360.7290.7180.701
      rRMSE/%9.9913.2513.4313.6914.11
      MPE/%3.844.914.975.075.23
      DBHR20.5500.4840.5070.4500.435
      rRMSE/%16.7417.4417.0518.0018.24
      MPE/%6.446.466.326.676.76
      桉树林
      Eucalyptus
      VOLR20.9660.9650.9590.9590.959
      rRMSE/%11.5111.6712.5812.5812.58
      MPE/%4.434.254.584.584.58
      BAR20.8980.9060.8980.8980.898
      rRMSE/%16.0615.2815.8715.8715.87
      MPE/%6.175.565.785.785.78
      HR20.9060.9250.9240.9240.924
      rRMSE/%9.057.967.997.997.99
      MPE/%3.482.902.912.912.91
      DBHR20.9500.9480.9370.9370.937
      rRMSE/%6.055.976.556.556.55
      MPE/%2.332.172.382.382.38

      Table 3.  Fitting statistics of models for estimating forest inventory attributes with various reduced point density datasets

      各稀疏密度点云数据集森林参数估测结果与原始密度点云数据集森林参数估测结果的配对样本t检验结果表明:2个森林类型的4个森林参数估测值的均值都不存在显著性差异(p≥0.05)。

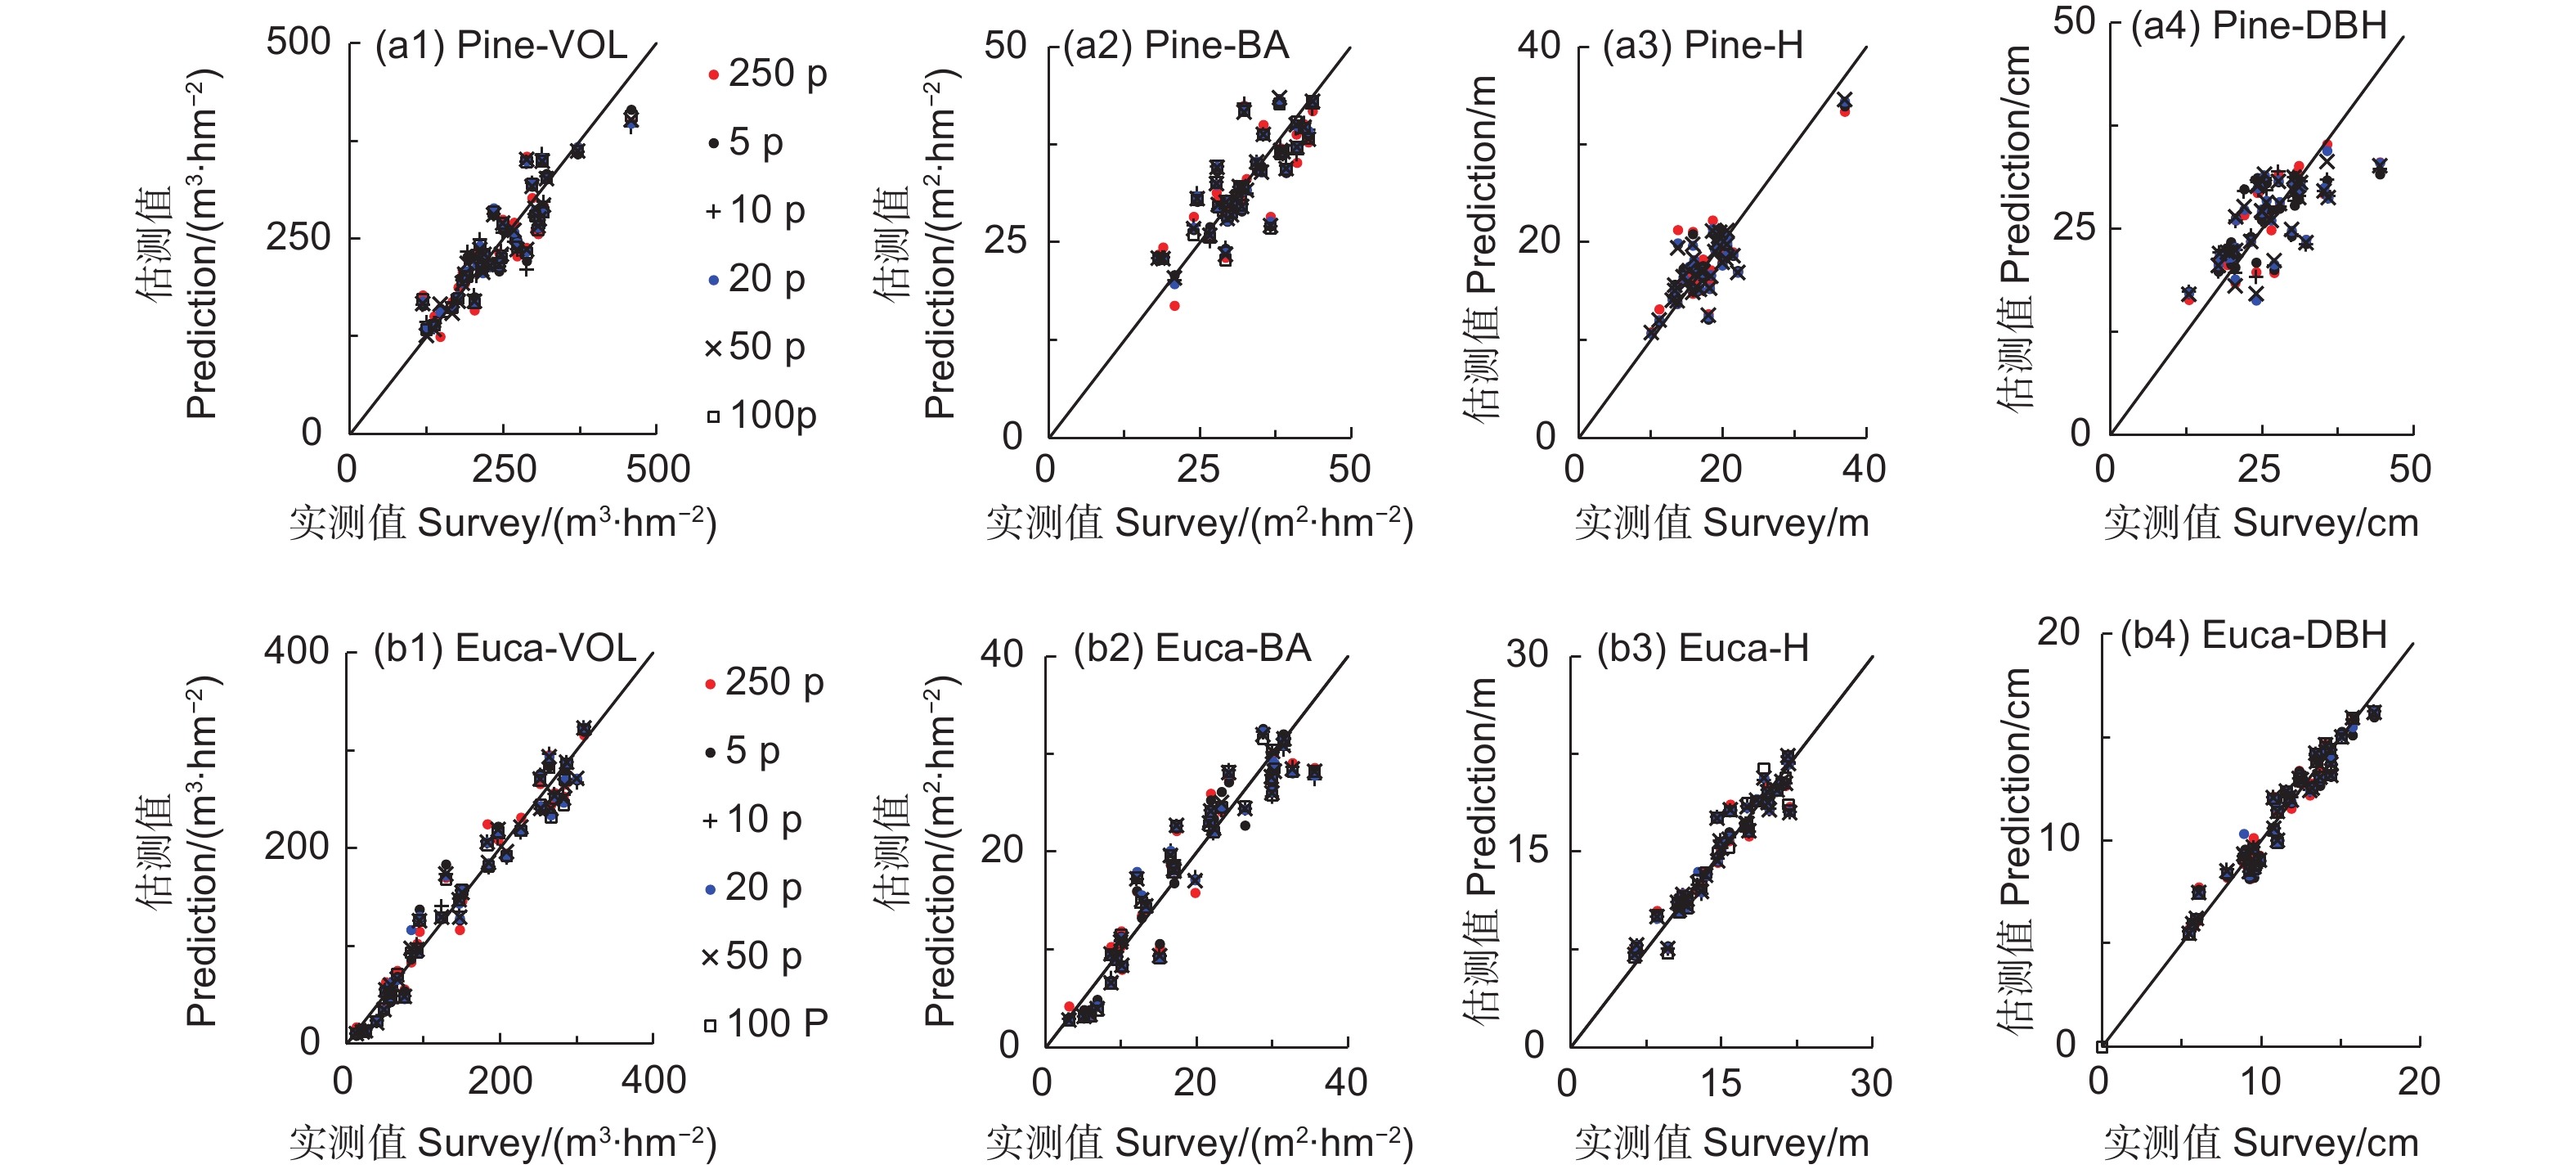
      将各个数据集的估测值与实测值进行比较,可以看出各个森林参数的估测值均随机分布于1∶1直线的两侧(图2),暗示着模型残差呈随机分布。

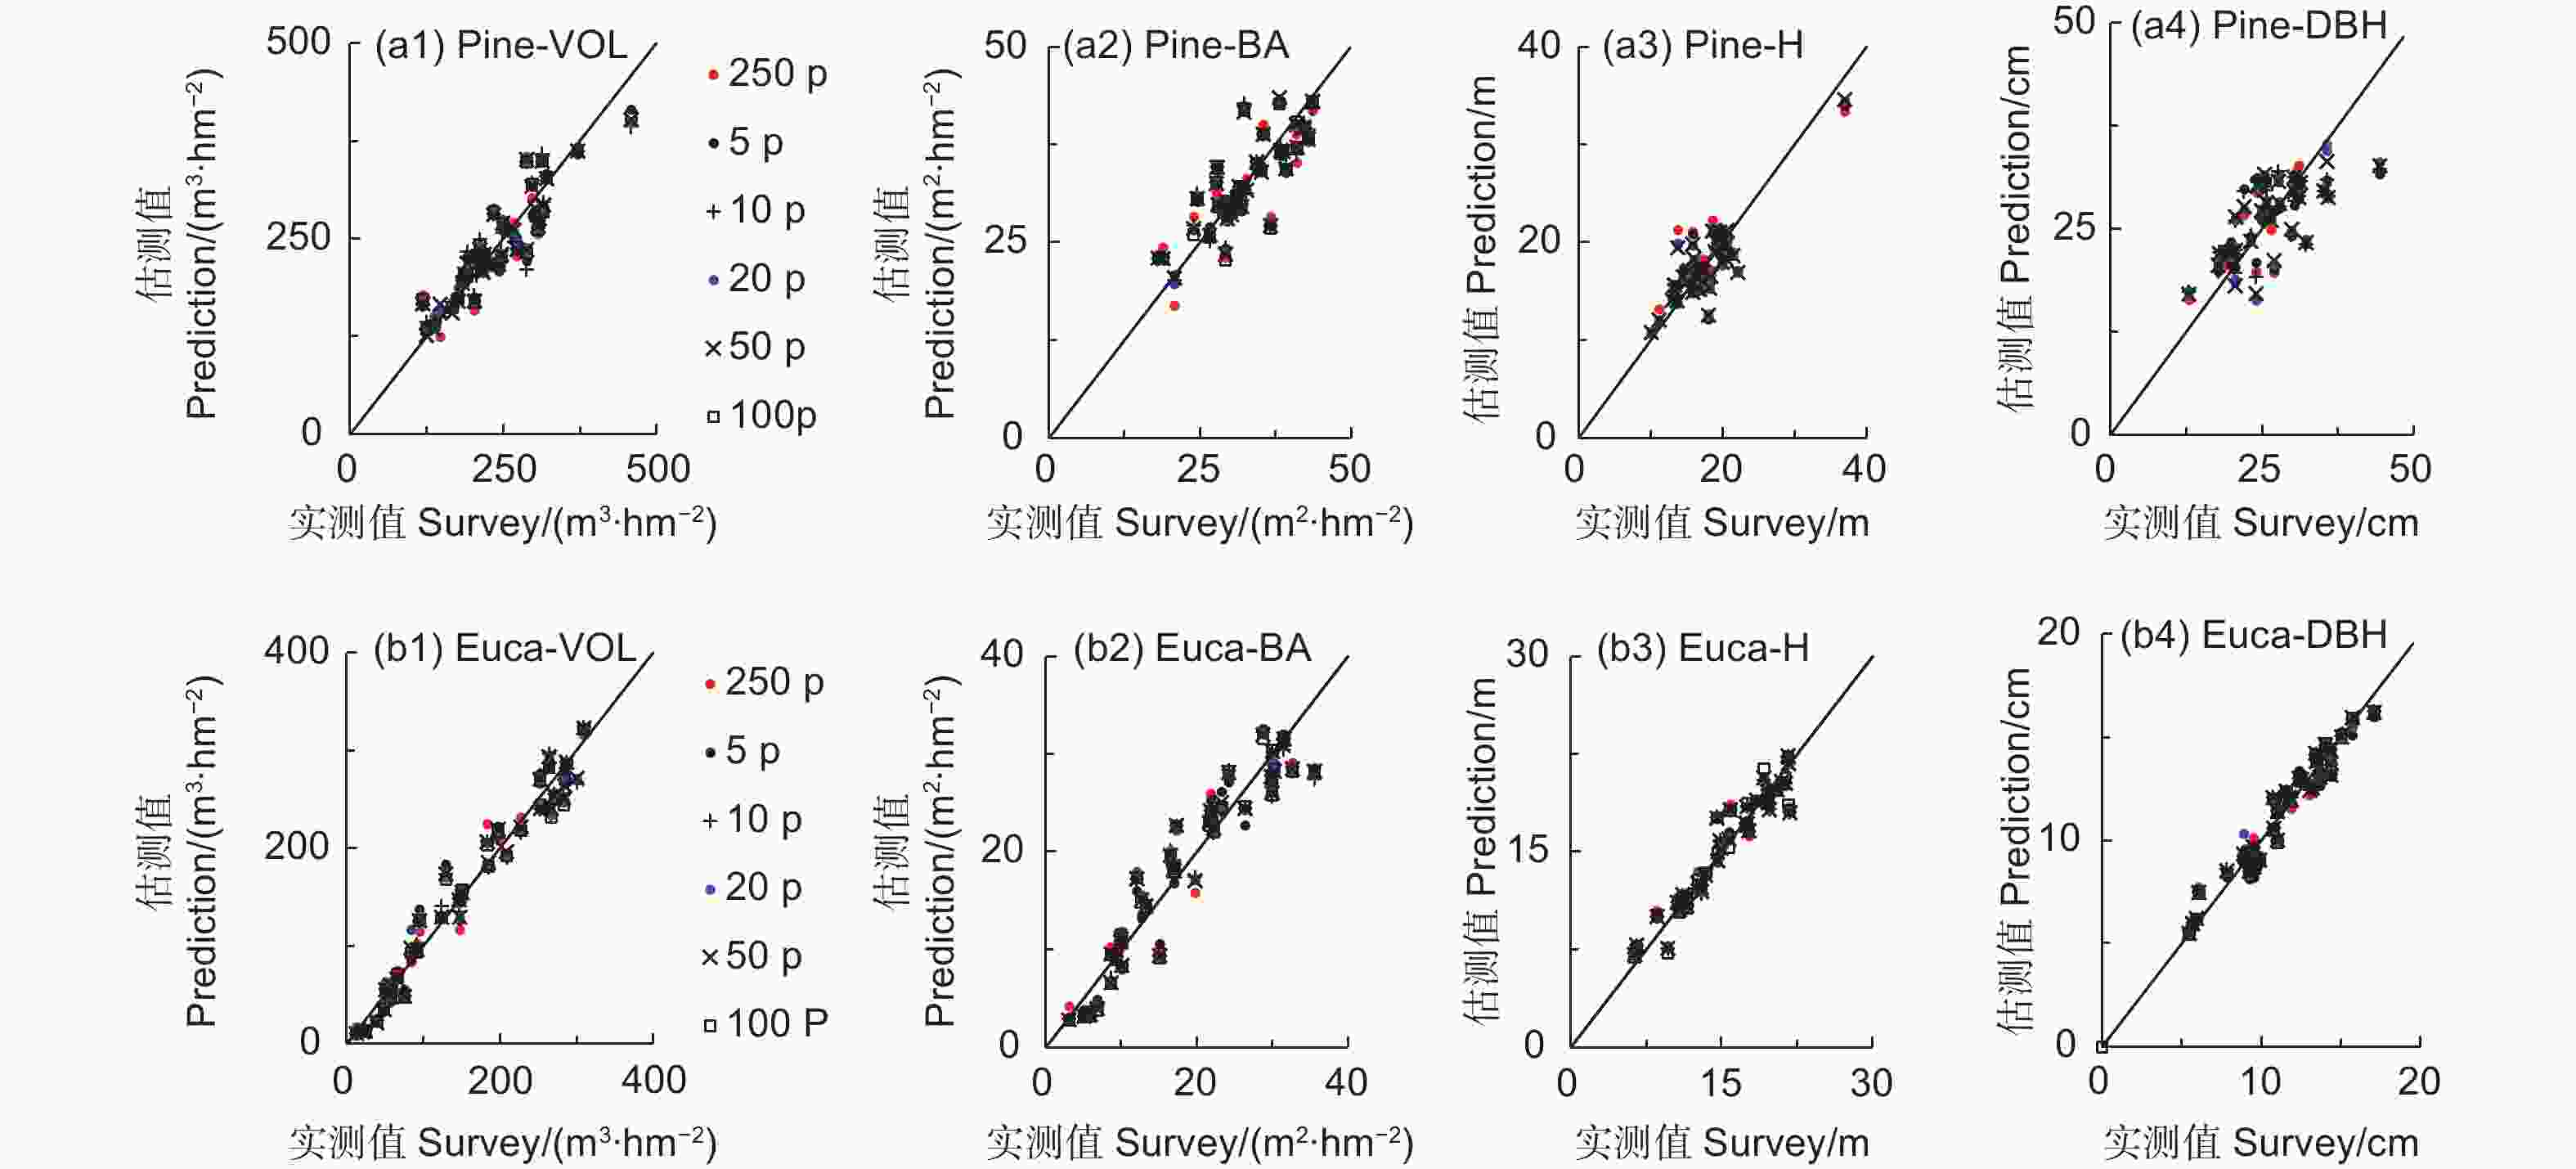
      Figure 2.  Scatterplots of survey VOL versus predicted VOL (a1, b1), survey BA versus predicted BA (a2, b2) and survey H versus predicted H (a3, b3) of the pine and eucalyptus forests. The250p, 100p, 50p, 20p, 10p and 5p represent the point density of 250, 100, 50, 20, 10 and 5 pts∙m−2, respectively

    • 各个稀疏密度点云数据集与原始密度点云数据集之间,同一激光变量的差值的均值都很小,接近于0,它们的标准差也很小,但一般比均值大一个数量级(表4)。配对样本t检验结果表明:除桉树林的Hstd和Hcv的均值在点云密度20、50和100点∙m−2存在有规律性的显著性差异(p<0.05)外,虽然其他少数变量的均值在少数密度也存在显著性差异(p<0.05),但它们不具规律性。总体而言,即使点云密度降低至5点∙m−2,它们的激光变量的均值与点云密度为247点∙m−2的激光变量的均值不存在显著性差异。

      点云密度
      Point
      density
      (点pts∙m−2)
      森林类型
      Forest type
      统计指标
      Statistic
      hp25hp50hp75hp95HmaxHmeanHstdHcvdp25dp50dp75CCLADmeanLADstdLADcv
      5vs.250马尾松林
      Masson pine
      均值 Mean-0.038ns0.002ns0.017ns0.052ns-0.237ns0.001ns0.019ns0.001ns0.002ns0.000ns0.028*0.000ns0.033ns0.035ns0.049ns
      标准差 SD0.4710.4830.4480.4990.7080.4260.1310.0080.0120.0200.0690.0070.1130.1250.362
      桉树林
      Eucalyptus
      均值 Mean0.129ns0.131ns0.129ns0.159*-0.085ns0.112ns0.072*0.005ns0.002ns0.004ns0.012ns0.006ns0.032*0.057ns0.019ns
      标准差 SD0.6410.4820.4230.4531.4430.3900.1740.0230.0300.0270.0650.0410.0850.2780.259
      10vs.250马尾松林
      Masson pine
      均值 Mean0.028ns-0.015ns-0.014ns0.040ns-0.068ns0.012ns-0.015ns-0.002ns0.004ns-0.001ns0.011ns0.000ns0.008ns0.025ns0.055ns
      标准差 SD0.4180.4540.4530.4811.0400.4220.0880.0090.0140.0240.0780.0080.0450.0970.287
      桉树林
      Eucalyptus
      均值 Mean0.000ns0.099ns0.071ns0.067ns-0.191ns0.045ns0.052ns0.005ns0.001ns0.005ns0.017**-0.002ns0.019ns0.052ns0.053ns
      标准差 SD0.5840.4520.4660.4930.6880.4040.1750.0160.0250.0200.0300.0240.0820.2770.337
      20vs.250马尾松林
      Masson pine
      均值 Mean-0.038ns-0.024ns-0.036ns0.014ns-0.163ns-0.025ns0.001ns0.000ns0.002ns-0.001ns0.014ns0.000ns0.006ns0.012ns0.021ns
      标准差 SD0.4240.4500.4350.4460.6150.4080.0990.0080.0130.0150.0500.0060.0400.0900.224
      桉树林
      Eucalyptus
      均值 Mean-0.025ns0.111ns0.112ns0.125ns0.000ns0.047ns0.094**0.008**-0.002ns-0.002ns0.005ns0.000ns0.007ns0.036ns0.043ns
      标准差 SD0.5940.4280.4290.5220.8500.3910.1670.0140.0200.0260.0510.0210.0410.1920.262
      50vs.250马尾松林
      Masson pine
      均值 Mean-0.017ns-0.051ns-0.047ns-0.012ns-0.118ns-0.034ns-0.011ns0.000ns0.004ns-0.002ns0.004ns0.000ns0.004ns0.021ns0.029ns
      标准差 SD0.4040.4460.4360.4680.6180.4060.0880.0060.0150.0150.0580.0060.0350.1450.215
      桉树林
      Eucalyptus
      均值 Mean-0.009ns0.084ns0.081ns0.056ns-0.051ns0.030ns0.067**0.006**-0.004ns-0.001ns0.007ns-0.006ns-0.005ns0.004ns0.031ns
      标准差 SD0.5580.4340.4430.4870.6140.3950.1590.0140.0200.0180.0270.0390.0380.0300.165
      100vs.250马尾松林
      Masson pine
      均值 Mean-0.005ns-0.038ns-0.059ns-0.029ns-0.051ns-0.031ns-0.024ns-0.001ns0.001ns-0.001ns-0.002ns-0.001ns-0.005ns-0.006*-0.002ns
      标准差 SD0.3990.4360.4380.4670.5290.4030.0930.0050.0060.0090.0500.0050.0220.0150.043
      桉树林
      Eucalyptus
      均值 Mean-0.064ns0.060ns0.045ns0.015ns-0.074ns0.002ns0.055*0.006*-0.005ns-0.005ns0.007ns-0.003ns0.003ns0.001ns0.005ns
      标准差 SD0.5690.4250.4420.4730.5280.3950.1450.0120.0190.0200.0300.0210.0400.0260.077
      注:*,**和***分别表示p<0.05,p<0.01和p<0.001时存在显著性差异,ns表示p≥0.05时不存在显著性差异;SD为标准差。
        Note: Level of significance: *p<0.05; **p<0.01; ***p<0.001; ns=not significant (p≥0.05); SD=standard derivation.

      Table 4.  Mean and stand deviation (SD) for the differences of LiDAR-derived metrics between the original point density (247 pts∙m−2) and various reduced point densities (100, 50, 20, 10, 5 pts∙m−2) of two forest types and the result of paired t-test

      随着点云密度的降低,部分变量差值的均值呈增大的趋势,另一部分变量差值的均值则呈无规律的变化,但大部分变量差值的标准差均呈缓慢增大的趋势(表4)。

      以上说明,即使密度由247点∙m−2降低至5点∙m−2,激光点云的水平和垂直分布特征基本一致,亦即不同密度点云对林分冠层三维结构的刻画效果基本相同。

    4.   讨论
    • 由于飞行高度低、速度慢,无人机激光雷达的点云密度一般都较大,通常为200点∙m−2以上[13-15],数据量庞大。因此,无人机激光雷达数据获取和预处理的费用较高(本试验为3 000元∙hm−2)。本试验的数据获取共飞行了40架次,耗时约22 h,数据量超过30 GB,数据获取和预处理效率较低。因此,在满足需要的前提下,降低点云密度,减少数据获取和预处理成本,提高工作效率,是无人机激光雷达森林资源调查监测应用面临的一个重要问题。

      本试验结果表明,即使点云密度低至5点∙m−2,森林参数的估测精度几乎不受影响。其原因可能是:在采用百分比进行点云密度稀疏时,保留点云是从每个回波的等高点中按总点数的百分比随机选取的,尽管整个UAV-LiDAR瓦片和样地的点间距及点密度不同,但各个瓦片和样地的采样效果几乎是一致的[17]。由于稀疏密度点云与原始点云的空间分布特征基本一致[18],由稀疏密度点云提取的激光变量的均值和原始点云提取的激光变量的均值没有显著性差异(表4),从而使得稀疏密度点云数据集和原始密度点云数据集的森林参数估测结果基本相同。根据本试验的结果,在林分尺度无人机激光雷达森林资源调查监测应用中,点云密度可低至5点∙m−2。此时,数据获取和预处理费用可比原始密度的数据获取和预处理费用降低一半左右。

      点云密度对机载激光雷达森林参数估测精度影响的研究较为全面和深入[26-28]。一般认为,点云密度1点∙m−2可满足森林参数估测需要[29],甚至有研究认为,当点密度降低至0.035点∙m−2时,森林参数估测精度不受影响[30]。挪威大面积森林资源调查应用的点云密度为0.7点∙m−2左右[31]。由于无人机的飞行高度较低、速度较慢,当激光雷达点云密度低于5点∙m−2时,其技术经济可行性有待于进一步的研究。飞行高度是决定点云获取效率最关键的因素。有研究表明,同一传感器(ALTM 1233)采用相同的脉冲重复频率(50kHz)在1100 m和2 000 m获取不同密度(1.4和1.2点∙m−2)的机载激光雷达数据中,hp50、Hmean、Hcv和dp50存在显著性差异(p>0.05),hp10、hp90、Hmax、dp10和dp90不存在显著性差异,林分蓄积量和平均高估计值的平均相差分别为10.7%和2.5%[32]。对于无人机而言,同一传感器在设置相同的扫描角时,不同飞行高度获取的点云密度不同,这些点云数据是否具有相同的空间分布特征?亦即是否如一些研究者指出的那样,百分比重采样能够真实地模拟了在不同飞行高度获得的LiDAR数据[16]?是否具有相近的森林参数估测精度?仍有待于进一步的研究。

    5.   结论
    • 本研究采用百分比重采样将原始点云进行抽稀,通过乘幂模型分析了点云密度对林分尺度无人机激光雷达森林参数估测精度的影响。当点云密度由247点∙m−2降低5点∙m−2时,马尾松和桉树人工林的森林参数估测精度不受影响。

      各个稀疏密度点云(100、50、20、10、5 点∙m−2)数据集的各个森林参数估测值与原始密度点云数据集的估测值十分接近,它们的均值不存在显著性差异(p≥0.05)。各个稀疏密度点云数据集的激光雷达变量的均值和原始密度点云数据集相应的激光变量的均值基本上不存在有规律的显著性差异,这是点云密度降低不影响森林参数估测精度的原因。然而,不同飞行高度获取不同密度的点云数据是否具有相同的空间分布特征,是否得到相近的森林参数估测精度,有待于进一步的实证研究。

Reference (32)

Catalog

    /

    DownLoad:  Full-Size Img  PowerPoint
    Return
    Return